Going Low: Understanding Limit of Detection in Gas Chromatography
A review of the history and fundamentals for determining and reporting limit of detection (LOD) for analytical instruments and methods. Includes a discussion of the International Union of Pure and Applied Chemistry (IUPAC) and propagation of errors methods used for calculating LOD, and explains the limitations of the IUPAC method in modern chromatography.
Limit of detection (LOD) is among the most important and misunderstood analytical variables of merit for both instruments and analytical methods. In this instalment, we review the history and fundamentals for determining and reporting LOD for analytical instruments and methods. We also discuss the International Union of Pure and Applied Chemistry (IUPAC) and propagation of errors methods used for calculating LOD and explain the limitations of the IUPAC method in modern chromatography. We used simulated data to discuss the implications of the calculation method, and talk about the reported LOD values and our understanding of the sources of experimental uncertainty and variability in LOD determinations.
Limit of detection (LOD) is among the most calculated and most misunderstood analytical figures of merit for instruments and methods. We are first exposed to LOD in undergraduate analytical chemistry textbooks. LOD is among the most reported figures of merit in validated methods, literature articles, and advertising literature. The International Union of Pure and Applied Chemistry (IUPAC) defines LOD as “the smallest concentration or absolute amount of analyte that has a signal significantly larger than the signal from a suitable blank” (1). As a result, this statement informs us that LOD can be expressed in concentration or mass units and that the analyte must produce a signal that can be deemed greater than a blank by a statistical test. In practice, a “signal significantly larger” means that the analyte signal should have a value two or three times the blank.
The best way to determine LOD is to measure it directly by preparing standards at appropriately low concentrations and analyzing them on the instrument or running them through the method procedure. Analysts should know that experimental errors involved in the standard preparation and dilution procedure as well as the inherent 33–50% relative variance that is inherent in a measurement where the signal is only two or three times the instrumental noise in the blank will factor into the LOD measurement. This means that LOD values should be reported to one significant digit only. Reporting LOD to more than one significant digit is one of the most common mistakes seen throughout the literature.
LOD is usually calculated rather than measured directly. The classical methods for calculating LOD were developed using spectroscopic and electrochemical instruments in the 1960s and 1970s (2–4). Chromatographers have generally adapted these methods to gas chromatography (GC) and high performance liquid chromatography (HPLC), although there are fundamental differences between spectroscopic and chromatographic instruments.
In 1983, Long and Winefordner provided a review and critical discussion of LOD calculation methods that still provides useful insights nearly 40 years later (5). Their article is still cited as additional reading material for the discussions of LOD found in the instrumental analysis textbooks of today (6,7). More recently, in 2015, Krupcik and others provided a detailed statistical analysis of LOD and limit of quantification (LOQ) calculations in gas chromatography–flame ionization detection (GC–FID) and comprehensive two-dimensional gas chromatography–flame ionization detection (GC×GC–FID) analyses (8). They evaluated methods based on the classical IUPAC method and using signal-to-noise (S/N) ratios and found significant differences between LOD and LOQ calculated by each method in both GC and GC×GC. The results of LOD determinations are highly dependent on both the calculation method used and on how any standards used for the analysis are prepared. At a minimum, for LOD to be comparable between methods and instruments and repeatable between experiments, the calculation and the standard preparation should be reported in much more detail than is typical in the chromatographic literature.
In the remainder of this article, we focus on a critical evaluation of the classical IUPAC definition for LOD, applied to chromatography, because this is the most widely practiced method. In determining LOD, most authors cite the classical IUPAC calculation equation, shown in equation 1, which states:

where CL is the limit of detection, usually expressed in concentration units, sB is the standard deviation of the signal generated by multiple blank measurements, or in the case of a chromatographic analysis, the signal for multiple data points recorded along the baseline, m is the slope of the calibration curve, and k is usually two or three, depending on the specific LOD definition chosen. This has been a matter of debate over the years. Long and Winefordner recommend k = 3 as the lowest value that provides a statistically significant difference between the signal and the noise. I agree with this as LOD should be reported conservatively, as we will see below, and k = 3 provides over 90% confidence that the signal is not noise. If performing LOD determinations for method validation in a regulated environment, the definition recommended by the regulating authority should be used.
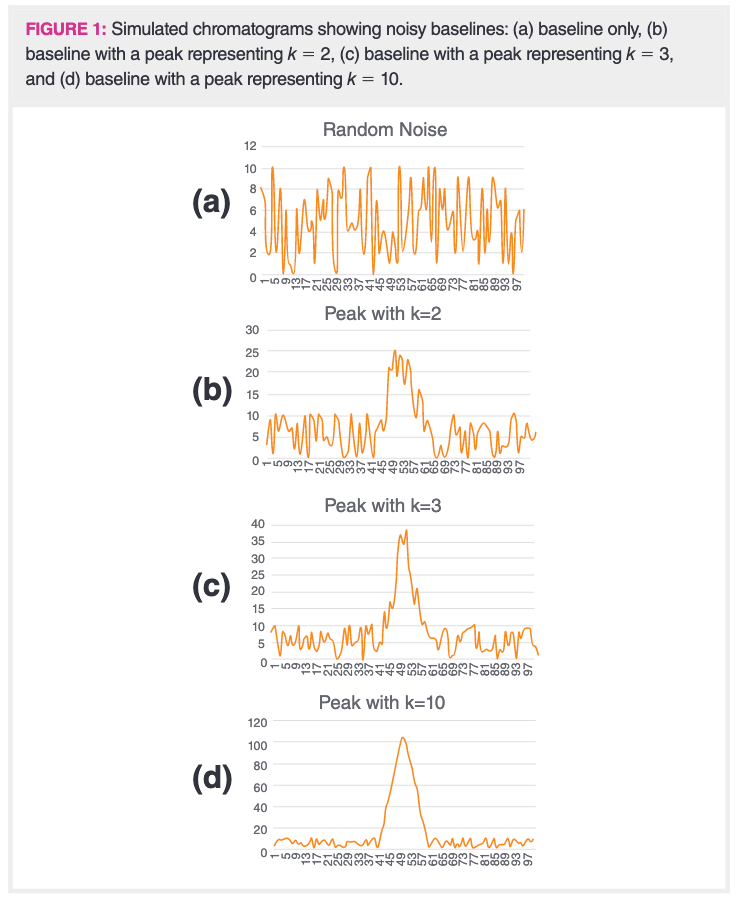
Before going into more details of LOD calculations, it is educational to look at data showing very low signals and instrumental noise. Figure 1 shows four plots, each with very low signal. Figure 1(a) shows 100 data points of simulated random instrumental noise, generated by the random number generator function in Microsoft Excel. This could be interpreted as 5 s of the noise generated by a flame ionization detector, with no analyte passing through the detector, operating at a sampling rate of 20 Hz. Every 20 values on the x-axis represents 1 s of data collection. The y-axis data are random numbers between 0–10. As seen in Figure 1(a), the noise is random. The baseline would be expressed as a signal of 5, the midpoint of the noise, which ranges from 0 to 10.

Figure 1(b) shows a small peak that is 1 s (20 data points) wide with the peak height representing k = 2, a common usage in LOD calculations. Note that the peak does not appear symmetrical, as the random noise still comprises much of the signal. This is typical of actual experimental data for analyses performed on samples at or near the LOD. Both peak area and peak height determinations for this peak would have large amounts of experimental uncertainty. This leads to the important point made earlier that LOD should never be reported to more than one significant digit. Any additional claimed precision in an LOD determination is meaningless.
Figure 1(c) shows a 1 s wide peak representing k = 3 in equation 1, the recommended value. The peak, while still noisy, looks more like a traditional chromatographic peak. The peak height and peak area are still subject to experimental uncertainty approaching (1/3) or 33%, still making this a one significant digit estimate. One result of this is that the peak height or peak area for small signals, in the same order of magnitude of the noise, should be reported with one or two significant digits, no matter how many digits the data system provides in the peak table. Furthermore, the retention time, reported as the peak maximum, may also be more variable than implied by the number of digits provided by the data system.
Figure 1(d) shows a 1 s wide peak representing k = 10 in equation 1, a typical value for LOQ that is often determined when validating a method or when determining analytical figures of merit. This looks more like a useful chromatographic peak and the peak height and area are now subject to experimental uncertainties around 10%, making this a two‑significant digit determination in many cases. However, the peak is still subject to significant impact from the random instrumental noise. LOQ is typically stated as the lowest concentration or mass for which quantitation would be effective and k = 10 is often used with equation 1 to determine this value.

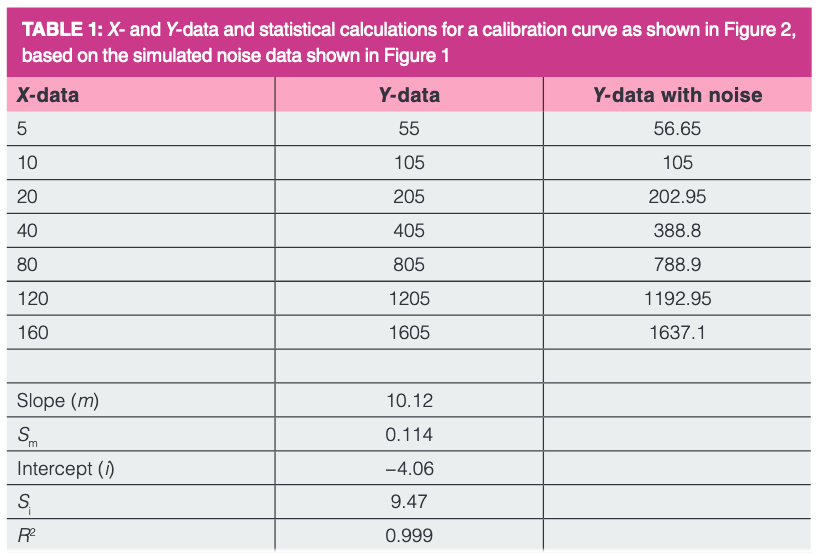
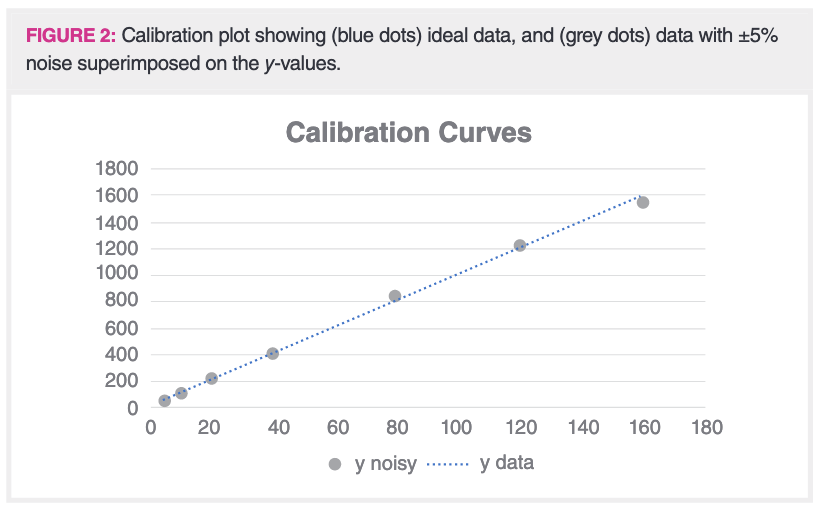
Figure 2 is a calibration plot showing sample data, typical of detection limit calculations, and Table 1 shows the x- and y-data and the statistics for the regression line. The calculations were performed using Microsoft Excel and the statistical calculations were performed using the LINEST function. The y-intercept of five for the line was chosen from the average baseline values shown in Figure 1 and is illustrative of an instrument with a non‑zero baseline. The slope of 10 was chosen as an illustration and provides data over a range of approximately 50–2000 of our arbitrary units, or about 1.5 orders of magnitude, typical of many calibration curves, and with the lowest point near the LOD. The random number generator function in Microsoft Excel was used to superimpose noise of +/− 5% on each of the y-data points. The blue dotted line represents the original noise‑free y‑values, and the grey dots represent the same values with the random noise added. Note that they do not perfectly overlap. We all know that on a calibration curve, the best fit line and the data points do not always match up, yet by using equation 1 to calculate LOD, we assume that they do.

In Table 1, the x-data points are shown, along with the y-data without noise and the y-data with noise. Below these are the statistical results for the slope and intercept, their standard errors and the R2 value, based on the noisy data.
As seen in equation 1, the IUPAC equation is dependent on the amplitude of the baseline noise, which can be measured directly from the baseline of the chromatogram, preferably in a region near the peak of interest and the slope of the calibration curve. For this example, Figure 1(a) was used as the baseline noise. Note that equation 1 does not provide any specification on the region of the calibration curve that is used or its relationship to the ultimately determined LOD. More importantly, there is no accounting for experimental uncertainty in the slope of the calibration curve. The LOD determination is only as good as the instrument and the standards used to measure it.
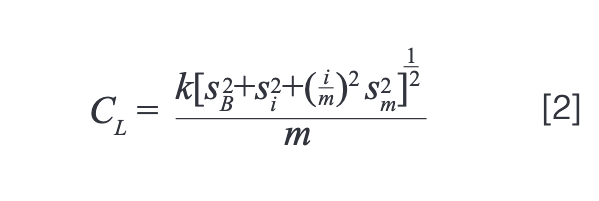
An alternate approach, discussed by Long and Winefordner and based on similar principles to the IUPAC equation method that employs propagation of errors accounting for experimental uncertainty in the calibration curve or standard preparation, is described by equation 2:

where the propagation of errors method includes terms for experimental uncertainty in both the slope (sm) and y-intercept (si) of the calibration curve. The need to include slope uncertainty is clear; this cannot be assumed to be zero. Intercept uncertainty accounts for a non-zero baseline, as does the presence of a term for the amplitude of the baseline itself (i). In short, all experimental values that impact LOD determination are included. Equation 2 reduces to the IUPAC method (equation 1) if the data are background corrected, providing a baseline of zero and the uncertainties on the slope and intercept of the calibration curve are near zero or much lower than the uncertainty on the baseline.

Table 2 shows the results of five LOD determinations using our simple calibration curve simulator, as seen in Figure 2, with the propagation of errors calculation shown in equation 2, with k = 3, the slope (m) of 10, y-intercept (b) of 5 and standard deviation of the blank (sB) of 5. Using the IUPAC calculation in equation 1, the result for LOD would be 1.5 (rounded up to 2 for reporting as one significant digit) for all the determinations because the slope does not change. For this illustration, the standard errors reported from the LINEST function in Excel were used for the uncertainties on the slope and intercept without any further calculations. In all cases, the propagation of errors method provided a LOD equal to or greater than the IUPAC method. In this example, it is easily seen that the uncertainty on the y-intercept is the major contributor to the increase and that uncertainty on the slope is negligible. This might not always be the case, but it is clear that uncertainties in standard preparation or calibration curve generation contribute to the LOD and should be accounted for, especially in situations such as gas chromatography tandem mass spectrometry (GC–MS/MS) and GC×GC where instrumental noise is likely to be very low.
Thinking back to the context in which the classical IUPAC equation was developed, it is important to consider that hand calculators did not exist and calculators or software that would easily perform any kind of linear regression would not calculate uncertainties on the slope and intercept values determined by linear regression. Those calculations are difficult, time‑consuming, and prone to mistakes, if performed by hand. Further, analogue instrumentation was often much noisier than today’s digital systems, making instrumental noise sources more common than the experimental uncertainty in standard preparation using volumetric glassware. Today, the reverse situation is much more likely. Instrumental noise is much lower, especially when multidimensional detectors such as MS/MS are used, making uncertainty in the standard preparation much more important in the LOD calculation.
There is much more to determining a LOD than simply looking up the IUPAC equation or other formula required by a regulatory body, whether that is examining the noise on a chromatogram, making a calibration curve, determining the slope, or calculating a value. We see that the LOD is dependent on several variables, including the instrumental noise and sensitivity, the uncertainty in the sensitivity and the calculated y-intercept of the calibration curve. At the very least, for LOD values to be comparable between instruments and methods, the calculation method should be clearly stated and sample calculations, including the uncertainties in the blank and calibration curve, should be provided in method reports or publications.
References
- IUPAC Gold Book, https://goldbook.iupac.org/terms/view/L03540, accessed April, 2021.
- J.D. Ingle, Jr., J. Chem. Educ. 51(2), 100–105 (1974).
- H. Kaiser, Anal. Chem. 42(2), 24A–41A (1970).
- H. Kaiser, Anal. Chem. 42(4), 26A–58A (1970).
- G.L. Long and J.D. Winefordner, Anal. Chem. 55(7), 712A–724A (1983).
- G.D. Christian, P.K. Dasgupta, and K.A. Schug, Analytical Chemistry, (John Wiley and Sons, New York, USA, 7th ed., 2013).
- D.A. Skoog, D.M. West, F.J. Holler, and S.R. Crouch, Fundamentals of Analytical Chemistry (Cengage, New York, USA, 9th ed., 2014).
- J. Krupcik, P. Majek, R. Gorovenko, J. Blasko, R. Kubinec, and P. Sandra, J. Chromatogr. A. 1396, 117–130 (2015).
ABOUT THE AUTHOR
Nicholas H. Snow is the Founding Endowed Professor in the Department of Chemistry and Biochemistry at Seton Hall University, New Jersey, USA, and an Adjunct Professor of Medical Science. During his 30 years as a chromatographer, he has published more than 70 refereed articles and book chapters and has given more than 200 presentations and short courses. He is interested in the fundamentals and applications of separation science, especially gas chromatography, sampling, and sample preparation for chemical analysis. His research group is very active, with ongoing projects using GC, GC–MS, two-dimensional GC, and extraction methods including headspace, liquid–liquid extraction, and solid-phase microextraction.
Direct correspondence to: amatheson@mjhlifesciences.com

New Study Reviews Chromatography Methods for Flavonoid Analysis
April 21st 2025Flavonoids are widely used metabolites that carry out various functions in different industries, such as food and cosmetics. Detecting, separating, and quantifying them in fruit species can be a complicated process.
University of Rouen-Normandy Scientists Explore Eco-Friendly Sampling Approach for GC-HRMS
April 17th 2025Root exudates—substances secreted by living plant roots—are challenging to sample, as they are typically extracted using artificial devices and can vary widely in both quantity and composition across plant species.
Sorbonne Researchers Develop Miniaturized GC Detector for VOC Analysis
April 16th 2025A team of scientists from the Paris university developed and optimized MAVERIC, a miniaturized and autonomous gas chromatography (GC) system coupled to a nano-gravimetric detector (NGD) based on a NEMS (nano-electromechanical-system) resonator.

.png&w=3840&q=75)

.png&w=3840&q=75)


.png&w=3840&q=75)


.png&w=3840&q=75)


