Where Has My Efficiency Gone? Impacts of Extracolumn Peak Broadening on Performance, Part 1: Basic Concepts
This instalment focuses on basic concepts in extracolumn dispersion (ECD) that occurs in high performance liquid chromatography (HPLC) systems, and the impact of this dispersion on the performance of columns of different dimensions and efficiencies.
Dispersion (the broadening or spreading) of analyte zones (peaks) outside of chromatography columns can seriously erode the resolution provided by good columns. Understanding the relationship between the level of dispersion associated with a given instrument relative to the intrinsic efficiency of a given column can help avoid disappointing results, especially when switching to new column technologies. In this instalment, we focus on basic concepts in extracolumn dispersion as a prelude to future instalments that will focus on dispersion in specific elements of high performance liquid chromatography (HPLC) systems.
Even from the very early days of the development of chromatography “systems” that provided for mechanized introduction of samples into the mobile phase flow path, it was recognized that dispersion of analyte zones outside of the separation column could compromise the quality of the separation as measured by resolution (1). During the 400‑bar era of liquid chromatography (LC) that lasted through the mid‑2000s, instrument manufacturers worked to adjust the dimensions of component parts, including connecting tubing and detector elements, so that the impact of dispersion of the analyte zone outside of the column was manageable, and did not seriously affect separation performance in most cases. However, the introduction of instruments capable of separating at much higher pressures (for example, 1000 bar and beyond) starting in the mid-2000s precipitated a dramatic growth in the use of narrower columns (mostly 2.1 mm i.d.) prepared with smaller particles (that is, moving below three micrometres). When used under these conditions, these columns have the potential to produce peaks with much lower volumes (on the order of 10 times or more) compared to those that were typical in the 400‑bar era. These lower volume peaks are, in turn, more susceptible to dispersion outside of the column to a degree that can seriously compromise the quality of the separation. As a result, there has been renewed interest in the topic of extracolumn dispersion (ECD) in the last 15 years, both from instrument manufacturers looking to improve the performance of their instruments along these lines, and from researchers looking to further our understanding of these issues so that we can leverage this knowledge in the development of better methods (2). So, in spite of the fact that ECD has been studied intensively since the very early days of high performance liquid chromatography (HPLC), a lot has changed recently. For this month’s instalment of “LC Troubleshooting”, I have asked Dr. Ken Broeckhoven (fellow LCGC Emerging Leader, and one of the world’s experts on ECD) to join me in writing a multi-part series on this topic where we aim to translate new findings described in the chromatographic literature into terms that can be applied in development and troubleshooting of modern HPLC methods. In this first instalment, we begin by reviewing terms and concepts that are central to the discussion, and quantify the effects of ECD on the performance of separations executed using columns of different dimensions and prepared with particles of different sizes. In subsequent parts of this series, we will go into more detail discussing how different parts of HPLC systems (for example, injectors, detectors, and connecting tubing) contribute to the overall dispersion that ultimately impacts the quality of a separation. We are hopeful that an improved understanding of these factors will help users identify situations where ECD may be unnecessarily compromising the quality of their separations, and identify a viable path to remedy this type of situation.
Dwight Stoll
Getting Acquainted with the Problem
Given that the pace of change in the HPLC column market has been rapid recently, and that the turnover of HPLC instruments in laboratories is relatively slow, it is commonplace for users to try out a new column technology using a relatively old instrument. Sometimes this works just fine, and sometimes it does not. We would really like to avoid situations where the apparent column performance does not measure up to expectations, not because the column doesn’t work properly, but because the influence of the instrument on the outcome obscures the actual column performance. Many column manufacturers have recognized the seriousness of this problem, and invested substantially in the development of educational material, tutorials, trainings, and software (such as method transfer calculators) to help users avoid bad experiences with new column technologies.
We recognize that many practicing chromatographers think in terms of chromatograms. To get acquainted with the problem we’re discussing here in a quantitative way, we have prepared the simulated chromatograms shown in Figure 1, which illustrate the impact of ECD typical of an older HPLC instrument on the quality of separations obtained with relatively older or newer column technologies. Panels a and b show simulated chromatograms for isocratic separations of a hypothetical five-component mixture of compounds with retention factors ranging from 0 to 8.5. Panel a shows the separation of the mixture using a 150 mm × 4.6 mm i.d. column packed with 5 µm particles, operated at a mobile phase flow rate of 1 mL/min, where we assume that there is absolutely no influence of dispersion outside of the column on the observed chromatogram (that is, ; this is completely hypothetical, but useful to support discussion). The separation is good with a minimum resolution of 1.5 for both compound pairs 1–2 and 3–4, and the analysis is complete in about 12 min. Now, for a separation on this time‑scale, one of the potential advantages of moving to a column with a smaller particle size is that the same resolution achieved with larger particles (panel a) can be achieved in a shorter time, provided that the pressure required to drive the separation using smaller particles can be generated by the pump. Panel b shows what such an improvement could look like. We see that moving to a shorter column packed with smaller particles yields the same resolution in a much shorter time provided that the flow rate is similar to what was used for the column with larger particles. Again, this assumes there is no impact of the dispersion outside of the column on resolution, and it is critically important to recognize here that this degree of improvement can only be realized if a much higher pressure is available.
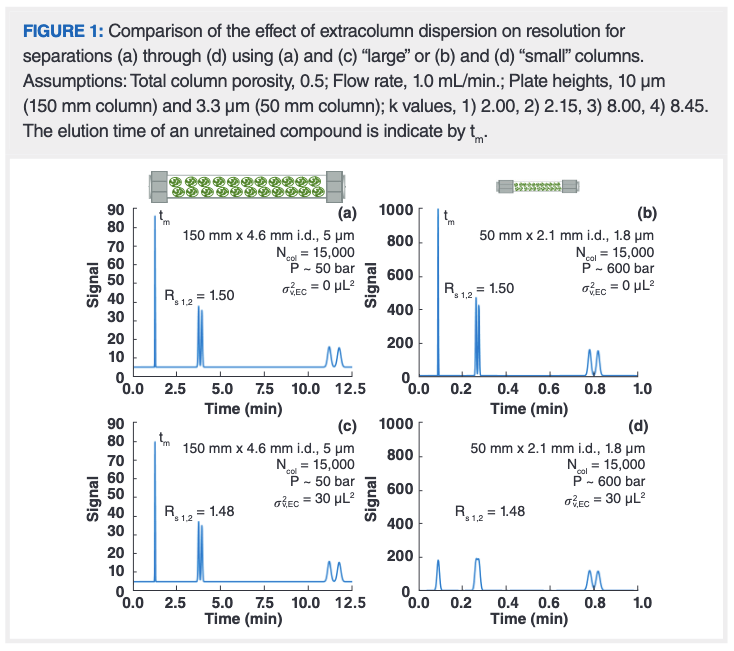
Things become more interesting when we consider cases where dispersion outside of the column does impact resolution. By comparing panels a and c, and b and d, we can see that the magnitude of the impact of ECD is strongly influenced by the column in use. In the case of the long column with large particles, the level of ECD chosen here (which reflects the characteristics of a “good” system from the end of the 400‑bar era; see more discussion below) does not affect the resolution of the 3–4 peak pair at all. There is a very small effect on the resolution of the 1–2 peak pair, but this level of change certainly would not be detectable by eye. In other words, separations involving long columns and large particles tend to be relatively unaffected by dispersion outside of the column. In panel d, however, we see a completely different outcome. If we take the shorter, narrower column packed with smaller particles and carry out the separation using the same instrument characterized by an extracolumn variance of 30 μL2 as in panel c, the system has a devastating negative impact on the quality of the separation. The resolution of the 3–4 peak pair decreases by 23%; the loss of resolution for the 1–2 peak pair is so bad that it is no longer even clear if there are actually two peaks present at that point in the chromatogram.
So, coming back to the title of this instalment, a perfectly good column can be robbed of its performance potential as a result of using it in an instrument that is not well suited to modern column technologies. In the remainder of this article, and in the other parts of this series, our aim is to provide an update on recent research results that inform our understanding of how different instrument parameters contribute to the level of ECD exhibited by different systems. We can then use this knowledge to troubleshoot problems originating from these effects, and build better methods from the start. Readers interested in learning much more about details related to this topic are referred to the recent review article by one of us (2), as well as contributions on the topic in LCGC Europe and LCGC North America (3–9).
Extracolumn Dispersion: Measuring It, and Adding It
One of the simplest definitions of column efficiency is that it is calculated as the square of the ratio of the retention time (or volume) to the peak width (in time or volume units to match the retention measurement). If the peak is symmetrical and has a Gaussian shape, then the simplest calculation of the efficiency relies on the standard deviation (σ) of the Gaussian, shown in Figure 2(a). It is common to measure the peak width at half of the peak height (w1/2). In the case of a Gaussian peak the relationship between w1/2 and σ is straightforward and thus σ can be calculated from w1/2. When peaks are perfectly symmetrical, determining σ by measuring the peak width at 50% of the height (w50) or 4.4% of the height (w4.4) will yield exactly the same σ number. However, as the peak becomes more asymmetric, the w50 value will underestimate the true peak variance, and thus using w4.4 provides a more conservative measure of the variance. More rigorous determination of the peak variance of asymmetric peaks requires the use of statistical moments, which comes with its own challenges. Readers interested in learning more about these details are referred to a recent review of many issues related to ECD (2).
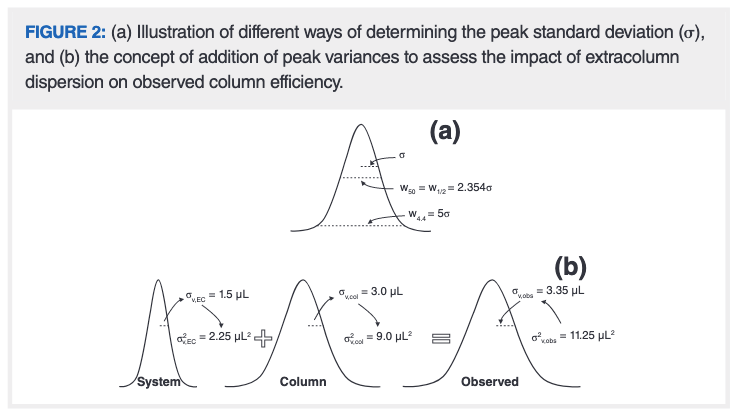
One of the simplest approaches to determining the level of total ECD involves replacing the column with a zero‑dead‑volume union and injecting a sample. The width of this “system peak” can then be determined using one of the methods discussed above. The most critical step in assessing the impact of the ECD on the observed column efficiency is recognizing that it is the variances (σ2) of system and column peaks that are additive, not the widths (that is, σ, determined by any of the methods above). The process of estimating the impact of the extracolumn variance on the observed column efficiency is shown graphically in Figure 2. The standard deviations of the system and column peaks are first measured or calculated, the variances for each component are calculated, and then they are added together. The resulting variance expected for the observed peak can then either be used as is, or converted back to a peak width.
Impact of Extracolumn Dispersion on Observed Column Efficiency over a Range of Conditions
In Figure 1, we illustrated the effect of one level of extracolumn variance on the resolution provided by two columns of very different dimensions. It is also instructive to examine the magnitude of this effect over ranges of retention factors, column dimensions and particle sizes, and extracolumn variance levels. The results of this kind of calculation provide a kind of map that one can use to estimate the seriousness of the effect of the extracolumn effect when approximate values of retention factor, extracolumn variance, and column dimensions are known. Whereas in Figure 1 we used the resolutions of specific peak pairs to quantify the loss of performance, in the following discussion we will use the loss of column efficiency as a metric, because it provides a more generalizable view of the problem.
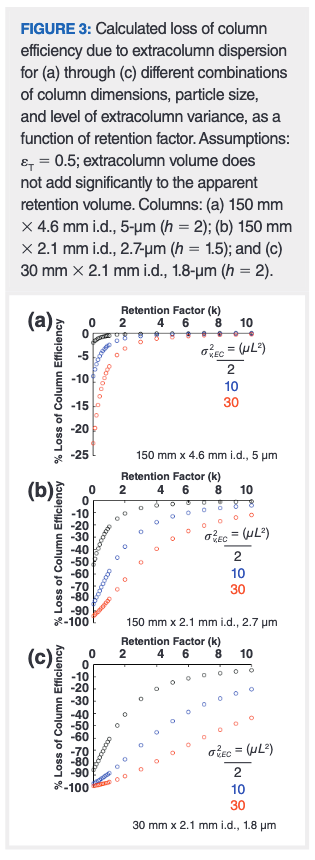
There are a number of ways one could approach these calculations that vary in the level of rigour and accuracy required, but we have taken the following approach to arrive at the numbers shown in Figure 3. We start by estimating the inherent efficiency of the column (Ncol) (that is, without extracolumn effects) from the column length (L), particle size (dp), and the reduced plate height (h). In our case here we have assumed that the reduced plate heights for fully porous particles (Figures 3[a] and 3[c]) are 2.0, and 1.5 for superficially porous particles (Figure 3[b]). A more rigorous approach would require an estimate of the flow rate (F), and the dependence of h on the F through something like a van Deemter curve. We also note here that the following calculations and discussion are only relevant to isocratic separations. In future instalments we will discuss how things change in the case of separations that use gradient elution.
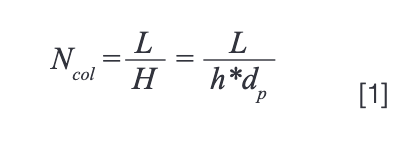
Once we have the column efficiency, we can calculate the standard deviation of a peak at any retention factor as long as we know the column dimensions and have an estimate of the total porosity of the column. A reasonable estimate for the total porosities (εT) of columns packed with fully and superficially porous particles is 0.5 (10). First, the column dead volume (Vm) is calculated from the physical dimensions of the cylinder and the porosity.

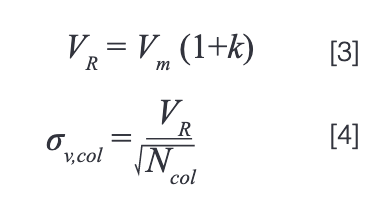
Then, the retention volume (VR) can be calculated for a compound with retention factor k, and finally the peak standard deviation from the retention volume and the column efficiency.
Now, with the expected peak standard deviation in hand, and an estimate of the extracolumn variance(σ2v,EC), we can calculate the standard deviation that will be observed at the detector (σv,obs), where this will be larger than σv,col due to additional dispersion outside of the column.

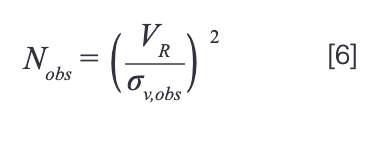
The apparent column efficiency (Nobs) is then calculated by rearrangement of equation 4. Note that here we assume that VR is unaffected by the system volume outside of the column. This most definitely is an approximation, and a more rigorous approach would not rely on this assumption, but this is a minor issue in the context of the parameters chosen here and the focus of this discussion.
Finally, the percent loss of column efficiency is calculated as:

A series of results from this type of calculation are shown in Figure 3 for three different columns and three levels of extracolumn variance, over a range of retention factors from 0 to 10. The three columns selected are very different, and represent: a) large columns (150 mm × 4.6 mm i.d.) packed with large particles (5 µm) that are still often used in legacy methods that were developed in the 400‑bar era; b) long (150 mm), narrow (2.1 mm i.d.) columns packed with superficially porous particles of intermediate size (2.7 µm) used for modern, high efficiency separation; and c) short (30 mm), narrow (2.1 mm i.d.) columns packed with sub-2-µm particles used for very fast one-dimensional (1D) separations, or as the second dimension column in two-dimensional (2D)-LC separations. The three levels of extracolumn variance selected represent the level of dispersion found in good instruments from the end of the 400‑bar era (30 µL2), “off‑the‑shelf” configurations of modern ultrahigh‑pressure liquid chromatography (UHPLC) instruments (10 µL2), and highly optimized configurations of UHPLC instruments aimed at minimizing extracolumn dispersion (2 µL2) (2).
There are many useful observations we can make in reviewing these results. First, as discussed above, the performance of large columns like that shown in panel a is relatively insensitive to reasonable levels of extracolumn variance. Even with the largest variance of σ2v,EC = 30 µL2, the maximum efficiency loss for any compound with k > 1 is only about 5%. Using this type of column in an instrument with lower extracolumn dispersion is not very helpful from the point of view of the observed efficiency (Nobs), unless one is dealing with very low retention compounds with k < 1 (which is important in size‑exclusion chromatography [SEC], for example).
Moving to the results shown in panel b for the 150 mm × 2.1 mm i.d. columns packed with 2.7 µm superficially porous particles, we see that using this type of column in an instrument from the 400‑bar era will result in efficiency losses of more than 30% for compounds with k < 5. This obviously would be a serious disappointment for someone trying a column like this for the first time. Moving to an off‑the‑shelf UHPLC instrument helps quite a bit, but even in this case the efficiency loss for compounds with k < 1 is more than 50%. Realizing the full potential of this column requires some optimization of the UHPLC instrument. Reducing the extracolumn dispersion to 2 µL2 enables realization of more than 90% of the actual column efficiency for compounds with k > 2.
Out of the scenarios considered here, the results in panel c show that using short, narrow columns packed with sub-2-µm particles in instruments without careful attention to the level of extracolumn dispersion will lead to disastrous results. Even with a highly optimized UHPLC system, 80% of the actual column efficiency is only reached for compounds with k > 4. With columns of these dimensions we must be very careful to manage our expectations for performance by taking into account the characteristics of the instrument surrounding the column.
Summary
In this instalment of “LC Troubleshooting”, we have reviewed some of the basic concepts relevant to the consideration of extracolumn dispersion (ECD) that occurs in HPLC systems, and the impact of this dispersion on the apparent performance of columns of different dimensions and efficiencies. As columns become smaller, and as they are packed with smaller particles, attention to the minimization of ECD associated with the instrument becomes more important. Not considering this can result in very poor apparent column performance that has nothing to do with the actual column performance, and everything to do with robbing the column of its inherent efficiency by dispersion of the analyte zone that occurs outside of the column.
Here, we have talked about ECD from the point of view of an entire instrument. In upcoming instalments we will dig into the details of dispersion that occurs in different elements of these systems, including injectors, detectors, connecting tubing, and when post‑column flow splitting is used, as well as differences in the treatment of ECD when gradient elution is used.
References
- J. Sternberg, Advances in Chromatography (Marcel Dekker, New York, New York, USA, 1966), pp. 205–270.
- G. Desmet and K. Broeckhoven, TrAC Trends Anal. Chem. 119, 115619 (2019).
- F. Gritti, LCGC Europe. 33(s5) 7–16 (2020).
- R.E. Majors, LCGC North Am. 33(11), 818–840 (2015).
- J. Dolan, LCGC Europe 25(3), 140–146 (2012).
- J. Dolan, LCGC North Am. 23(2), 130–135 (2005).
- J. Dolan, LCGC North Am. 23(8), 738–743 (2005).
- J. Dolan, LCGC North Am. 21(11) 1050–1054 (2003).
- K. Broeckhoven, J. De Vos, and G. Desmet, LCGC Europe 30(11), 618–625 (2017).
- K. Broeckhoven, D. Cabooter, and G. Desmet, J. Pharm. Anal. 3, 313–323 (2013).
ABOUT THE AUTHOR
Ken Broeckhoven received his Ph.D. in 2010 from the Vrije Universiteit Brussel (VUB), in Brussels, Belgium. Following post-doctoral research at VUB and work as a visiting researcher in the separation processes laboratory at ETH Zurich, in Switzerland, he became a research professor at VUB in 2012. He was subsequently promoted to Assistant Professor and then to his current position as an Associate Professor in 2017.
ABOUT THE COLUMN EDITOR
Dwight R. Stoll is the editor of “LC Troubleshooting”. Stoll is a professor and the co-chair of chemistry at Gustavus Adolphus College in St. Peter, Minnesota, USA. His primary research focus is on the development of 2D-LC for both targeted and untargeted analyses. He has authored or coauthored more than 70 peer‑reviewed publications and four book chapters in separation science. He is also a member of LCGC’s editorial advisory board.
Direct correspondence to: amatheson@mjhlifesciences.com

New Method Explored for the Detection of CECs in Crops Irrigated with Contaminated Water
April 30th 2025This new study presents a validated QuEChERS–LC-MS/MS method for detecting eight persistent, mobile, and toxic substances in escarole, tomatoes, and tomato leaves irrigated with contaminated water.
University of Tasmania Researchers Explore Haloacetic Acid Determiniation in Water with capLC–MS
April 29th 2025Haloacetic acid detection has become important when analyzing drinking and swimming pool water. University of Tasmania researchers have begun applying capillary liquid chromatography as a means of detecting these substances.
Prioritizing Non-Target Screening in LC–HRMS Environmental Sample Analysis
April 28th 2025When analyzing samples using liquid chromatography–high-resolution mass spectrometry, there are various ways the processes can be improved. Researchers created new methods for prioritizing these strategies.

.png&w=3840&q=75)

.png&w=3840&q=75)


.png&w=3840&q=75)


.png&w=3840&q=75)


