A Generic Method for Target (Group) Analysis in Edible Oils and Fats: Combined Normal-Phase Liquid Chromatography and Capillary Gas Chromatography
Special Issues
Edible oils and fats are complex mixtures of compounds. To understand the properties of an oil or fat, information on groups of molecules, as well as individual molecules, is needed.
Edible oils and fats are complex mixtures of compounds. To understand the properties of an oil or fat, information on groups of molecules, as well as individual molecules, is needed. This article describes the role of normal-phase liquid chromatography (LC) as a generic sample pretreatment tool prior to detailed analysis by gas chromatography (GC). Moving from one group to another can be performed by simply adjusting the elution conditions and collection windows. Different applications of the new unified method will be discussed, including detailed analysis of partial acylglycerides, steradienes, and glycidylesters, as well as the use of the novel method for total-polarity mapping.
Edible oils and fats are an important part of the human diet. From an analytical perspective, these food ingredients, are extremely complex mixtures, irrespective of whether they originate from animals or vegetables. Analytical measurements are therefore challenging. A wide range of analytical methods are available that allow a detailed mapping of the overall bulk composition, as well as an analysis of specific trace compounds. In all of these methods sample preparation is a crucial step. Historically, little standardization of the sample preparation and analysis methods was performed. As a result, edible oil and fat laboratories are now confronted with a huge diversity of almost identical, yet slightly different, methods. More generic approaches could help to contribute to the efficiency of these laboratories.
As in all analytical measurements, the key aspects in method development for edible oil and fat analysis are selectivity and sensitivity. The compounds of interest should be measured at the desired levels without interferences from other species. Sensitivity is a crucial factor in trace analysis, for example, in contaminant or vitamin analysis. Selectivity, that is, the ability to distinguish the compounds of interest from those that are not relevant, is a second important factor in trace analysis, but it is equally relevant in the assessment of the main compound classes in the oil. Selectivity in oil and fat analysis is basically related to isolating the compound or compound group of interest from the total sample by exploiting differences in the physico-chemical properties (reactivity, size, or polarity) between the compounds of interest and the rest. Isolation is very often performed in the sample pretreatment step. Saponification followed by extraction is an important sample preparation step for removal of the bulk triacylglycerides (TAG) and isolation of the (non-hydrolysable) non-polar species. Saponification will not be considered here because it is not a universal approach. All compounds that can be hydrolyzed are lost in the procedure. This article will focus on methods for target-group isolation that isolate the molecules in their native, intact form. After the initial isolation of the compounds of interest, chromatographic techniques can be used to introduce additional selectivity and quantify the groups or individual compounds for which information is needed.
In the past a wide variety of methods have been developed for the pre-isolation of the target analytes from an oil or fat sample. Liquid–liquid partitioning, solid-phase extraction (SPE), thin-layer chromatography (TLC), size-exclusion chromatography (SEC), and complexation are the most common tools.
After the initial isolation both gas chromatography (GC) and liquid chromatography (LC), either in combination with or without mass spectrometry (MS), can be used for separation and quantification. It is clear that all the sample preparation methods, with the exception of SEC, exploit solubility and interactions as the mechanisms for separating the target compounds from the remaining sample material. It was from this that the idea to replace the wide variety of isolation methods by a single analytical isolation tool, normal-phase LC, arose. Much of the early work to replace complex sample work-up methods for oil and fat analysis by LC isolation of the fraction of interest was performed by Grob and coworkers (1). Normal-phase LC isolation of the compounds of interest provided an excellent selectivity. The drawback of LC isolation (the dilution of the fraction) was elegantly resolved by applying large volume sample transfer to the second dimension GC or LC method.
This article will describe previous work in the development of a single, unified analytical protocol that can replace most of the sample preparation procedures applied in the various edible oil analysis methods. Building on the pioneering work done by Grob, the use of combined normal-phase LC–GC for the analysis of compounds and compound classes that have been of interest for decades will be demonstrated. In addition, its use for the analysis of species that have only received interest recently will be illustrated. The latter group includes sterols, steroloxides, and glycidylesters.
Instrumentation
The proposed novel methods rely on the use of tunable normal-phase LC as a unified route for target compound and target group isolation in edible oils. If one of the main compound groups, for example the TAG or diacylglycerides (DAG), is of interest, the oil sample is injected into the normal-phase LC system without any further sample pretreatment. For the analysis of trace-level compounds, such as in the analysis of glycidyl esters, it is generally worthwhile removing the bulk of the fatty matrix in a quick liquid extraction step prior to the normal-phase LC fractionation.
Sample Preparation
To remove the TAG, 100 mg of the oil sample was dispersed in 4 mL of acetonitrile. The oil sample at the bottom of the tube was gently warmed to obtain a homogeneous clear liquid oil phase. Vigorous mixing (vortex) for about 20 s was applied to disperse the oil into the organic phase. After centrifugation for 5 min at 3500 g, the acetonitrile was transferred into a clean test tube and the solvent was evaporated under a gentle stream of nitrogen (35 ± 5 °C). Immediately after drying, the walls of the test tube were rinsed with approximately 1 mL of chloroform. The solvent was again removed under nitrogen and finally the residue was redissolved in 1 mL of hexane/2-propanol (85/15 v/v).
Normal-phase LC Separation
The normal-phase LC separations were performed on a modular, binary gradient system, consisting of two solvent delivery pumps (type Gilson 305 + 306), a manometric module (Gilson 805s), and a dynamic mixer (Gilson 811b), and equipped with a UV detector (UV-2000, Thermo Separation Products), operated at 205 or 210 nm. The normal-phase LC separations were performed on either one or two (serially connected) 250 × 4.6 mm, Lichrosorb 5 Diol columns (Agilent Technologies) thermostatically controlled at 40 °C by the column oven of a Marathon-xt autosampler (Separations). The fraction of interest was collected by an Advantec SF-2120 fraction collector (Separations). Different normal-phase LC gradients were used matching the polarity of the analyte group(s) of interest. An overview of the gradients used for specific applications is presented in Table I.
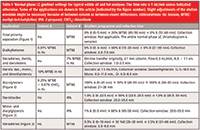
Table I: Normal-phase LC gradient settings for typical edible oil and fat analyses. The flow rate is 1 mL/min unless indicated otherwise. Some of the applications are shown in this article (indicated by the figure number). Slight adjustments of the elution windows might be necessary because of between-column or between-eluent differences. Abbreviations: Hx: hexane, MTBE: methyl-tert-butylether, IPA: 2-propanol, CHCl3: chloroform
Since many of the target compounds showed no or very limited UV absorbance, collection windows were typically determined through the analysis of the pure model compounds. Fractions at 0.5 min intervals were then collected around the expected normal-phase LC retention time. These fractions were then analyzed by GC. In this way the approximate elution position could be determined. The exact elution window could then be established using either a series of standard compounds covering the whole chain-length range, or a real sample. Depending on the identity of the target analytes, whether derivatization prior to GC is needed, and the desired detection limits, the sample can be injected as such, or after removal of the solvent. This can be done under a stream of nitrogen at room temperature or slightly above. To avoid the loss of volatile sample constituents, a so-called keeper, for example, isooctane, can be added. The typical volume used was 200 µL. Derivatization was typically performed by adding 200 µL of a 25% BSTFA (bis-trimethylsilyl-trifluoroacetamide) solution in pyridine followed by heating at 70 °C for 30 min.
GC Separation
Separation of the compounds within a fraction was performed by capillary GC, either with flame ionization detection (FID) or MS detection. Different GC columns, injection methods, and injection volumes were applied depending on the desired chromatographic selectivity, the physico-chemical properties of the compounds of interest, and the desired detection limits. An overview of the settings used is given in Table II.
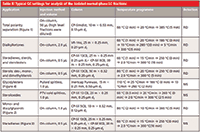
Table II: Typical GC settings for analysis of the isolated normal-phase LC fractions
GC–FID experiments were performed on a Trace GC2000 (Interscience) equipped with an AS2000 autosampler, a cold on-column injector and an early solvent vapor exit. All GC–MS experiments were performed on an Agilent 7890A GC coupled to a 5975C inert XL mass selective detector (Agilent Technologies) and controlled by Chemstation software version E.02.00 (Agilent). The GC–MS system was equipped with two injectors: a split/splitless and a PTV injector (OPTIC3, ATAS GL). Several analytical columns were employed.
Results and Discussion
Total Polarity Separations
As outlined earlier, the main aim of the current work was the development of a tunable-selectivity method that could provide a generic approach for the analysis of specific groups of compounds in edible oils or fats. Within this strategy normal-phase LC is used to isolate the compound group of interest on the basis of its polarity. The idea for this strategy was derived from a series of early experiments performed using a novel technique called comprehensive LC×GC (2). In comprehensive LC×GC subsequent fractions from an LC separation are taken for detailed analysis by GC. This method was initially developed for detailed separation of triacylglycerides and later applied to whole oils as well (3). Figure 1 shows one of the early comprehensive two-dimensional normal-phase LC×GC chromatograms obtained. In this dot-plot figure the normal phase LC separation is plotted in the x-direction and GC chromatograms recorded for every normal-phase LC fraction are plotted in the y-direction. The size of a dot represents the peak area at a certain GC retention time. In the separation plane a large number of compound groups can be seen. Based on their relative polarity (normal-phase LC retention time) and size (GC retention) they could be identified tentatively. From Figure 1 it is clear that one single normal-phase LC gradient allows the separation of a number of important compound classes, which means that a generic method for tunable target analysis is feasible. It is important to emphasize that it is not the aim of the current study to obtain information on all compound classes in a single comprehensive LC×GC run. Information on all compound classes would only be required for very advanced applications such as authenticity research or patent infringement investigations, in most other cases only one compound group is of interest. For the latter purpose heart-cut LC–GC suffices.
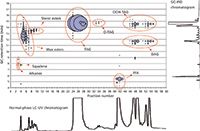
Figure 1: Comprehensive normal-phase LCÃGC separation of an edible oil sample. All identifications of compound classes are tentative.
Chromatograms such as those shown in Figure 1 can be recorded in a fully automated manner as we have shown previously (4). Automated on-line heart-cut LC–GC using on-column or loop-type large volume injection was demonstrated by Grob and Frohlich in 1992 (5). We applied large volume injection using a programmed temperature injector (PTV) for solvent elimination between the LC and GC–MS. Full automation is evidently necessary for comprehensive LC×GC, but if just one or a few fractions of the LC separation are of interest, (automated) fraction collection with manual transfer to the GC for further analysis is generally easier.
Partial Acylglycerides
The main compounds present in edible oils are the TAG, tri-esters of fatty acids and glycerol. In addition to the TAG, low levels of the so-called partial acyl glycerides can also be present. These compounds consist of glycerol with two fatty acid chains (di-acylglycerides or DAG) or one fatty acid (mono-acylglycerides or MAG). Partial glycerides can result from incomplete acylation in the biosynthesis of the oil or from oil processing. Their analysis is important because even very low levels of these partial glycerides can strongly affect product stability of margarines and dressing products. For a full understanding of the influence of DAG and MAG on product stability, information on the chain length distribution within the DAG and MAG group is relevant. Obtaining this information begins with isolating the DAG and MAG fractions from the oil with subsequent analysis of the total chain lengths using GC after BSTFA silylation. Normal-phase LC isolation of MAG and DAG from each other and from TAG is relatively straight forward because of the large polarity difference between these three compound groups: Normal-phase LC retention is very different for molecules with none versus one or two free hydroxyl groups (DAG and MAG, respectively). During analysis MAG and DAG are collected in one combined fraction because separation is possible based on the retention times in GC. For most oils and fats, except those with a very broad fatty acid chain length distribution, the last eluting MAG elutes well before the first eluting DAG in GC. Figure 2 shows the GC–FID analysis of a combined MAG/DAG fraction from a palm oil sample. In the GC chromatogram two clear regions can be seen. The MAG elute between 12 min and 14 min (see expanded view), while the heavier DAG elute between 18.0 min and 23 min. Quantification was performed against cholesterol as the internal standard, which was added to the oil sample prior to the normal-phase LC isolation.

Figure 2: GCâFID analysis of the combined MAG/DAG fraction isolated from a palm oil sample using normal-phase LC.
Steradienes in Olive Oils
Olive oil is an important ingredient in Mediterranean cuisine. Different qualities of olive oils are available, depending on the origin and processing of the oil. The highest quality oils are the virgin or cold-pressed oils. The only processing steps allowed in the preparation of virgin oils are physical techniques such as pressing, filtration, decantation, and centrifugation (6). Because of its high price, virgin olive oil is susceptible to fraud and adulteration. There are various analytical methods to differentiate virgin from refined or thermally treated olive oils. An important indicator is the level of 3,5-stigmastadiene, a dehydration product of sterols formed upon thermal treatment of the olives. Virgin olive oils, obtained by cold pressing, do not contain measurable amounts of 3,5-stigmastadiene (less than 0.01 mg/kg [7]) while the level of 3,5-stigmastadiene in refined olive oils ranges between 0.3 mg/kg and 0.9 mg/kg (8). Reliable analysis of steradienes is therefore very relevant. Steradienes are four-ring compounds consisting only of carbon and hydrogen atoms. In terms of polarity, steradienes are less polar than the bulk of the oil, the TAG. In normal-phase LC isolation this means the steradienes elute almost unretained, together with other non-polar species such as alkanes and squalene. Since the latter compound is present at a much higher level than the steradienes in many oil samples an efficient separation and selective detection is needed. GC–MS is clearly the technique of choice. Figure 3 shows the GC–MS chromatogram of the isolated steradienes fraction of an olive oil. Full scan GC–MS is sufficiently sensitive while simultaneously the extracted ion chromatograms offer the required selectivity.
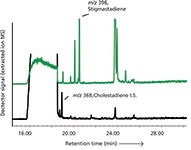
Figure 3: GCâMS analysis of steradienes as markers for edible oil fraud and adulteration.
Glycidylester Analysis
Glycidylesters (GE), fatty acid esters of glycidol, are process contaminants formed during the deodorization step of vegetable oil refining (9). They present a safety hazard as a result of the toxic effects of glycidol, which can be released upon digestion. Accurate measurement of GE is required for performing the risk assessment and for evaluating the effectiveness of various mitigation technologies. A suite of methods for GE analysis has recently been developed (9). These methods can be classified into indirect methods that measure glycidol after conversion of all glycidylesters into a single halogenated derivative, and direct methods that measure the levels of individual intact GE. A drawback of the indirect methods is that information on the fatty acid chain esterified to the glycidol backbone is lost as all esters are converted into a single analyte during sample preparation. We have recently developed a method based on off-line LC–GC for the analysis of intact GE (10). Figure 4 shows the normal-phase LC isolation of intact GE esters from a spiked palm oil sample. The GE elute well before the residual TAG, DAG, and MAG. Because the GE are present at extremely low levels, a liquid–liquid partitioning step using heptane–acetonitrile was performed prior to injection into the normal-phase LC system. In this partitioning step the TAG preferentially distribute into the heptane phase, while the GE are enriched into the acetonitrile phase. To enable a full separation of the non-polar GE from the only slightly more polar residual TAG, the normal-phase LC eluent needs to be strictly non-polar and free of even the slightest traces of water or other polar species. Under these conditions the double bonds in the molecules start to strongly influence retention. In Figure 4 this becomes apparent from the rather large resolution between the glycidylesters with a saturated chain versus those containing one, two, or three double bonds. As a result of this rather strong separation, the fraction that has to be collected is wider than usual, necessitating an evaporative preconcentration prior to injection in GC–MS. Since the compounds have a low volatility, this preconcentration is straight forward and, if performed under nitrogen at a moderate temperature, holds little risk of losing analytes. The quantification limits of the novel method are better than 0.05 mg/kg for individual glycidylesters. In practical operation the method is very stable: Hundreds of samples could be analyzed without problems or excessive maintenance. The GC–MS performance was remarkably stable. This is a positive consequence of the efficient clean-up that is obtained in our generic normal-phase LC isolation strategy.

Figure 4: Normal-phase LC isolation of intact glycidylesters (GE) from spiked palm oil. The vertical lines indicate the collection window for the GE.Adapted and reprinted from Journal of Chromatography A 1313, H. Steenbergen, K. HrnÄiÅÃk A. Ermacora, S. de Koning, and H.-G. Janssen, Direct analysis of intact glycidyl fatty acid esters in edible oils using gas chromatographyâmass spectrometry, 202â211 (2013) with permission from Elsevier (10).
Conclusions
The combination of normal-phase LC as a selective method for the isolation of specific compound classes from edible oil samples for further detailed analysis of individual homologues by GC has been demonstrated. This combination offers a generic method with a selectivity that can be tuned from the keyboard. Fully automated off-line operation is easy to perform, and on-line coupling even allows unattended and therefore fast, cheap, and reliable operation. In addition to being highly selective, normal-phase LC pre-isolation combined with GC(–MS) quantification also provides good sensitivity. By using an intermediate evaporation step between the normal-phase LC isolation and the GC analysis, or by implementing a large volume injection step, detection limits in the ppb range are achievable. Future improvements could be achieved by combining the universal isolation method with more advanced analysis tools such as GC–MS–MS, comprehensive GC×GC(–MS), or ultrahigh-pressure LC (UHPLC)–MS.
Herrald Steenbergen is a research scientist in the analytical chemistry department of Unilever Research Vlaardingen, the Netherlands. He specializes in liquid chromatography and gas chromatography of food samples, with an emphasis on edible oil and fat analysis. He develops and uses hyphenated and comprehensive systems, often including mass spectrometric detection.
Hans-Gerd Janssen is the science leader of chromatography and mass spectrometry at Unilever Research Vlaardingen. He also is a part-time professor in biomacromolecular analysis at the University of Amsterdam. Professor Janssen's research interests include the development of multidimensional separation systems for food, biomedical, and environmental analysis. Direct correspondence to: Hans-Gerd.Janssen@unilever.com
References
(1) K. Grob, M. Lanfranchi, and C. Mariani, J. Chromatogr. 471, 397–405 (1989).
(2) H.-G. Janssen, W. Boers, H. Steenbergen, R. Horsten, and E. Floter, J. Chromatogr. A 1000, 385–400 (2003).
(3) A.J.H. Louter, H.-G. Janssen, H. Steenbergen, and E. Floter, Lipid Technology 15, 64–67 (2003).
(4) S. de Koning, H.-G. Janssen, M.M. van Deursen, and U.A. Brinkman, J. Sep. Science 27, 397–409 (2004).
(5) K. Grob and D. Frohlich, J. High Res. Chromatogr. 15, 812–814 (1992).
(6) EC Regulation Nr. 1234/2007, Appendix XVI, Descriptions and definitions of olive oil and olive pomage.
(7) M.C. Dobarganes, A. Cert, and A. Dieffenbacher, Pure & Appl. Chem. 71, 349–359 (1999).
(8) L Brühl and H.-J. Fiebig, Fat. Sci. Technol. 97, 203–208 (1995).
(9) C. Crews, A. Chiodini, M. Granvogl, C. Hamlet, K. Hrnčiřík, J. Kuhlmann, A. Lampen, G. Scholz, R. Weisshaar, T. Wenzl, P.R. Jasti, and W. Seefelder, Food Addit. Contam. Part A 30, 11–45 (2013).
(10) H. Steenbergen, K. Hrnčiřík, A. Ermacora, S. de Koning, and H.-G. Janssen, J. Chromatogr. A 1313, 202–211 (2013).

Analytical Challenges in Measuring Migration from Food Contact Materials
November 2nd 2015Food contact materials contain low molecular weight additives and processing aids which can migrate into foods leading to trace levels of contamination. Food safety is ensured through regulations, comprising compositional controls and migration limits, which present a significant analytical challenge to the food industry to ensure compliance and demonstrate due diligence. Of the various analytical approaches, LC-MS/MS has proved to be an essential tool in monitoring migration of target compounds into foods, and more sophisticated approaches such as LC-high resolution MS (Orbitrap) are being increasingly used for untargeted analysis to monitor non-intentionally added substances. This podcast will provide an overview to this area, illustrated with various applications showing current approaches being employed.


