A Generic Headspace GC Method for Residual Solvents in Pharmaceutical: Benefits, Rationale, and Adaptations for New Chemical Entities
LCGC North America
A generic static headspace gas chromatographic (HSGC) method for determining common residual solvents in pharmaceuticals is described.
Residual solvents in pharmaceuticals are organic volatile impurities left over from the synthesis of active pharmaceutical ingredients (APIs) or from the manufacturing processing of pharmaceutical products. Their levels are monitored and controlled for safety reasons (1–4) and for their potential impacts on the crystalline form, possibly affecting solubility, stability, and bioavailability (5). Analytical techniques were recently reviewed (6,7). Testing methodologies can be nonspecific, such as loss on drying (LOD, USP <731>) or thermogravimetric, and specific techniques based upon spectroscopy (for example, nuclear magnetic resonance and IR spectroscopy) and chromatography (gas chromatography [GC], high performance liquid chromatography [HPLC], ion chromatography). Headspace GC (HSGC) is ideally suited because of its ability to quantify individual solvents. Headspace sampling is significantly more robust than direct liquid injections of the API solutions (6–8). The "static solution approach" is preferred over the dynamic or "purge-and-trap" approach due to more-reliable instrumentation (8,9). Fundamental concepts of static HSGC are well understood and documented (6–10). The static approach is referenced in the USP compendial method (3) and European pharmacopeia (4), and is used widely in the quality control of commercial pharmaceuticals or generic products.
Nevertheless, the USP method is somewhat difficult to follow with several different procedures and might not be directly applicable in new drug development for several reasons: It is a limit test for Class 1 and Class 2 solvents. LOD is recommended for Class 3 solvents and quantitation is only required if levels exceed ICH limits. It uses ~250–500 mg of sample per test, which is not feasible for most new chemical entities (NCEs). Water or water–dimethyl formamide is used as a diluent and poses potential solubility or stability issues for many drugs. In addition, the method is time-consuming (45–60 min for sample equilibration and >60 min for GC analysis).
The alternative, to develop and validate specific methods for each NCE, is inefficient and time consuming. Consequently, many laboratories have developed their own versions of "generic methods" (10–22). A brief survey indicated that these methods share similar GC conditions, but have disparate headspace parameters used with little justification (for example, equilibration temperature from 60 °C to 140 °C, equilibration time of 5–60 min, and diluent volumes of 0.1–5.0 mL and different diluents). Though some discussions on these headspace parameters can be found (7,10,14–16), we were unable to locate sufficient data to understand the rationale behind selection of these parameters.
This article provides details of a "generic" HSGC method for 28 common solvents supported with a comprehensive set of relevant attributes and method performance data for all analytes. It discusses the rationale for the selection of key parameters and delineates method issues for problematic samples or analytes. Method adaptations to lower sample amounts (<10 mg) are illustrated with case studies.
Experimental
Chemicals and reagents: Residual solvents reference standards were of GC-, HPLC-, or ACS-grade from VWR (West Chester, Pennsylvania), Fisher Scientific (Pittsburgh, Pennsylvania), Polysciences (Warrington, Pennsylvania), and Sigma-Aldrich (St. Louis, Missouri). Diluents used included N,N-dimethylacetamide (DMA), N,N-dimethylsulfoxide (DMSO), 1,3-dimethyl-2-imidazolidinone (DMI), N,N-dimethylformamide (DMF) and were of the highest purity grade available from EMD (Gibbstown, New Jersey, spectrophotometry-grade), Fluka (Steinheim, Germany, HSGC-grade), Alfa Aesar (Ward Hill, Massachusetts), and Sigma-Aldrich.
Chromatographic system and operating conditions: The HSGC system used was a model 7890 or 6890 gas chromatograph equipped with a flame ionization detection (FID) system and a G1888 autosampler controlled by ChemStation software (All from Agilent Technologies, Santa Clara, California). 10-mL headspace vials and aluminum crimp caps with PTFE-lined septa were used. GC and headspace conditions for the standard generic method are shown in Table I. Rationale for selecting these parameters is found in the discussion section.
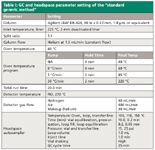
Table I: GC and headspace parameter setting of the "standard generic method"
Preparation of standard and sample solutions: Table II summarizes the target concentrations of all solvent standards in various calibration solutions together with their ICH limits and other attributes. The stock standard solution was prepared by pipetting (Class A glass pipette) appropriate volumes of each solvent into a 250-mL volumetric flask containing approximately 100 mL of DMA. The flask was then brought up to volume with DMA and mixed well. The working standard solution was prepared by diluting a 5-mL aliquot of the stock standard into a 200-mL volumetric flask. Two system suitability sensitivity check solutions were prepared similarly by further dilution of the working standard solution (by 10- or 50-fold) to ensure that limits of quantitation (LOQs) of ~100 ppm (or mg/g) could be attained (except for propylene glycol methyl ether [PGME], tetramethyl urea, and N-methylpyrrolidone [NMP]).
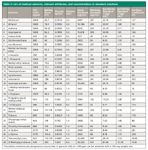
Table II: List of residual solvents, relevant attributes, and concentrations in standard solutions
API samples were prepared by accurately weighing a ~100-mg portion into a headspace vial. A 1-mL aliquot of DMA was then pipetted into the vial and sealed immediately using a crimp cap followed by swirling or vortexing to ensure total dissolution. Sonication is not recommended because it promotes degradation of the diluent or the sample (15). Lower sample amounts of 10–50 mg were used for NCEs of limited availability. Drug product samples were prepared by crushing the tablets wrapped in weighing paper to a fine powder. An appropriate portion of the powder was then weighed and transferred into a headspace vial. Capsule samples were prepared similarly by opening the capsules and weighing an appropriate portion of the contents. Details of standard solution preparation and "stability" data are presented in a later section.
Injection sequence, system suitability and quantitation: The suggested sequence of injections for regulated analysis is as follows: Blank, sensitivity solutions, working standards (six injections for system suitability), blank, samples (one vial injection per preparation). For system suitability: First, evaluate the blank chromatogram for the presence of interfering peaks. Second, the resolution (Rs) between methyl ethyl ketone–ethyl acetate and isopropyl acetate–2-methyl tetrahydrofuran must be ≥ 0.9. Third, the relative standard deviation (RSD) for six injections of the working standard must be ≤ 15.0%. Fourth, the signal-to-noise ratio (S/N) of each peak in one of the sensitivity solutions is ≥ 10 (See Table II). Quantitation is based upon external standardization for each residual solvent detected in the sample corrected by sample weight versus the corresponding peak area from an equal volume of the working standard.
Results and Discussion
In this section, we describe the performance data and rationale for parameters selection followed by method adaptations to lower the sample amounts. Then we present case studies and discuss potential issues of HSGC and possible adaptations for difficult samples. Area response data of eight selected solvents of diversified properties are graphed in order to illustrate the effects of key HSGC parameters.
Fundamental concepts. Theory of static HSGC as derived by Kolb (8) is shown in equation 1.

a = Proportionality constant
CG = Concentration of solvent in the gas phase
C0 = Original concentration of solvent in the sample solution
K = Partition coefficient constant = CS/CG
CS = Concentration of solvent in the sample or liquid phase
β = Phase ratio = VG /VS
VG = Volume of the gas phase = VV – VS
VS = Volume of the sample or liquid phase
Vv = Volume of headspace vial = VG + VS
The partition coefficient K depends upon solubility of the analyte in the diluent and the equilibration temperature (T) while phase ratio β depends upon vial size and diluent volume. Because area response is inversely proportional to (K + β), which should be similar if not identical for standards and samples, C0 can be calculated from comparing their respective peak areas. Key assumptions that should be met for accurate determination are the complete extraction of solvents from the sample matrices and full equilibration before injection. While dissolution of the sample by the diluent would be ideal, it is not an absolute requirement. Many insoluble drugs can be analyzed as a suspension in the diluent as long as residual solvents are extracted quantitatively from the sample matrices. Method accuracy validation using spiked standards to evaluate matrix effect should be performed. Having a finely powdered sample with longer equilibration time with high shaking should expedite more complete equilibration.
GC operating conditions: Table I shows our "standard" instrumental operating conditions of the method. While our studies were limited to instruments from a single manufacturer, surveys indicated that excellent performance data were achievable with most instruments (8–21). The GC column used was a, 30 m X 0.32 mm, 1.8-µm df Agilent J&W DB-624 column. This is a popular residual solvent column and has a bonded phase of 6% cyanopropylphenyl–94% dimethylpolysiloxane (USP phase G43 equivalent) (3). The column was operated at an optimum linear velocity of 30 cm/s at a flow rate of 1.5 mL/min. The temperature program was optimized to yield resolution of all 28 solvents in the working standard as shown in Figure 1. Total cycle time was 25 min.
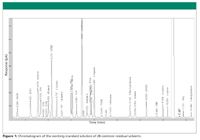
Figure 1
Solvent set selection and standard sample preparation procedure: Table II lists solvent standards, relevant attributes, and concentrations in various standard solutions. The selection of the solvent set was an exercise of common sense and practicality. Ideally, all commonly used solvents in process chemistry should be included. Because Class 1 solvents are to be avoided in pharmaceutical applications (1–4), they are excluded from the list. Selection was based upon consultations with the in-house process chemistry group and limited to those separated by the "standard" column. Two common coupling reagents (diisopropyl ethyl amine and tetramethyl urea) are potential impurities that can be assayed by this method.
Our analyte list in Table II contains solvents with diversified boiling points, ranging from dichloromethane at 40 °C to NMP at 202 °C. Note that the number of milliliters of reference solvents pipetted to make the stock solution generally reflects their respective ICH limits. Density values were used to calculate their corresponding concentrations. Additional comments on the standard preparation procedure are included here due to the many potential procedural pitfalls that can impact method accuracy. We used Class A pipettes to aliquot relatively large volumes (0.5–6 mL) of the neat solvent standards into ~100 mL of DMA in a 250-mL volumetric flask. Pipetting volatile solvents into a "dry" flask or dispensing it against the flask wall can result in substantial loss through evaporation, particularly serious for volatile solvents such as dichloromethane (methylene chloride). Each addition was followed by immediate mixing in order to solubilize the new solvent into the nonvolatile diluent. More volatile components were added last to minimum evaporative loss. The stock solution then was diluted further to yield the working standard and the two sensitivity check solutions. Alternative to glass pipettes are positive displacement pipettes using tips with inner pistons. Note that air displacement digital pipettes with disposable plastic tips are designed for aqueous solvents and might not be accurate with organic solvents. Standard solutions also can be prepared gravimetrically, though it is more time consuming.
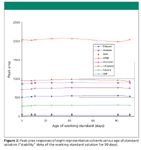
Figure 2
The standard solutions were stored at room temperatures in tightly stoppered flasks or vials with crimped septumed caps. The stock and working standard solutions were found to be "stable" for at least three months as shown in Figure 2, which tracks the area responses by HSGC of eight representative analytes in a working standard solution. All 28 analytes were found to be "stable" for at least 90 days as indicated by the data. This long-term "stability" of the calibration solution is significant to avoid daily or weekly preparation of the standard solutions, which is laborious. Because solvents are inert compounds, acceptable "standard solution stability" really means having good evaporative control. Refrigerated storage is not necessary and can be problematic as the cold solution can pick up contaminants from the atmosphere if the container is opened too soon before equilibration to room temperatures. DMSO solutions (mp = 18 °C) will freeze and break the container under refrigeration.
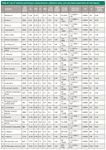
Table III: List of method performance characteristics, validation data, and calculated parameters (K and slopes)
General method performance and validation data: Table III summarizes general method performance characteristics of this method including typical retention time (tR), relative retention time (RRT), resolution (Rs), precision (%RSD), sensitivity (limit of quantitation or LOQ in parts per million for a 100-mg sample), USP tailing factor (Tf), range, response equation, correlation coefficient (R2 ), partition coefficients (K, calculated), and response slopes (a/(K + β), calculated). Note that resolution of all analyte peaks were found to be > 1.5 with the exception of methyl ethyl ketone–ethyl acetate and isopropyl acetate–2-methyl tetrahydrofuran. Both critical pairs were adequately separated for quantitation. A minimum resolution of 0.9 for these two pairs was used as system suitability criterion. Because only volatiles are injected in headspace analysis, the resolution performance appeared to be highly reproducible over an extended time period and when using similar instruments from different laboratories. Precision of peak areas from sampling six different vials of the same working standard was typically <5.0% RSD, consistently better than the system suitability criterion or the USP guideline of <15.0% RSD. LOQs of <100 ppm (based upon 100 mg of sample) were easily obtained with most solvents. These data indicated that adequate method sensitivity to meet ICH limits can be attained with 10 mg of sample except for NMP (LOQ = 870 ppm). Peak tailing (Tf) were found to range from 0.95 to 1.20, except for PGME at 1.30 and DMF at 1.58. Excellent linearity (R2 > 0.999) was demonstrated over a typical range of ~100 ppm to about two times the ICH limit. The response of each peak (slope of the response equation) is also listed. The response slope is a "sensitivity factor" dependent upon K and FID response of the molecule. K for each solvent under method conditions (100 °C with DMA) was calculated using the phase ratio variation method (8). K values were found to vary between 16 for hexane (a low boiling nonpolar solvent not miscible with DMA) to over 1000 for high-boiling solvents such as DMF, tetramethyl urea, and NMP. These high values signify that these solvent analytes are highly soluble in DMA and preferential partition in the liquid phase. As a crosscheck on the validity of the calculated K values, the response slopes were also calculated (slope = a/(K + β) and appear to agree well with those derived from actual linearity data.
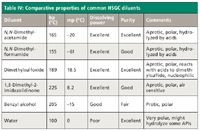
Table IV: Comparative properties of common HSGC diluents
Rationale for diluent selection: Table IV summarizes important properties and potential issues of common HSGC diluents. Required properties include the following: Fairly high boiling points (not interfering with volatile analytes); good solubilizing power for most drugs including salts; high purity; and thermal stability and inertness. Literature searches indicated DMA, DMF, DMSO, and DMI to be the most commonly used diluents. All four diluents are high-boiling, polar aprotic solvents with strong dissolving power and are miscible with water. Uragami and colleagues (15) studied matrix media for HSGC and found degradation of these diluents above 120 °C and under ultrasonication. However, no specific recommendation for the best diluent for HSGC was made in the reference.
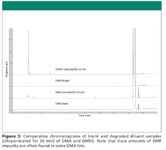
Figure 3
In our study, we screened the first five diluents in Table IV for impurity peaks in blank samples. Our results show DMA and DMSO yielding the cleanest blanks (Figure 3). We did observe volatile degradants for DMA and DMSO after prolonged heating at 120 °C or sonication. Area responses of the 28 analytes using these two diluents were found to be similar, varying within a factor of 2. Though DMSO has less toxicity, we prefer DMA for two reasons: DMSO degrades easily when used with chloride salt samples to form dimethylsulfide, which elutes closely to acetone, and DMSO is nucleophilic and might react with some NCEs. For example, the formation of isopropyl amine and acetone was observed when DMSO was used as a diluent for an NCE with an isopropylamine group. Both were analytical procedural artifacts (degradants) stemming from reaction of the sample with the diluent.
DMI was reported to be air-sensitive and requires nitrogen-blanketing of opened bottles. A preservative such as butylated hydroxyanisole (BHA) often is used with DMI to reduce degradation. We did not select DMF because it is a commonly used process solvent. We were unable to find benzyl alcohol of adequate purity to yield acceptable blanks.
Water is an unusual diluent. It is low-boiling but is "transparent" to FID. Its use is recommended in the USP for water-soluble drugs and as a DMF–water mixture (1:5) for water-insoluble drugs. Water has favorable K values for many hydrophobic solvents but has poor solubility for many NCEs and can cause hydrolytic degradation for others. Water can be considered for water-soluble drugs or salts and can be mixed with organic solvents or other additives (salts, buffer or detergent) (3,19). Another major concern for water-based diluents is the "stability" of standard solutions because most hydrophobic analytes are much less soluble (lower K values) in water-based diluents.
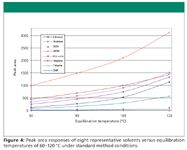
Figure 4
From these findings and observations, we concluded that DMA should be the first diluent choice and DMSO a close second.
Equilibration temperature and time: Figure 4 plots the area responses of eight representative analytes vs. equilibration temperatures of 60–120 °C. Because log K is inversely proportion to T (in absolute temperatures) (8), raising T should increase sensitivity with potential degradation of the diluent or the sample. Because very high analytical sensitivity of <100 ppm is attained routinely under the standard conditions, there is little incentive to equilibrate samples at higher temperatures except to increase sensitivity for high-boiling analytes such as DMF, where an increase to 120 °C can enhance sensitivity by twofold.
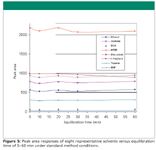
Figure 5
Figure 5 plots area response versus equilibration time under our standard method conditions, indicating that 10 min appears to be sufficient to reach equilibrium. Note that longer equilibration times are needed for larger diluent volumes or suspension samples (for example, 45–60 min for the USP method at 80 °C and 6 mL of diluent).
Diluent volume and adaptations to smaller sample amounts: Sample availability for NCEs typically is limited during early development. Total amounts of <100 mg allotted for the entire early analytical development effort is not atypical. Availability is even more limited for isotopically labeled API or impurity reference standards. While this method uses 10–100 mg of sample in 1 mL of diluent, several literature references (7,14,18) indicated further reduction is possible by reducing the vial size and diluent volume.
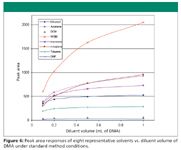
Figure 6
In this method, we reduced β by a factor of two by selecting a smaller 10-mL vial versus the more popular 20-mL vial size. Further reduction to a 3.3-mL vial size (18) is possible with some customization but this vial size might not be universally compatible with all HSGC autosamplers. Figure 6 shows the effect of diluent volume on peak response or sensitivity. Note that while analyte amount is lowered by 10-fold through reducing diluent volume from 1 mL to 0.1 mL (increasing β from 9 to ~100), area response only decreases by a factor of 2–3 for most solvents. β has little effect for nonvolatile solvents such as DMF (22). This is because K is ~1000 for DMF, which dominates the proportionality constant (K + β) in equation 1. Therefore, by lowering the diluent volume to 0.1 mL of diluent, sample amounts can be reduced further to 2–10 mg and still have sufficient sensitivity for screening purposes. The validity of this approach was verified in case study 2. Along the same lines, further reduction of sample amounts to 0.5–1 mg is possible for rough estimation of residual solvent levels. Note that the use of a microbalance is preferred for weighing samples <10 mg.
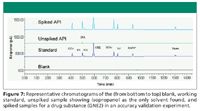
Figure 7
Case study 1: Accuracy validation for drug substance (GNE1): Use of validated methods is mandatory for regulated testing (23). Because method-performance characteristics such as specificity, precision, linearity, range, and sensitivity can be assessed once for the generic method in the laboratory, these validation parameters do not have to be reevaluated for each API. Only a partial validation (that is, accuracy) is needed to complete method validation for specific APIs or drug products to demonstrate that there is no matrix interference. In this case study, an accuracy validation was performed for a drug substance (GNE1, a hemi-fumarate salt) which used up to eight solvents (ethanol, isopropanol, acetonitrile, methyl tert-butyl ether (MTBE), ethyl acetate, tetrahydrofuran, 2-methyl tetrahydrofuran, and toluene) in its synthetic process. We prepared a working standard solution containing these eight solvents and evaluated recovery of these analytes (spiked at ~1X ICH limits), from six spiked samples of ~100 mg each. Figure 7 shows representative chromatograms of the blank, unspiked and spiked samples. Note that isopropanol, the solvent used in the final synthetic step, was the only analyte found in the unspiked API. Accuracy validation of all eight potential analytes was successful as shown in Table V with average recovery of 99–107% and RSDs of 2–4%.

Table V: Case study 1 - Accuracy validation of an NCE fumarate salt; recovery data at 100-mg sample size
Case study 2 on use of lower diluent volumes for smaller sample amounts (GNE2): In this case study for an NCE sample (GNE2, a crystalline free base) containing three potential residual solvents (MTBE, 2-methyl-tetrahydrofuran, and 1,4-dioxane), duplicate assays with progressively smaller sample sizes of 100, 50, 20, 10, 5, and 2 mg were performed. We conducted two sets of experiments. First we kept the diluent volume at 1 mL for sample sizes of 100, 50, 20, and 10 mg, and diluent volume at 0.1 mL for sample size of 5 and 2 mg. Second, we kept the sample concentration constant at 100 mg/mL with respective diluent volumes of 1.0, 0.5, 0.2, 0.1, 0.05, and 0.02 mL. Note that for quantitative analysis, the solution volumes of both sample and calibration standard must be identical. Table VI summarizes assay data showing consistent assay values irrespective of sample amounts using both approaches (for example <2% RSD for 2-methyl tetrahydrofuran). Both approaches yielded similar results (<10% difference of the mean) for all three analytes.
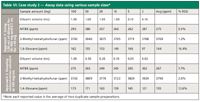
Table VI: Case study 2 - Assay data using various sample sizes*
We believe the first approach to be more straightforward for a generic method, though the second approach should yield higher sensitivity for high-boiling solvents. Obviously, larger sample amounts, if available, are still preferred and would result in fewer problems stemming from bulk sample inhomogeneity or weighing errors.
We also performed method accuracy validation (recovery of spiked analytes at ~1X ICH limits) for all 28 solvents from this sample with sample amounts of 2–100 mg. Excellent recovery results ranging from 80% to 110% were obtained for all analytes (data not shown).
Method issues, performance enhancements and possible adaptations: Table VII summarizes method issues, potential performance enhancements, and possible adaptations for problematic samples. Method issues are categorized by the most important fundamental factors (K, β, diluent, sample–standard) or instrumental factors (GC, headspace, detector) as denoted by check marks in the table. Some suggested adaptations might not be practical or have other negative impacts.

Table VII: Summary of method issues, performance enhancements, and potential adaptations
Blank: Problems with blank peaks and interferences likely are caused by diluent purity or system contaminations. Remedies are to change diluents to high-purity grades (spectrophotometric or GC-grade), or to reduce system contaminants (carryover) by "baking out" the transfer line, injection valve, and column while maintaining some carrier flow. In troubleshooting, It often is useful to inject "air blank" (empty vials without diluent) to ascertain whether blank peaks are derived from the diluent. Because the sample valve can be a common contamination site, autosamplers using balanced-pressure injection (without a sampling valve) can have less carryover problems. Instrumental types and benefits are discussed elsewhere (8,9).
Detection of solvent peaks not in the working standard solution: The number of solvent peaks resolved in the standard solution is limited by the separation power of the 30-m DB-624 column. If solvents not included in the regular working standard are used in the synthetic process, new standard mixtures must be substituted for calibration and validation. Having many solvents in the standard solution allows the "catching" of unexpected unknowns in the sample without the needs for further investigation. Unexpected unknown peaks can be attributed to side products, or contamination in the process, or analytical artifacts. For instance, dimethylsulfide, a degradant of DMSO, often can be mistaken for acetone due to very close retention times. GC–mass spectrometry (MS) is invaluable for identification of unknowns. Degradation artifacts can be reduced by changing the diluent or reducing equilibration temperatures. Note that hexanes and heptanes are isomeric mixtures and can pose problems in quantitation or interference with other analytes in the standard mixture.
Problematic analytes: Acidic or basic solvents (for example, formic acids or amines) might not chromatograph well (broad peaks or low responses) and can interact with the sample or diluent. Remedies can involve changing the GC column, diluent type, or using diluent additives. Note that trifluoroacetic acid does not gas chromatograph well (because it is a strong acid), but it can be determined via ion chromatography.
Problematic samples or sample solubility issues: Note that DMA and DMSO can be degraded by acids or acid salts. Sample dissolution can be expedited by increasing diluent volume, vortexing or changing the diluent (8). Water can be a viable diluent for some drugs (particularly salts) and can be used with additives (buffers, detergents, suspending agents, or organic solvents). Some complex formulations (for example, transdermal patches) or medical devices (for example, stents) can require the use of standard addition, or multiple headspace extraction (MHE) for accurate quantitation (8,24).
Peak coelution or poor peak shapes: Peak coelution can be mitigated by revising the temperature program or by changing the column. For instance, we resolved ethanol from isopropyl amine (a sample artifact from a drug substance sample with an isopropyl amine group) by lowering the starting oven temperature to 32 °C. An orthogonal column (for example, DB-wax, USP phase G16 equivalent) is most likely to resolve peaks that are coeluted on the "standard" G43 column. Other innovative but more radical solutions include dual-column simultaneous analysis (25), 2-D GC (21), and the use of MS detection (6,17,19).
Sensitivity enhancements and reducing sample amounts: This method uses 10–100 mg of sample in 1 mL of DMA for "standard" analysis and <10 mg sample in 0.1 mL for sample screening. Other easy alternatives include increasing equilibration temperature (to 120 °C), and reducing the split ratio at the GC inlet. Note that a peak height enhancement of ~50% was found in our system by changing the split ratio from 10:1 to 2:1. Changing detection to electron capture detection (ECD) for chlorinated analytes or MS in the single-ion monitoring mode can also significantly increase sensitivity to parts-per-billion levels (19). Another possibility to enhance sensitivity is to substitute the standard 1-mL sample loop with a larger 3-mL loop and using cryofocusing to maintain peak resolution.
Method accuracy: Method accuracy issues often are related to standard preparation or sample integrity or inhomogeneity. One potential error source is the water content in samples such as hydrate salts that may influence K leading to aberrant recovery data. The use of lower sample amounts, standard addition, or internal standard calibration may offer better quantitation (8,24).
Reducing analysis time: GC analysis time can be lowered by using a faster temperature program, increasing carrier gas flow, switching to hydrogen carrier gas, or using a shorter or a smaller internal diameter column (8,9,13,19). For FID detection, good resolution of all analytes is required for method accuracy. The combined use of optimized GC conditions with MS detection may reduce GC analysis time to ~7 min without sacrificing data quality (19).
Conclusions
Residual solvent analysis by static headspace GC is a mature technique routinely used for pharmaceutical quality control and research. Surprisingly, there appears to be little consensus on key method parameters or diluent type. The difficulties lie in the diversity of sample types, analyte attributes, diluent properties, and the myriad interdependent method parameters. In this article, we provide a detailed method prescription for a straightforward generic method for 28 common solvents as well as a comprehensive set of performance and validation data. We demonstrated its applicability to sample sizes of <10 mg by decreasing the diluent volume to 0.1 mL. We discussed the rationale for selecting the solvent set, diluent type, vial size, diluent volume, and other key HSGC method parameters in relation to K and β. Finally, we review potential issues and explore adaptations to problematic samples. This generic method should be applicable to many drug substances (both water-soluble and water-insoluble APIs), excipients, polymers, and drug products. The benefits are a single, easy-to-follow quantitative procedure for diversified samples, quick method validation and adaptability to small sample amounts of <10 mg.
Acknowledgments
The authors would like to thank the following scientists and colleagues for previewing this manuscript and giving helpful suggestions: Bruno Kolb (retired, PerkinElmer, Shelton, Connecticut), Nicholas Snow (Seton Hall University, South Orange, New Jersey), John Hinshaw (Severon, Eugene, Oregon), Oscar Liu (Schering), Henrik Rasmussen (Johnson & Johnson), Roger Firor (Agilent Technologies, Santa Clara, California), Katherine K. Stenerson (Supelco, Bellefonte, Pennsylvania), Padmaja Prabhu (PerkinElmer India), and David Stirling, Dimitre Stoianov, and Cadapakam (CJ) Venkatramani (Genentech USA, San Francisco, California).
Lulu Dai, Amanda C. Quiroga, Ke Zhang, Heather B. Runes, Derrick T. Yazzie, Kavita Mistry, Nik P. Chetwyn, and Michael W. Dong
Genentech USA, San Francisco, California
Please direct correspondence to: dong.michael_w@gene.com
References
(1) International Conference on Harmonization (ICH) of Technical Requirements for the Registration of Pharmaceuticals for Human Use, Q3C (R4): Impurities: guideline for residual solvents, Step 4, July 1997.
(2) International Conference on Harmonization, Guidance on impurities: residual solvents. Fed. Regist. 62: 67377-88, 1997.
(3) USP <467>, General Chapter on Organic volatile impurities, United States Pharmacopeia, (USP 32-NF 27). Pharmacopoeia Convention Inc., Rockville, Maryland, August 2009.
(4) Residual Solvents (5.4), European Pharmacopoeia, Supplement 4.6, Directorate for the Quality of Medicines of the Council of Europe, Strasbourg, fourth edition, 2004, p. 3911.
(5) C. Witschi and E. Doelker, Eur. J. Pharm. Biopharm. 43, 215–42 (1997).
(6) C. B'Hymer, Pharm. Res. 20(3), 337–344 (2003).
(7) C. Camarasu, C. Madche, and R. Williams, Trends Anal. Chem. 25, 768–777, (2006).
(8) B. Kolb and L.S. Ettre, Static Headspace-Gas Chromatography Theory and Practice, 2nd Ed. (John Wiley & Sons, Hoboken, New Jersey, 2006).
(9) "A Technical Guide for Static Headspace Analysis using GC," Restek (2000).
(10) S. Klick and S. Skold, J. Pharm. Biomed. Anal. 36, 401–409 (2004).
(11) C.C. Camarasu, Chromatographia Supplement 56, S-137–143 (2002).
(12) R. Otero, G. Carrera, J.R. Dulsat, J.L. Fabregas, and J. Claramunt, J. Chromatogr., A 1057, 193–201 (2004).
(13) T.K. Chen, J.G. Phillips, and W. Durr, J. Chromatogr., A 811, 145–150 (1998).
(14) L. Hong and H. Altorfer, Chromatographia 53, 76–90 (2002).
(15) K. Urakam, A. Higashi, K. Umemoto, and M. Godo, J. Chromatogr., A 1057, 203–210 (2004).
(16) K. J. Mulligan and H. McCauley, J. Chromatogr. Sci 33, 49–54 (1995).
(17) K. Jacq, F. David, and P. Sandra, "A generic method for the analysis of residual solvents in pharmaceuticals using static headspace-GC-FID/MS," Agilent Technologies Applications Notes, 5989-9726EN (2008).
(18) R. George and P.D. Wright, Anal. Chem. 69, 2221–2223 (1997).
(19) J.L. Perez Pavon, M.D.N. Sanchez, C.G. Pinto, M.E.F. Laespada, and B.M. Cordero, Anal. Chem. 78, 4901–4908 (2008).
(20) C.M. Crimi and N. Snow, LCGC 26(1), 62–70 (2008).
(21) N.H. Snow, and G.C. Slack, Trends Anal. Chem. 21(9/10), 608–617 (2002).
(22) L.S. Ettre and B. Kolb, Chromatographia 32(1/2), 5–12 (1991).
(23) International Conference on Harmonization (ICH), Q2B, Validation of analytical procedures: methodologies, Step 4, November (1995).
(24) A. Naffaf and J. Balla, Chromatographia Supplement 51, S241–248 (2000).
(25) J.M. Levy and M. Kraft, "Simultaneous dual capillary column HSGC FID confirmation and quantitation using USP <467>," Application Note 5989-8085EN, Agilent Technologies, 2008.
New Study Reviews Chromatography Methods for Flavonoid Analysis
April 21st 2025Flavonoids are widely used metabolites that carry out various functions in different industries, such as food and cosmetics. Detecting, separating, and quantifying them in fruit species can be a complicated process.
University of Rouen-Normandy Scientists Explore Eco-Friendly Sampling Approach for GC-HRMS
April 17th 2025Root exudates—substances secreted by living plant roots—are challenging to sample, as they are typically extracted using artificial devices and can vary widely in both quantity and composition across plant species.
Sorbonne Researchers Develop Miniaturized GC Detector for VOC Analysis
April 16th 2025A team of scientists from the Paris university developed and optimized MAVERIC, a miniaturized and autonomous gas chromatography (GC) system coupled to a nano-gravimetric detector (NGD) based on a NEMS (nano-electromechanical-system) resonator.

.png&w=3840&q=75)

.png&w=3840&q=75)


.png&w=3840&q=75)


.png&w=3840&q=75)


