GC–TOF-MS and DART–TOF-MS: Challenges in the Analysis of soft drinks
LCGC Europe
The potential of the time-of-flight mass spectrometry (TOF-MS) to innovate the analysis of soft drinks is described using gas chromatography (GC) hyphenated to TOF-MS and a new type of ion source, direct analysis in real time (DART), coupled to high-resolution TOF-MS. Head-space solid-phase microextraction (SPME) was used to isolate/extract volatile compounds followed by GC–TOF-MS to identify tainted compound in contaminated soft drinks. Direct analysis in real time–time-of-flight mass spectrometry (DART–TOF-MS) was also used to obtain negative and positive ion profiles of different soft drinks to determine the presence of various compounds, including antimicrobial preservatives, artificial sweeteners, acidulants and saccharides, without any sample preparation and chromatographic separation.
Tomas Cajka, Lukas Vaclavik, Katerina Riddellova and Jana Hajslova,
Institute of Chemical Technology, Faculty of Food and Biochemical Technology,
Department of Food Chemistry and Analysis, Prague, Czech Republic.
Techniques involving mass spectrometry (MS) as a detection tool in food analysis have evolved substantially. Gas chromatography–mass spectrometry (GC–MS) and liquid chromatography–mass spectrometry (LC–MS) are commonly used to detect, identify, quantify and confirm both natural and xenobiotic substances in the food production chain. One of the most distinctive trends in MS-based analysis is the use of time-of-flight mass spectrometry (TOF-MS) for both target and non-target analysis of a wide range of organic compounds that occur in biotic matrices.
High-speed unit resolution TOF-MS instruments can be combined with a fast one-dimensional GC and/or comprehensive two-dimensional GC (GC×GC) set-up with "flash" separation in the second dimension to identify and quantify a wide range of compounds present in complex food matrices.1 Whereas, the high-resolution TOF-MS instruments allow accurate mass measurement to calculate analyte elemental composition for the identification of "unknown" compounds and/or confirm the target analyte identity.
If chromatographic separation of sample components is used prior to MS detection, less spectral interferences caused by matrix components are observed compared with direct measurement. However, the labour-intensity of sample preparation (which typically involves extraction, preconcentration and/or clean-up steps) and the time required for the chromatographic run itself can become a bottleneck in laboratory throughput. However, regardless of whether GC or LC is employed, the optimization of the separation process for multiple analytes with different physicochemical properties is very challenging. The possibility of overcoming these difficulties has emerged with the introduction of three new ionization techniques: direct analysis in real time (DART), desorption electrospray ionization (DESI) and atmospheric pressure solids analysis probe (ASAP).2–5 These techniques allow a rapid, non-contact MS analysis of materials at ambient pressure and ground potential. Compared with GC–MS and LC–MS, ambient MS requires essentially no separation of sample components employing chromatographic techniques. Additionally, these techniques allow direct access to the sample while mass spectra are being recorded.
Keynotes
There are very few published papers that present these new ionization techniques as a tool for qualitative and/or semi-quantitative analysis.2–4,6–17 No comprehensive study to investigate the potential of these techniques as a characterization tool, their performance in terms of sensitivity or linear dynamic range, or how they compare with GC–MS and LC–MS methods, has been conducted. But there is a great potential for DART and related ionization techniques to be used to rapidly screen target compounds and to obtain characteristic sample profiles in real-time.
In this paper, the use of GC–TOF-MS to identify the source of taint in one of the batches of a new type of soft drink is described. We also demonstrate the application of DART–TOF-MS for the fast analysis of various soft drinks to obtain qualitative profiles of the examined samples.
The potential of SPME–GC–TOF-MS and DART–TOF-MS techniques to provide effective solutions for these tasks are described in the two case studies that follow.
Identification of Soft Drink Taint by SPME–GC×GC–TOF-MS
Off-flavours and taints are defined as unpleasant odours or tastes. The former results from the natural deterioration of food and the latter from contamination by some other chemical or microorganisms. Both represent serious problems for the food industry.18 The identification of substance(s) responsible for unpleasant sensory properties represents a somewhat demanding task because a wide range of volatile compounds is released from food. They are either of natural origin or added intentionally to improve or modify the characteristics of the food.
It should be noted that odour thresholds of some undesirable sensorically active compounds, such as chlorinated phenols and anisoles, can be very low and may exhibit adverse effects even at trace levels.19 Under these circumstances, only an analytical method capable of distinguishing minor (or even trace) amounts of volatile components in the presence of abundant, non-target, sensorically indifferent matrix components will be useful.
Experimental
For SPME–GC×GC–TOF-MS analyses, a Pegasus 4D (Leco, St Joseph, Missouri, USA) system consisting of an Agilent 6890N gas chromatograph equipped with split/splitless injector (Agilent Technologies, Palo Alto, California, USA), an MPS2 autosampler (Gerstel, MFClheim an der Ruhr, Germany), and a Pegasus III high-speed TOF mass spectrometer (Leco) was used.
The experimental conditions were as follows:
- Sample preparation: 3 mL of sample placed in a 10 mL SPME vial
- SPME extraction: DVB/CAR/PDMS (50/30 μm) fibre (Supelco, Bellefonte, Pennsylvania, USA); incubation and extraction temperature: 60 °C; incubation time: 5 min; extraction time: 10 min; agitator speed: 500 rpm; desorption time: 1 min (splitless); desorption temperature: 250 °C
- GC separation: DB-5ms column 30 m × 0.25 mm, 0.25 μm (J&W Scientific, Folsom, California, USA); oven temperature programme: 45 °C (1 min), 10 °C min–1 to 200 °C, 30 °C min–1 to 280 °C (0.80 min); helium column flow: 1 mL min–1 .
- TOF-MS detection: EI mode (70 eV); ion source temperature: 220 °C; mass range: m/z 30–500; detector voltage: –1600 V; acquisition rate: 10 spectra s–1.
Solid-phase microextraction (SPME), an inexpensive, solvent-free sampling technique, was chosen for the extraction of volatiles from soft drink headspace (HS) and their preconcentration into the fibre coating. The SPME fibre coated with 50/30 μm divinylbenzene/carboxen/polydimethylsiloxane (DVB/CAR/PDMS) was selected after preliminary experiments.
In the next step, the contaminated and reference soft drink samples were examined by GC–TOF-MS to compare the profiles of volatile compounds. However, as shown in Figure 1, no difference was found, the total ion current (TIC) chromatograms were identical.
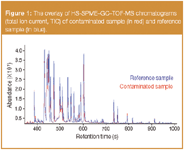
Figure 1
This led us to the assumption that the taint compound might be present in the chromatogram of contaminated sample as a minor peak probably overlapped by some abundant volatile compound. At this point, when the chromatographic resolution is not sufficient, the spectral (analytical) resolution can significantly help in the investigation. In this particular instance, the application of TOF-MS was seen as a challenging option mainly because of:
(i) availability of full spectral information even at (ultra-)trace levels,
(ii) availability of fast acquisition speed,
(iii) absence of spectral skew.1,20
The latter feature predetermines the use of automated spectral deconvolution of partially overlapped peaks on the basis of increasing/decreasing ion intensities in acquired spectra and background subtraction, followed by identification using the MS library search. Although the deconvolution function is currently also available for scanning instruments (e.g., AMDIS software — Automated Mass Spectral Deconvolution and Identification System — provided by the NIST free of charge),21 the relatively low signal intensity during full spectra acquisition together with relatively low acquisition rate of common scanning instruments can be a drawback that limits potential of this function when coupled to fast GC separations.
TOF-MS is the only option that allows the detection of very narrow chromatographic peaks generated under these conditions with high acquisition rates as well as high sensitivity during the full mass spectra collection. The example of this function for a tainted sample is shown in Figure 2. A careful examination of the contaminated sample chromatogram showed a small, narrow peak (2.8 s at the baseline) at a retention time of 492 s, completely overlapped by a broad, fronting peak (470–520 s) of sorbic acid. The MS library search identified it as 2-chloro-5-methyl-phenol (MW = 142.6). Nevertheless, other isomers are also conceivable. Chlorinated (methyl-)phenols are known to have very low odour threshold, typically in a concentration range of sub-ng L–1 to μg L–1 when occurring in aqueous solutions,19 thus, even their traces can cause a detectable taint.
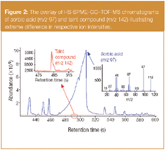
Figure 2
Figure 3 shows the measured and library mass spectrum of this taint compound. Although the deconvoluted mass spectrum also contained some ions originating from (extremely abundant) sorbic acid (m/z 67, 97 and 112), which slightly influenced its purity (a spectral match of 581/1000), the presence of chlorine isotopic pattern in the molecular ion can be used to confirm identity because the typical volatile aroma components contain only elements (carbon, hydrogen, oxygen and nitrogen) that do not offer characteristic ion patterns. We should note that the intensity of the mass of sorbic acid ion (m/z = 97) was approximately 55-fold higher compared with the taint compound (m/z 142) during its elution. This means that under the conditions of "manual" examination of recorded data this compound was "invisible".
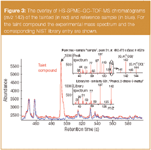
Figure 3
Profiling of Soft Drink Components by DART–TOF-MS
The rapid examination of product composition to check authenticity or to determine if the sample specifications meet particular quality control and regulatory requirements is regularly required in the food and beverage sector. For soft drinks, LC analysis is often used following pre-concentration and/or sample dilution. Analysis of soft drinks is not straightforward in a single chromatographic run because of the variety of polarities and ionic forms of components present. In contrast to any of these approaches, the use of ambient MS allows the examination of the sample profile without the processing previously required (i.e., no extraction and/or chromatographic preseparation is needed). In our study, we employed a recently introduced DART ion source enabling direct MS.2
In principle, DART is a dry source based on the atmospheric pressure interactions of long-lived electronic excited-state atoms or vibronic excited-state molecules with the sample and components of the atmosphere (H2O, O2). The gas (helium in this particular instance) flows through a chamber where an electrical discharge produces ions, electrons and excited-state (metastable) atoms and molecules. Most of the charged particles are removed as the gas passes through perforated lenses or grids and only the neutral gas molecules (including metastable species) remain. A perforated lens or grid at the exit of DART acts as an electrode to promote ion drift toward the orifice of the atmospheric pressure interface of the mass spectrometer. DART produces relatively simple mass spectra characterized by [M]+ or [M+H]+ in positive-ion mode, and [M]– or [M–H]– in negative-ion mode.2
In specific cases, the ionization process can be effectively enhanced by the presence of traces of dopant, such as ammonium (from ammonium hydroxide headspace vapour) or chloride (from methylene chloride vapour) resulting in mass spectra characterized by [M+NH4]+ or [M+Cl]– ions, respectively, depending on the polarity used for their acquisition.22 In addition, coupling the DART ion source with a high-resolution TOF mass spectrometer [a mass resolving power of 6000 full width at half maximum (fwhm)] with a capability of accurate mass measurements allows confirmation of the target analyte identity and the calculation of elemental composition of "unknowns".
In the following example, coupling of DART–TOF-MS for characterization of soft drink samples is described, demonstrating the application potential of this novel technique in food analysis.
Experimental
For DART–TOF-MS analyses, the system consisting of a DART ion source (IonSense, Danvers, Massachusetts, USA), a JEOL AccuTOF LP high-resolution TOF mass spectrometer [JEOL (Europe) SAS, Croissy sur Seine, France], and an AutoDART HTC PAL autosampler (Leap Technologies, Carrboro, North Carolina, USA) was used.
The experimental conditions were as follows:
- DART positive ion mode: helium flow-rate: 2.7 L min–1; needle voltage: 3000 V; discharge electrode: 150 V; grid electrode: 250 V; beam temperature: 300 °C
- DART negative-ion mode: helium flow rate: 2.7 L min–1; needle voltage: 3000 V; discharge electrode: –150 V; grid electrode: –350 V; beam temperature: 300 °C.
- TOF-MS detection: mass range: m/z 50–500; detector voltage: –2600 V (positive ion mode) or +2600 V (negative ion mode); acquisition rate: 5 spectra s–1.
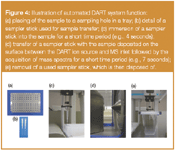
Figure 4
In Figure 4, the performance of the particular steps involved in an automated DART system is shown. Briefly, a sampler stick is immersed into the sample and then transferred between the DART ion source and MS inlet followed by the acquisition of mass spectra for a short time period (few seconds). Under these conditions, the total run (including all automated steps) <1 min is possible, which is significantly less than for any hyphenated GC- or LC-system.
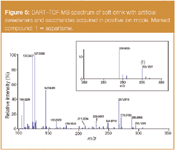
Figure 5
As mentioned earlier, the DART ion source can be operated in either positive or negative ion mode, each possessing different information from mass spectra. Figures 5 and 6 show both types of spectra obtained during the examination of a "light" soft drink containing artificial sweeteners and only a low amount of saccharides. While in positive ion mode only aspartame, E951 (artificial sweetener) was identified based on the accurate mass measurement, the number of identified compounds increased in negative ion mode: acesulphame K, E950 (artificial sweetener), citric acid, E330 (acidulant), benzoate, E211 and sorbic acid, E200 (both preservation agents), and also saccharides (hexose, disaccharide). The use of the dopants mentioned previously did not increase the number of detected ions.
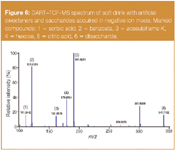
Figure 6
The profile of the second soft drink is shown in Figure 7. No artificial sweeteners were present; the only additives identified were citric acid, E330 (acidulant) and ascorbic acid, E300 (vitamin). The data obtained in this experiment are summarized in Table 1. As shown here, a good agreement between theoretical and experimental masses was obtained with mass errors ranging between –3.6 and +5.6 ppm. As well as the possibility of confirming the target analyte identity through the accurate mass measurement and calculation of elemental composition, the estimation of "unknown" compounds can also be performed.
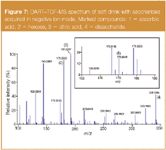
Figure 7
However, it has to be emphasized that the selection of the appropriate number of various elements potentially present in the ion of a particular compound together with the estimation of the maximum/minimum number of each of these elements, as well as choosing an acceptable mass tolerance (the maximum difference between measured and theoretical masses), are the factors that predetermine the success of a search assisted by the software.
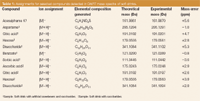
Table 1: Assignments for selected compounds detected in DART mass spectra of soft drinks.
It is worth noticing that proposing the elemental composition for "unknowns" is a complicated task, which requires at least some knowledge on the conceivable composition of the examined matrix to discriminate compounds suggested by the software for a particular mass. The fact that with increasing m/z value more alternative formulae are possible — hence only low error measurement is acceptable to correctly identify a unique elemental composition — also has to be taken into account.23
Conclusions
The first case study involving the application of the head-space SPME–GC–TOF-MS combined with advanced data processing is a powerful tool to detect, identify, and automate the reporting trace peak of sensorically active taint compound present in soft drinks that would be "invisible" under the conditions commonly used, such as using GC coupled to conventional quadrupole or ion trap mass analysers. The second case study demonstrated the unique potential of a new ion source: direct analysis in real time (DART) coupled to a high-resolution time-of-flight-mass spectrometer (TOF-MS). The presence of a whole array of drink components could be detected and identified within a couple of seconds without any sample preparation. The distinguishing factors between two types of otherwise equally tasting soft drinks could be obtained on the basis of the proof of additives used. Further research aimed at obtaining performance characteristics such as limit of detection (LOD) and repeatability of measurement is currently being investigated.
Acknowledgements
This study was undertaken within the project MSM 6046137305 supported by the Ministry of Education, Youth and Sports of the Czech Republic. The authors wish to thank to JEOL (Europe) SAS for a loan of the JEOL AccuTOF DART system for testing purpose.
Tomas Cajka is a PhD student and research scientist at the Department of Food Chemistry and Analysis of the Institute of Chemical Technology, Prague. His main research area focuses on development and application of advanced analytical methods for the analysis of food and environmental contaminants and other organic compounds using SPME and GC×GC–MS.
Lukas Vaclavik is a PhD student at the same university. His main research area focuses on development and application of advanced analytical methods for the analysis of food contaminants using LC–MS–MS.
Katerina Riddellova is an assistant professor at the same university. Her main research area focuses on development and application of advanced analytical methods for the analysis of food contaminants and other organic compounds using SPME and GC–MS.
Jana Hajslova is a professor at the same university. She heads a research group concerned with separation science in the field of food/environmental analysis.
References
1. T. Cajka and J. Hajslova, LCGC Eur., 20(1), 25–31 (2007).
2. R.B. Cody, J.A. Laramee and H.D. Durst, Anal. Chem., 77, 2297–2302 (2005).
3. Z. Takats et al., Science, 306, 471–473 (2004).
4. C.N. McEwen, R.G. McKay and B.S. Larsen, Anal. Chem., 77, 7826–7831 (2005).
5. M.P. Balogh, LCGC N. Am., 25(12), 1184–1194 (2007).
6. J.P. Williams and J.H. Scrivens, Rapid Commun. Mass Spectrom., 19, 3643–3650 (2005).
7. A.T. Jackson, J.P. Williams and J.H. Scrivens, Rapid Commun. Mass Spectrom., 20, 2717–2727 (2006).
8. P.A. D'Agostino et al., Rapid Commun. Mass Spectrom., 21, 543–549 (2007).
9. R.W. Jones, R.B. Cody and J.F. McClelland, J. Forensic Sci., 51, 915–918 (2006).
10. F.M. Fernandez et al., ChemMedChem, 1, 702–705 (2006).
11. J.P Williams et al., Rapid Commun. Mass Spectrom., 20, 1447–1456 (2006).
12. C. Petucci et al., Anal. Chem., 79, 5064–5070 (2007).
13. K. Kpegba et al., Anal. Chem., 79, 5479–5483 (2007).
14. G. Morlock and Y. Ueda, J. Chromatogr. A, 1143, 243–251 (2007).
15. C.Y. Pierce et al., Chem. Commun., 8, 807–809 (2007).
16. O.P. Haefliger and N. Jeckelmann, Rapid Commun. Mass Spectrom., 21, 1361–1366 (2007).
17. A. Alpmann and G. Morlock, J. Sep. Sci., 31, 71–77 (2008).
18. J.G. Wilkes et al., J. Chromatogr. A, 880, 3–33 (2000).
19. W.F. Young et al., Wat. Res., 30, 331–340 (1996).
20. T. Cajka, J. Hajslova and K. Mastovska: Mass spectrometry and hyphenated instruments in food analysis, Handbook of Food Analysis Instruments, S. Otles (Ed.), CRC Press, Taylor & Francis Group (in press, 2008).
21. chemdata.nist.gov/mass-sps/amdis/
22. R.B. Cody et al., JEOL News, 40, 8–12 (2005).
23. S. Kim, R.P. Rodgers and A.G. Marshall, Int. J. Mass Spectrom., 25, 260–265 (2006).
University of Rouen-Normandy Scientists Explore Eco-Friendly Sampling Approach for GC-HRMS
April 17th 2025Root exudates—substances secreted by living plant roots—are challenging to sample, as they are typically extracted using artificial devices and can vary widely in both quantity and composition across plant species.
Analytical Challenges in Measuring Migration from Food Contact Materials
November 2nd 2015Food contact materials contain low molecular weight additives and processing aids which can migrate into foods leading to trace levels of contamination. Food safety is ensured through regulations, comprising compositional controls and migration limits, which present a significant analytical challenge to the food industry to ensure compliance and demonstrate due diligence. Of the various analytical approaches, LC-MS/MS has proved to be an essential tool in monitoring migration of target compounds into foods, and more sophisticated approaches such as LC-high resolution MS (Orbitrap) are being increasingly used for untargeted analysis to monitor non-intentionally added substances. This podcast will provide an overview to this area, illustrated with various applications showing current approaches being employed.
Miniaturized GC–MS Method for BVOC Analysis of Spanish Trees
April 16th 2025University of Valladolid scientists used a miniaturized method for analyzing biogenic volatile organic compounds (BVOCs) emitted by tree species, using headspace solid-phase microextraction coupled with gas chromatography and quadrupole time-of-flight mass spectrometry (HS-SPME-GC–QTOF-MS) has been developed.

