Assessment of Accuracy in Chromatographic Analysis
LCGC Europe
The assessment of accuracy, which involves the estimation of precision and the determination of trueness, refers to the process of evaluating whether the results provided by analytical methods are close to accepted reference values. The different references available in chromatographic analysis and useful guidelines to perform such a comparison are described.
Ricard Boqué,1Alicia Maroto1 and Yvan Vander Heyden,2
1Department of Analytical and Organic Chemistry, Rovira i Virgili University, Tarragona, Spain,
2Analytical Chemistry and Pharmaceutical Technology, Pharmaceutical Institute, Vrije Universiteit Brussel — VUB, Brussels, Belgium.
Laboratory managers and scientists who are responsible for the quality of analytical results need to be able to produce accurate results. Accuracy is extremely important because it assures the comparability of results produced by different laboratories, which gives decision makers and end-users confidence in reported results.
The ISO Guide 3534-1 defines accuracy as "the closeness of agreement between a test result and the accepted reference value," with a note stating that "the term accuracy, when applied to a set of test results, involves a combination of random components and a common systematic error or bias component."1
Accuracy is expressed, then, as two components: trueness and precision.2 Trueness is defined as "the closeness of agreement between the average value obtained from a large set of test results and an accepted reference value," and is normally expressed in terms of bias. Finally, precision is defined as "the closeness of agreement between independent test results obtained under stipulated conditions." Repeatability and reproducibility conditions are particular cases of extreme stipulated conditions.
Repeatability conditions are those where independent test results are obtained with the same method on identical test items in the same laboratory by the same operator using the same equipment within short intervals of time. Reproducibility conditions refer to those where the measurements are obtained in different laboratories with different operators using different equipment. Conditions for intermediate measures of precision also exist. The frequently determined between-day precision estimate of a method is an example of what is called a time-different intermediate precision estimate. Besides time, operator, instrument and calibration are the other factors that can be varied in the intermediate precision estimates.
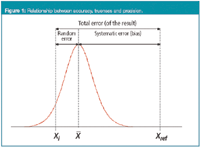
The relationship between accuracy, trueness and precision is shown in Figure 1. The Gaussian distribution represents the theoretical distribution of results produced by the analytical method, centred around the mean, X-mean, while Xi denotes an individual result. The total error of this result, that is, the difference between Xi and the reference value Xref, is the sum of two errors: the difference between Xi and the mean X-mean (random error, related to the precision of the method), and the difference between the mean and the reference value Xref (systematic error or bias, related to the trueness of the method).

Figure 1
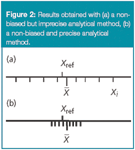
Precision, as can be seen from Figure 1, does not then depend on the true or specified or reference value. However, a method providing very imprecise results is not accurate. This is illustrated in Figure 2(a), where a set of individual results is shown for a given analytical method, together with the accepted reference value. In average (as shown by the mean), the method provides results that are close to the reference value, so the method is not biased. But it is imprecise because some individual results, such as the indicated Xi, are far from the reference value. Following the above definition of accuracy, Xi could not be considered an accurate result.

Figure 2
To get accurate chromatographic results, a laboratory must first check the precision of the chromatographic method and confirm whether it is "fit-for-purpose", that is, adequate to the analytical requirements. After this, the laboratory must assess trueness, and for that, one basic idea must be clear: reference values are needed. The metrological quality of these reference values will influence another sought property of the results, the traceability, in the sense that the results can be related to stated references, usually national or international standards.3
How to get the reference values and how to compare them with the results provided by the analytical methods is the main purpose of this article. In this context, the term accuracy will be used in the sense of bias in the remainder of the manuscript.
References for Accuracy Assessment
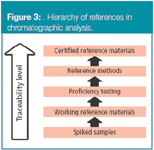
The reference value for accuracy assessment can be obtained in several ways. Figure 3 shows a hierarchy of references for use in chromatographic analysis. They are sorted by taking their traceability level into account.

Figure 3
Accuracy can be assessed by analysing a sample with known concentrations, for example, a certified reference material (CRM), and comparing the measured value with the certified value supplied with the material. This is the best reference available, metrologically speaking. A certified reference material, following the ISO definition,3 is a "reference material, accompanied by a certificate, one or more of whose property values are certified by a procedure, which establishes its traceability to an accurate realization of the unit in which the property values are expressed, and for which each certified value is accompanied by an uncertainty at a stated level of confidence."
The uncertainty of the reference value must be known to establish a sound comparison with the value generated by the laboratory (see section called Statistics in Accuracy Assessment).
When CRMs are not available, then a reference material can be used. A reference material (or working reference material) is a material sufficiently homogeneous and well characterized, but whose traceability is not guaranteed and usually has no stated uncertainty. Examples include materials characterized by a reference material producer, but whose values are not accompanied by an uncertainty statement; materials characterized by a manufacturer; materials characterized in the laboratory or materials distributed in a proficiency test.
Another alternative is to compare the results of the laboratory method with the results from an established reference method, for the analysis of a representative real sample (a CRM is not required in this instance). A reference method of analysis, which is usually a normalized or an official method, is "a method having small, estimated inaccuracies relative to the end use requirement. The accuracy of a reference method must be demonstrated through direct comparison with a definitive method or with a primary reference material."4 This approach assumes that the uncertainty of the reference method is known.
Another external reference to assess accuracy is the participation in a proficiency testing scheme. In such an interlaboratory exercise all participating laboratories analyse a distributed unit of the same test material, provided by the organization of the study. The assigned value of the test material can be determined by one of the following methods: measurement by a reference laboratory, the certified value(s) for a CRM used as a test material, direct comparison of the proficiency testing test material with CRMs, consensus of expert laboratories, formulation, that is, the value assignment on the basis of proportions used in a solution or other mixture of ingredients with known analyte content) and, finally, a consensus value, that is, a value derived directly from the reported results.5
However, a word of caution is necessary. In the instance of consensus values or values derived from a formulation, absence of bias and hence accuracy cannot be assessed using proficiency tests, because there is no necessary relationship between the consensus value and the true (and unknown) value that should be obtained from the proficiency test. Hence, only the so-called "concordance" — and not the accuracy — could be assessed.6
In any case, for laboratories without external references, which could operate for long periods with biases or random variations of serious magnitude, proficiency testing is a means of detecting and initiating the remediation of such problems.
Because they are external to the laboratory, CRMs, reference methods and proficiency testing schemes are the best references available. However, they may not be available for the analysis of certain analytes. In this situation, a representative sample of interest, which can be either a blank sample or a sample already containing the analyte, can be spiked by weight or volume with a known concentration of the analyte. After an occasional extraction of the analyte from the sample matrix and instrumental measurement, accuracy can be assessed by measuring the recovery, that is, the ratio between the content found and the content added.7 A recovery significantly different from unity indicates that the method has a bias. Strictly, recovery studies as described here only assess bias as a result of effects operating on the added analyte; the same effects do not necessarily apply to the same extent to the native analyte, while additional effects may apply to the native analyte. Good recovery is then not a guarantee of trueness; but poor recovery is surely an indication of lack of trueness.
Practical Issues in Accuracy Assessment
The reference sample chosen to assess accuracy (e.g., the CRM, spiked sample, etc.) has to be analysed by covering the whole variability of the chromatographic method within the laboratory. Therefore, the reference sample should not be analysed under repeatability conditions. Instead, the sample should be analysed under "intermediate-precision conditions", that is, on different days, by different operators, with different calibrations, on different instruments.
It is recommended to analyse the reference sample at least seven times (preferably ten or more) to obtain an acceptable reliability.8 After rejecting any outlier result, an average value, x-meanlab, and a standard deviation, slab, can be obtained from these measurements.
As the (chromatographic) method of analysis cannot be expected to have the same bias throughout the measuring range (e.g., with non-linear calibration curves), several relevant concentration levels shall be incorporated to determine bias (at least one determination at a high and a low level, preferably at the quantification limit).
Finally, trueness should be assessed for the different sample matrices that may be encountered in routine analysis. When this is unpractical because of the great number of matrices, at least the laboratory should group the matrices and perform the accuracy assessment for the different groups.
Statistics in Accuracy Assessment
The process of accuracy assessment ends up with a statistical comparison between the reference value (xref) and the mean value provided by the laboratory (x-menalab), and taking into account the uncertainty of both the reference value and the laboratory mean value. The statistic used has the general form:

where slab is the standard deviation of the nlab values obtained by the laboratory under intermediate precision conditions and uref is the uncertainty of the reference value. tcal is compared with the two-sided t tabulated value, tα/2,ν , at the significance level α and ν degrees of freedom (that depend on those from determining both slab and uref). If tcal > tα/2,ν the method has a significant bias. The value of α is kept low because we want to run a low risk of incorrectly rejecting a method that has a non-significant bias. Common values for α are 0.05 or 0.1. If tcal ≤ tα/2,v the bias of the method is not significant. However, a large bias could be declared non-significant if precision is bad and/or the number of replicates, nlab, is small.
From a chemical point of view, some bias is always expected. Therefore, to limit the risk (called β) of accepting a method which is biased, accuracy should be assessed by fixing an acceptable bias, λ, and the question to answer should be: "Does my method differ from the reference value by more than the acceptable bias?" The statistical tests to check that can be found elsewhere and are not discussed here.9
Conclusions
To assess the accuracy of a chromatographic analysis method is of paramount importance to give confidence to the end-users in the results provided by a laboratory. The only way to achieve it is to compare the results obtained by the analytical method with an accepted reference value. We have shown that different references are available, some of them with better metrological quality than others. Uncertainty values must be known to obtain reliable conclusions when performing the statistical comparison. Estimating uncertainty is another key concept that will be discussed in a future "Data-handling column".
Finally, it is important to point out that accuracy assessment is a continuous process, which should be implemented in the routine work, as a part of the QA/QC set-up of the laboratory.
Ricard Boqué is an associate professor and Alicia Maroto is a post-doctoral researcher at the Universitat Rovira i Virgili, Tarragona, Spain, working on chemometrics and qualimetrics. Yvan Vander Heyden is a professor at the Vrije Universiteit Brussel, Brussels, Belgium, department of Analytical Chemistry and Pharmaceutical Technology, and heads a research group on chemometrics and separation science.
References
1. ISO 3534-1:1993. Statistics — Vocabulary and symbols — Part 1: Probability and general statistical terms. International Organization for Standardization. Geneva.
2. ISO 5725:1994. Accuracy (trueness and precision) of measurement methods and results (Parts 1–4). International Organization for Standardization. Geneva.
3. ISO/IEC Guide 30: 1992. Terms and Definitions Used in Connection with Reference Materials. International Organization for Standardization. Geneva.
4. IUPAC Compendium of Chemical Terminology — The Gold Book. 2nd ed. International Union of Pure and Applied Chemistry (1997). goldbook.iupac.org/
5. M. Thompson, S.L.R. Ellison and R. Wood, Pure Appl. Chem., 78, 145–196 (2006).
6. A. Maroto et al., Anal Bioanal. Chem., 382, 562–1566 (2005).
7. M. Thompson et al., Pure Appl. Chem., 71, 337–348 (1999).
8. M. Thompson, S.L.R. Ellison and R. Wood. Pure Appl. Chem., 74, 835–855 (2002).
9. S. Kuttatharmmakul, D.L. Massart and J. Smeyers-Verbeke, Chemom. Intell. Lab. Syst., 52, 61–73 (2000).

.png&w=3840&q=75)

.png&w=3840&q=75)


.png&w=3840&q=75)


.png&w=3840&q=75)


