Fast Analysis of Naproxen Sodium with the Acclaim Trinity P1 Column and Charged Aerosol Detection
LCGC Asia Pacific
ESA - a Dionex Company Application Note
Chris Crafts, Bruce Bailey, and Ian Acworth, ESA - A Dionex Company, Inc.
The characterization of pharmaceutical salts is critical to the drug development process. Active Pharmaceutical Ingredient (API) salts influence the solubility, stability, and hygroscopicity of pharmaceuticals and affect the final drug formulation. Traditionally, the analysis of the API and its counterion salt requires separate applications. Nanopolymer Silica Hybrid (NSH) technology in the Acclaim® Trinity™ P1 column along with the Corona® ultra™ Charged Aerosol Detector (CAD) enables simultaneous analysis of the API and counterion over four orders of magnitude.
The analysis of a common API (naproxen sodium) with a 3 min isocratic run (Figure 1) is presented here. The range, reproducibility, and accuracy of calculation of sodium salts are demonstrated.

Figure 1: A 2 μL injection of naproxen sodium (~800 ng on column) Corona ultra CAD.
Experimental
A standard HPLC system with a Corona ultra™ Sodium acetate and naproxen sodium were from Sigma-Aldrich.
HPLC Parameters:
Column: Dionex Acclaim Trinity P1, 3 μm, 3.0 × 50 mm
Column Temperature: 30 °C
Mobile Phase: Acetonitrile /120 mM ammonium acetate (pH 4.8; 75/25 v/v), 30 mM total buffer
Flow Rate: 0.8 mL/min
Injection Volume: 2 μL
Nebulizer Temperature: 25 °C
Filter: Corona
Results
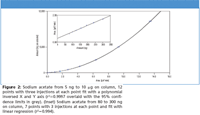
A calibration curve from 5 ng to 10 μg of sodium acetate on column was generated using a quadratic fit function, and the x and y axes were inverted (Figure 2), demonstrating the wide dynamic range of the detector. A second curve, from 80 to 300 ng on column (Figure 2 inset), demonstrates the linearity of the detector over small ranges. Both of these curves returned correlation values > 0.99 and reproducibility ≤ 2% for the three injections at each point. The correlation to the theoretical sodium content in the naproxen was then calculated from each curve using a sample of ~800 ng naproxen sodium on column. Recoveries were within 3% of theoretical for the full range curve and within 1% for the linear curve (Table I).

Figure 2
Conclusion
The CAD response curve towards sodium (as acetate salt) shown in Figure 2 illustrates that an excellent correlation can be calculated even when a wide dynamic range (low nanogram to microgram quantities on column) is used. The accuracy and reproducibility data are sufficient for both research and QC environments. This analytical approach provides accurate and reproducible data for both the API and the counterion salt. Due to the speed of the method there is an opportunity for significant cost savings during the drug development process. The example can be expanded to other APIs containing both inorganic and/or organic salts.

Table I: Theoretical and calculated values for sodium
Acclaim and Corona are registered trademarks and ultra and Trinity are trademarks of Dionex Corporation.

ESA – A Dionex Company, Inc.
22 Alpha Road, Chelmsford, MA 01824
tel. (978) 250-7000; fax (978) 250-7087
Websites: www.esainc.com; www.dionex.com

Characterizing Plant Polysaccharides Using Size-Exclusion Chromatography
April 4th 2025With green chemistry becoming more standardized, Leena Pitkänen of Aalto University analyzed how useful size-exclusion chromatography (SEC) and asymmetric flow field-flow fractionation (AF4) could be in characterizing plant polysaccharides.
Investigating the Protective Effects of Frankincense Oil on Wound Healing with GC–MS
April 2nd 2025Frankincense essential oil is known for its anti-inflammatory, antioxidant, and therapeutic properties. A recent study investigated the protective effects of the oil in an excision wound model in rats, focusing on oxidative stress reduction, inflammatory cytokine modulation, and caspase-3 regulation; chemical composition of the oil was analyzed using gas chromatography–mass spectrometry (GC–MS).


