Factors for the Success of Multidimensional Liquid Chromatography
Special Issues
The use and evolution of the two-dimensional liquid chromatography (LCxLC) technique is explored with respect to instrumentation and applications.
As more separation scientists become involved with multidimensional liquid chromatography (MDLC), the science, technology, and methodology of this technique evolves. Some of the evolution of the technique is due to the need to analyze samples with more detail and with greater speed. But in MDLC, and specifically the two-dimensional liquid chromatography (LC×LC) technique, it is important to study the key applications and the availability of instrumentation to understand how the LC×LC technique is evolving.

In this article, I will focus primarily on the most common LC×LC method, which is the "comprehensive" mode of operation (1). In the comprehensive mode of operation, the whole fractionation space is examined on-line. In contrast, in the so-called "heart-cutting" method of LC×LC analysis (1), which has been utilized for decades, only part of the eluted sample from the first column or "first dimension" is submitted to another column — the "second dimension" — for limited high resolution analysis. This mode of LC×LC separation will not be discussed further. We will discuss off-line operation where the first dimension is deposited in a fraction collector with subsequent analysis of each fraction with a second column that possesses different retention characteristics than the first dimension column. The interest in off-line separations is as follows: If the scientist needs to have the ultimate amount of resolution, as one needs in exploratory research, then taking a long amount of time, for example a whole day, is not necessarily a restriction. However, if one develops a method that needs to be used in a routine way with throughput issues, then the comprehensive mode is most desirable.
Rather than ask the question: "Why isn't LC×LC analysis being utilized in most labs where high performance liquid chromatography (HPLC) is the mainstay of techniques?" we ask another question: "What applications require the resolving power that LC×LC can potentially deliver?" Many techniques in separation science are developed that tend to evolve over a period of time and LC×LC is a technique with such growth. Many techniques have also appeared with a large growth in a short time and then retreat into a smaller usage. An example of this is capillary electrophoresis. So what is the state of LC×LC and why isn't it being practiced in more laboratories? In this article, I will attempt to answer questions such as this. We will avoid from discussing the gas chromatography (GC) analog, GC×GC, which has been offered commercially by a number of manufacturers and has a following for certain high resolution analyses of volatile samples like fuels, volatile natural products, odor analysis, and other applications. Clearly this technique is more developed commercially, but the promise of having high resolution analysis of biomolecules and industrial polymers largely has driven the interest in LC×LC.
When one inquires about applications and how they drive commercial instrument development, a very insightful article by Guiochon (2) should be consulted. This article suggests that applications drive the need for commercial instruments and that techniques that endure and mature, rather than die, do so because of applications that are best done by that instrument and technique. It is the "key" applications that keep the instrument and technique viable. I will examine this effect for LC×LC and discuss applications that clearly need the capabilities that LC×LC brings.
A number of key factors have been driving the increased use of LC×LC. These include
- Increased resolving power due to orthogonal retention mechanisms. These analyses run the spectrum of molecular weights from low to high. LC×LC can be the key to resolving multifunctional molecules and polymers that are not resolvable in 1D chromatography. An example of this orthogonality is shown in Figure 1, where the two retention mechanisms almost act independently to resolve the alkyl and ethylene oxide chain-length distributions within small polymer surfactants.
- Increased peak capacity because the sample complexity is too high for a 1D method. In proteomics and other areas where biomolecule separations are practiced, there are too many peaks to fit into a 1D separation space; LC×LC has more separation space than LC.
- More researchers are becoming familiar with LC×LC and trying LC×LC for new applications. These researchers are finding success with the method where 1D methods have not been successful. Part of this is driven by the increased literature of LC×LC and part is driven by the increased commercialization of the technique.
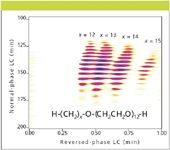
Figure 1: LCÃLC using normal-phase LC (first dimension) and reversed-phase LC (second dimension) of Neodol 25-12 with the corresponding chemical structure and average ethylene oxide distribution as supplied by the manufacturer. Reprinted from reference 3 with permission of the American Chemical Society.
These three factors drive the development of the technique. However, the reality is that relatively few chromatographers have tried LC×LC in contrast to GC×GC and in contrast to the routine use of LC (that is, HPLC). I will now focus on the available instrumentation and on the key applications that drive the evolution of the technique.
Available Instrumentation
One limiting factor in the evolution of LC×LC is that equipment for LC×LC is not widely available. In some cases, researchers have assembled their own equipment and this has been the case from the earliest of publications. There are three ways to go here. The first is to invent the missing pieces to the LC×LC puzzle. The second is to add on commercially available "add-on" kits to existing HPLC systems. The add-on approach consists mostly of software because the additional hardware of valves, columns, and pumps are available from the standard chromatographic equipment manufacturers. The third is to buy a preassembled and integrated instrument that can perform LC×LC as soon as the instrument is set up. Before discussing all three of these scenarios, I will review the basic operation of the hardware and software.
As shown in Figure 2, the main hardware feature of LC×LC comprises a 10-port valve (other numbers of ports can also be used [1]) to control the two columns which provide different retention mechanisms that comprise LC×LC. In position A, the valve is set to feed the eluent from column 1 into sample loop L1. At the same time, pump 2 is eluting the zone that was stored in sample loop L2 through column 2 into the detector or detectors. When sample loop L1 is filled, the valve is switched to position B, also shown in Figure 2. Now pump 2 elutes the contents of sample loop L1 into column 2 with subsequent separation and elution from column 2. Simultaneously in position B, the eluent from column 1 is now being collected in sample loop L2. This process is repeated periodically until all of the peaks eluted from column 1 have been sampled repetitively by column 2.
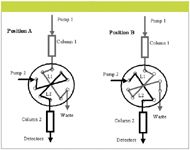
Figure 2: LCÃLC with a 10-port valve and two sample loops. In position A, loop 1 (L1) is being loaded with sample effluent from column 1 and loop 2 (L2) is being injected onto column 2. In position B, L2 is loaded with sample effluent from column 1 and L1 is being injected onto column 2. Figure and caption taken with permission from reference 1.
The software needed to implement LC×LC takes the signals stored from a detector such as a UV detector, mass spectrometer, multiwavelength diode array detector, or evaporative light scattering detector and converts these into a matrix form for display, as shown in Figure 1. The sampling of the detector signal would look somewhat repetitive if viewed in a linear manner with time. The LC×LC software provides the visualization capability of the data matrix and in addition, controls the time-dependent switching of the valve. Other features of software include differencing of 2D chromatograms, determining retention times in two dimensions, isolation of zone spectra and other features, such as converting off-line 1D chromatograms into 2D chromatograms.
"In-house" developed software: Although the software needed for LC×LC can be developed "in house," this is a huge job which is better done by software specialists working in conjunction with chromatographers. However, most industrial laboratories cannot afford to tie up the resources for the length of time it takes to develop this software. In addition, many industrial laboratories do not have the programming expertise needed to do this. The development of LC×LC software by academic laboratories is mostly done to produce custom, adaptable systems and to save money. For laboratories that expect to use LC×LC with routine usage, the software should be available as either add-on or available as part of a fully integrated commercial instrument.
Add-on software for LC×LC: There are a number of commercial sources (4–6) through which LC×LC capabilities can be added to an existing 1D instrument. In this case, the analyst must have good experimental skills as the valve, the sample loops, and the additional pump must be added, although this is not difficult to do. One of the keys to the add-on kit is the universal part of this approach. The software should be able to read common file formats. In most cases this comes down to using the export facility that writes the data in the NetCDF format (1) used by most manufacturers of chromatography and mass spectrometry (MS) data systems.
Integrated systems for LC×LC: Users who use chromatography for routine use, but need the enhanced resolution of LC×LC, want instruments with fully integrated hardware and software in a "turnkey" system. Many instrument companies who are associated with 1D HPLC do offer LC×LC products. I will not list them here because one can find this information on the internet and it is dynamic.
Most of these companies are selling LC×LC as a proteomics system. Some companies sell an off-line version and some sell the comprehensive on-line version of LC×LC. In most cases the larger companies may also sell GC×GC which has been commercially accepted longer than LC×LC. In most cases, these turnkey systems have MS capability as the proteomics applications are dependent heavily upon MS and must be integrated into the analysis scheme.
Problems with LC×LC Instrumentation That Need to Be Overcome
Sampling and second dimension speed: In LC×LC, the overall speed of the method is limited by having to sample the first dimension some number of times across a first dimension peak. This number of samples can limit the method: If too many samples are taken, the analysis time is prohibitively long. If too few samples are taken, the zone shape becomes distorted and resolution reduced. Although I have recommended four samples per peak since the original publication on sampling in LC×LC (7), this is tough to do without slowing down the overall analysis. Davis and colleagues, using simulation (8), recently recommended at least four samples per peak. I believe the rigorous sampling of the first dimension, with its concomitant slow-down of the overall analysis, is one of the largest limitations inherent in the comprehensive LC×LC method. The sampling frequency (and time) appears to fundamentally limit the speed with which LC×LC can be practiced.
There are a number of ways to minimize this problem. The first is to develop fast, high resolution methods for the second dimension. One approach to this has been developed by Peter Carr's group (9) and employs a very fast gradient elution system that can maintain complete 2D cycle times of 21 s. The other method is to employ multiple columns in the second dimension so that the second dimension time can be halved effectively (10). This approach however, requires software that can compensate for differences between these columns, which should be nearly identical for the best results. In addition, some applications, if they are to be done routinely in 2D and retention times need to be used for identification, retention time alignment software may be required.
Off-line analysis is also not particularly well developed. In off-line sequential analysis by LC×LC, N sequential 2D runs are performed in a serial manner, where N is the number of samples from the 1D column. The serial nature of the 2D analysis causes the total analysis time to be quite long. This could be speeded up if parallel, high-throughput chromatography was employed. There are a few systems commercially available that can perform parallel chromatography. However, these systems are not integrated into off-line LC×LC products.
The most recognized theoretical argument for any multidimensional technique is that the total peak capacity, nc, is the product of the peak capacity in each dimension such that nc = n1 { n2 · · · The peak capacity is a theoretical construct that describes the number of chromatographic peaks that can be placed side by side from the start to the end of the chromatogram. Obviously, since peaks do not ever occur with this elution pattern, the peak capacity is a concept rather than something easily measurable, although there have been schemes published on how to measure peak capacity. In that regard, the theoretical development of LC×LC needs an injection of more data analysis techniques.
Peak capacity arguments fall short in some applications because many bio-derived samples are far more complex than 2D can resolve. This limitation is often true with industrial polymers as well, as the separation power needed to resolve individual peaks for each polymer chain length also falls short. Unlike many MS-based methods where resolution can be obtained at the individual "mer" level, chromatography cannot distinguish individual polymers in the medium to high mass range.
A separation complexity index would be a most favorable development that could be measured from experiment. This would facilitate the comparison of 2D and 1D separation results. In regards to modern analysis, MS detectors have not been utilized fully to increase the resolving power for 1D or 2D chromatograms through peak defusing algorithms. These algorithms would help increase the 2D (or for that matter 1D) resolution that chromatography is employed for. This has apparently been taking place with GC×GC in one manufacturer's product but would be a welcome development for LC×LC.
In one study (9) that compared 1D and 2D operation, under a number of constraints, it was shown that for times longer than approximately 10 min, the 2D technique had better separation characteristics than the 1D method. This is a powerful statement and should help drive the continued interest in LC×LC. However, this leads to the question of whether the enhanced performance is worth the additional method development time and the additional experimental complexity required for LC×LC.
Key Applications of Interest
Polymers: One of the oldest applications of LC×LC is for polymer analysis where the first dimension is a reversed-phase LC column and the second dimension is typically a size-exclusion column. This system basically separates on a hydrophobicity scale and then on a molecular size scale. This is quite effective and many laboratories that are engaged with polymers of all types, for example surfactants, block copolymers and industrial chemicals of molecular weight typically greater than 600 Da, can profit highly by this analysis. The 2D application shown in Figure 1 is in this class of separations.
Certain companies have seriously invested in the LC×LC technology and in some cases because the polymer analysis application is so important, these companies have developed either their own equipment or used the add-on products quite successfully. A good overview of the present state of the art in polymer LC×LC is given in references (11–13).
MS has now been used routinely for these types of analyses and can also be employed for some sequencing information in block and graft copolymers. Traditionally UV and evaporative light scattering detectors have been employed as single-channel detectors for polymer analysis and that continues. For copolymer analysis the first dimension may be the so-called liquid chromatography at the critical condition (LCCC) (11) where one of the block components is made "retentionless" through the precise choice of chromatographic solvent conditions. A LC×LC chromatogram of this type is shown in Figure 3 where LCCC is used as the first dimension for characterizing the triblock copolymer PEO-PPO-PEO (11) where PEO is polyethylene oxide and PPO is polypropylene oxide.
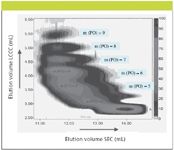
Figure 3: LCÃLC separation of a polyethylene oxideâpolypropylene oxideâpolyethylene oxide triblock copolymer. First dimension is a reversed-phase LC run under critical chromatographic conditions and the second dimension is SEC. Figure and caption taken with permission from reference 11.
It is safe to say that the analysis of polymers is one of the most successful applications of LC×LC. Because of the economic importance of this application, it is practiced in many laboratories regardless of the availability of commercially available instrumentation. This ensures the evolution of the technique, within the confines of the organization where it is practiced, but does not necessarily contribute to the evolution of the technique as a whole.
Proteomics: The workhorse for discovery research in proteomics is often the two-dimensional separation of intact proteins using isoelectric focusing in the first dimension with subsequent resolution using polyacrylamide gel electrophoresis (IEF/PAGE) (14) in the second dimension. Hundreds of zones are often displayed with separations using IEF–PAGE. Zone identification is often made by transferring a zone or "spot" from the gel to an LC–MS or LC–MS-MS system after digestion to liberate the peptides. Proteins are identified by their peptide signatures using database searches.
The big advantage of using LC×LC over the gel format is the faster analysis, a much lower detection limit, and an increase in reproducibility. Clearly, the LC×LC technique is far more useful if multiple analyses need to be conducted, for example screening a diverse population for some biomarker. However, the elution of hydrophobic proteins is problematic and solubility problems abound for biological fluid analysis. These issues also exist for gels and are perhaps more problematic with gel-based separations. Although the IEF–PAGE technique yields hundreds of peaks, LC×LC does not elute hundreds of peaks. Therefore, LC×LC is not yet competitive with IEF–PAGE for exploratory research. Clearly, proteomics research needs more than three dimensions (LC×LC–MS) for single-component resolution as the number of components in biological analysis may be extremely high when one considers just how diverse the proteome is with the different isoforms, amino acid polymorphisms and the large dynamic concentration range that is present in serum.
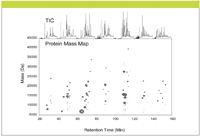
Figure 4: The total ion current (TIC) chromatogram and deconvoluted protein mass map for an LCÃLC (strong cation exchangeâreversed phase)âMS analysis of yeast ribosomal proteins. The bubble size is proportional to the component intensity. Figure and caption taken with permission from reference 15.
One long-running debate over the last decade has been whether "top-down" proteomics (analyzing intact proteins) or "bottom-up" proteomics (analyzing peptide signatures from digested proteins) is the best way to go. High resolution chromatographic separation of intact proteins is difficult in one chromatographic dimension, and the problem is not resolved with two dimensions and probably not with three dimensions either. Many chromatographic studies show that peptide analysis can be conducted effectively with higher resolution in two dimensions, however, one is increasing sample complexity with this scheme in the name of analyzing smaller molecular (that is, peptide) units, rather than analyzing intact proteins. One analysis of intact proteins performed with LC×LC–MS is shown in Figure 4; the power of this approach is only beginning to be explored (15). Lubman and coworkers, at the University of Michigan, use chromatofocusing in the first dimension as a replacement for the IEF step and use reversed-phase LC in the second dimension in their biomarker work. A 2D chromatogram from their work (16) is shown in Figure 5. Although chromatofocusing does not have the resolution that IEF is capable of, as it is not truly a focusing technique, the results are impressive nonetheless.
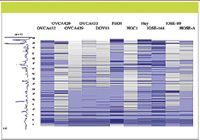
Figure 5: Peak patterns of 11 serous and ovarian surface epithelium (OSE) cell lines. Fraction pI 6.05 to 6.20, gradient range from 30% to 78%. The relative intensities of the band are quantitatively proportional to the amount of corresponding protein detected by UV absorption. Figure and caption taken with permission from reference 16.
It is unusual for medical diagnostic purposes to have analytical instruments of high cost and complexity thrust on to the high-throughput testing regime used for serum-based analysis schemes, which often are based upon the enzyme-linked immunosorbent assay (ELISA) technology. Because many biomarker discovery systems are based upon LC×LC with MS, this would require a change in the laboratory facilities used presently for high-throughput biomarker testing. However, when MRI, CAT, and PET-scan technologies were introduced, they often were seen as too exotic for general utilization. The acceptance of these technologies is now taken for granted because of the phenomenal usefulness and wide range of application. LC×LC–MS may take longer to adapt as these instruments are not designed for high-throughput operation. If it is determined that LC×LC–MS is "the" technique for a certain type of biomarker, it is quite possible that this would change at a rapid pace.
Metabolomics: The characterization of metabolic profiles in an organism recently has been coined with the term "metabolomics." These studies typically are concerned with small molecules and techniques as diverse as nuclear magnetic resonance (NMR) spectroscopy and GC have been utilized to fingerprint the metabolome. For exploratory purposes, one would like to know what specific compounds might be useful as diagnostic markers. LC×LC may be ideal for this but more research needs to be done. Rather than use a crystal ball (mine is still in the shop being repaired), it must be seen over time whether LC×LC is the key or that GC can be effectively utilized. As expected, the diversity of molecules in the metabolome is huge.
Process analytical technology: Work at Biogen Idec (Cambridge, Massachusetts) (17) has shown that LC×LC can be conducted on the manufacturing floor as part of an analytical system for monitoring the concentrations of processed biomolecules. The utilization of analytical instruments on the factory floor is often called process analytical technology (PAT). This is a most impressive application of LC×LC as the need to characterize the components of interest could not be accomplished in one dimension in this application. Biotechnology applications abound for LC×LC and this is just one of many LC×LC applications where the selectivity and resolution of one-dimensional chromatography was not adequate for the task at hand. In the PAT application, custom hardware and software was configured as this is a leading edge application that is not currently offered in a turnkey package.
Method Development
In addition to the changes in instrumentation, which may be new to many chromatographers, developing a new method for LC×LC is different than developing a method for the traditional one-dimensional LC analysis. Method development for LC×LC is an area that requires more work because the column choice has to be thought out and there are very few procedural methods worked out for LC×LC. One recently published scheme is a hierarchical method (18) where "cardinal rules" were stated. These rules, in the order of importance, include: column selection, determining sampling speed, solvent systems selection and design of gradients, second-dimension elution time determination, sample loop volume determination, and first-dimension optimization. Integrated into this scheme are the usual optimization techniques for 1D columns. If the user of LC×LC simply copies a method from the literature, then a certain amount of tweaking time is probably in order because the columns may not be exactly the same. However, one should not dismiss the time it takes to develop a LC×LC method; if the sample is truly complex, this step can be very long and occupy the analyst's time with far greater intensity than just simply running the analysis in an unoptimized manner. As stated in reference 18, "In the case of a separation that can be resolved adequately with a one-dimensional method, the added complexity of LC×LC is not worth the effort." But this scenario should not happen too often as the driving force for conducting LC×LC is to analyze complex samples and the resolving power limits of one-dimensional methods becomes readily apparent with little effort. Furthermore, the reproducibility of LC×LC is very good and the inherent error in the LC×LC method is not large — it is similar to that found for 1D methods depending upon whether quantitative results are desired. Quantitative LC×LC must be explored, as only a few papers have examined this aspect. Instrument companies and academic labs can make important contributions in this area.
What Needs to be Done
Manufacturers of LC×LC equipment need to become more visible in the development of this technology. Better methodology for parts of the methods development cycle, for example, software and schemes for evaluating the pairing of first and second dimension columns, needs to be developed. Instrument companies also need to continue to develop standards for multidimensional software, including the expansion of definitions useful to multidimensional chromatography for the NetCDF data standard. These were intended to be defined but never were for multidimensional chromatography (1). If these standards were defined, it would be possible to exchange 2D chromatograms between instruments and software systems easily. This would facilitate the development of new chemometrics schemes for 2D chromatography and MS analysis.
Short courses have covered many of the aspects for both polymer analysis and proteomics application in LC×LC. These need to be developed further as were the basic HPLC short courses over the last 25 years. More key applications will drive the instrument companies to offer more refined instrumentation specifically focusing on these applications. The user community can then embrace this technology and drive it forward. Finally, increased insight from more basic studies and additional software will allow the off-line version of LC×LC, which requires just a fraction collector and additional software, to be far more utilized than it has been in the past and present.
Many conferences have highlighted LC×LC over the last decade and continue to do so. These include the HPLC symposium conference, the ISPPP conference, and the hyphenated techniques in chromatography conference (HTC), among others. Short courses on LC×LC are given routinely at these conferences. As more applications are shown to be viable for LC×LC, the field will move forward and offer the scientist more capabilities through advances in instrumentation and methodology.
Acknowledgment
Discussions with Dr. Robert E. Murphy, Dr. Steven A. Cohen and Prof. David M. Lubman are gratefully acknowledged.
Mark R. Schure
Rohm and Haas Company Springhouse, Pennsylvania
Please direct correspondence to Mark.Schure@GMail.com
References
(1) R E. Murphy, M. R. Schure, "Instrumentation for Comprehensive Multidimensional Liquid Chromatography," in Multidimensional Liquid Chromatography: Theory and Applications in Industrial Chemistry and the Life Sciences, S.A. Cohen and M.R. Schure, Eds. (John Wiley and Sons, Inc. New York, 2008), Chapter 5.
(2) G. Guiochon, Am. Lab., p. 14–15, Sept. 1998.
(3) R.E. Murphy, M.R. Schure, and J.P. Foley, Anal. Chem.70, 4353–4360 (1998).
(4) GC Image: http://www.gcimage.com
(5) Kroungold Analytical: http://www.kroungold.com
(6) Polymer Standard Service: http://www.polymer.de/
(7) R.E. Murphy, M.R. Schure, and J.P. Foley, Anal. Chem.70, 1585–1594 (1998).
(8) J.M. Davis, D.R. Stoll, and P.W. Carr, Anal. Chem. 80, 461–473 (2008).
(9) D.R. Stoll, X. Wang, and P.W. Carr, Anal. Chem. 80, 268–278 (2008).
(10) A.J. Alexander and L. Ma, J. Chromatogr., A 1216, 1338–1345 (2009).
(11) F. Rittig and H. Pasch, "Multidimensional Liquid Chromatography in Industrial Applications," in Multidimensional Liquid Chromatography: Theory and Applications in Industrial Chemistry and the Life Sciences, S.A. Cohen and M.R. Schure, Eds. (John Wiley and Sons, Inc. New York, 2008), Chapter 17.
(12) P. Kliz, R.-P. Kruger, H. Much, and G. Schulz, "Two-Dimensional Chromatography for the Deformulation of Complex Copolymers," in Chromatographic Characterization of Polymers, T. Provder, H.C. Barth and M.W. Urban, Eds., Adv. In Chemistry Series, No. 247 (Am. Chem. Soc., Washington D.C. 1995), Chapter 17.
(13) P. Kilz, Chromatographia 59, 3–14 (2004).
(14) J E. Celis and R. Bravo, Two-Dimensional Gel Electrophoresis of Proteins (Academic Press, New York, 1984).
(15) S.A. Cohen and S.J. Berger, "Multidimensional Separation of Proteins with On-Line Electrospray Time-of-Flight Mass Spectrometric Detection," in Multidimensional Liquid Chromatography: Theory and Applications in Industrial Chemistry and the Life Sciences, S.A. Cohen and M.R. Schure, Eds. (John Wiley and Sons, Inc. New York, 2008), Chapter 13.
(16) D. Lubman, N.S. Buchanan, F.R. Miller, K. Cho, R. Wu, S. Goodison, Y. Wang, P. Kreunin, and T.J. Barder, "Two-Dimensional Liquid Mass Mapping Technique for Biomarker Discovery," in Multidimensional Liquid Chromatography: Theory and Applications in Industrial Chemistry and the Life Sciences, S.A. Cohen and M.R. Schure, Eds. (John Wiley and Sons, Inc. New York, 2008), Chapter 10.
(17) Y. Lyubarskaya, Z. Sosic, D. Houde, S. Berkowitz, and R. Mhatre, "2DLC/MS for In-Process Analysis of a Recombinant Protein Concentration and Glycosylation," presentation at ISPPP 2007, Orlando, Florida (www.isppp.org).
(18) R.E. Murphy and M.R. Schure, "Method Development in Comprehensive Multidimensional Liquid Chromatography," in Multidimensional Liquid Chromatography: Theory and Applications in Industrial Chemistry and the Life Sciences, S.A. Cohen and M.R. Schure, Eds. (John Wiley and Sons, Inc. New York, 2008), Chapter 6


.png&w=3840&q=75)

.png&w=3840&q=75)


.png&w=3840&q=75)


.png&w=3840&q=75)


