Charged Aerosol Detection in Pharmaceutical Analysis: An Overview
Special Issues
Over the past several years, charged aerosol detection (CAD) has become a widely used technology in the pharmaceutical laboratory. From formulation to stability and even quality control, many analysts are turning to this technology due to its advantages of sensitivity, ease of use, dynamic range, and applicability to a wide range of analyses in the drug development process. In this article, we will examine the operation and use of CAD in a regulated environment, briefly address method development and validation specifics, and highlight a few examples illustrating some of its advantages when used in the pharmaceutical laboratory.
Charged aerosol detection (CAD) was first introduced commercially in 2004 (Corona, ESA Biosciences, Chelmsford, Massachusetts) and is based upon a combination of high performance liquid chromatography (HPLC) with electrical aerosol technology available since the 1970s (1–6). In CAD, the HPLC column eluent is first nebulized with a nitrogen (or air) carrier gas to form droplets that are then dried to remove mobile phase, producing analyte particles. The primary stream of analyte particles is met by a secondary stream that is positively charged as a result of having passed a high-voltage, platinum corona wire. The charge transfers difusionally to the opposing stream of analyte particles, and is further transferred to a collector where it is measured by a highly sensitive electrometer, generating a signal in direct proportion to the quantity of analyte present. A simplified schematic of how CAD works is illustrated in Figure 1.

Because the entire process involves particles and direct measurement of charge, CAD is highly sensitive, provides a consistent response, and has a broad dynamic range, which offers some real advantages to researchers and analysts in the pharmaceutical laboratory, particularly when analyzing compounds lacking UV chromophores. Often compared to other universal-type HPLC detectors, like refractive index (RI) detection and evaporative light scattering detection (ELSD), CAD has been shown to be much easier to use, and unlike RI, can accommodate gradients. In addition, CAD response is not dependent upon the chemical characteristics of the compounds of interest, but on the initial mass concentration of analyte in the droplets formed upon nebulization, providing a much more uniform response as opposed to, for example, UV, where responses can vary dramatically according to the wavelength used and the extinction coefficient. It is precisely these advantages that make it an attractive addition to the pharmaceutical laboratory throughout all phases of drug development.

Figure 1: A simplified schematic of a Corona charged aerosol detector (Figure courtesy of ESA, Inc. Chelmsford, Massachusetts.)
CAD has been used for a wide range of analyses throughout the drug development process, for example drug discovery (7), formulations research and development (8), natural product isolation (9), impurities (10,11), cleaning validation (12), drug substance and drug product characterization (13,14) and stability (15) among others. In most aspects, the charged aerosol detector is simple and easy to use and can be described as a "plug and play" detector requiring little in the way of special attention, unlike an evaporative light scattering detector. A comprehensive list of CAD applications by compound type is available (1). While many of the reported uses of CAD in the literature are for research and development (R&D) and method development, use in a regulated environment in support of Good Manufacturing Practices (GMP) also has been reported (15), where method validation and method transfer are important considerations. However, whether implementing the CAD in an R&D or quality control (QC) laboratory, in addition to highlighting its use, this article also discusses a few things to keep in mind to ensure success.
CAD in Analytical Method Development
The first question to answer during analytical method development (AMD) is "Will my compound respond?" While CAD certainly has advantages for detecting compounds that do not have UV chromophores, it can provide advantages (such as equivalent relative responses independent of the extinction coefficient) even for compounds that do have a chromophore because of its near universal response. The one single overriding criterion for determining analyte response is volatility — compounds of interest must be nonvolatile.
Molecular weight, melting point, or boiling point cannot be used to predict a compound's volatility with any great accuracy because compounds that have similar molecular weights can have very different volatilities due to polarity and hydrogen bonding. For example, glycerol (MW 92; bp 290 °C) is detected easily to < 10 ng on column but propylglycerol (propanediol) (MW 76; bp 188 °C) is not. A better indicator of volatility is vapor pressure. Because substances with higher vapor pressure vaporize more readily than substances with a lower vapor pressure, the latter respond better to CAD. Table I lists a few compounds and their responsiveness to CAD along with their vapor pressure.
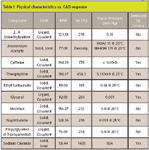
Table I: Physical characteristics vs. CAD response
Solvents also play a role in CAD response; purity, volatility and viscosity are important factors. In general, using higher purity solvents, the background current is lower, leading to less noise and baseline drift from gradients due to fewer particles formed from nonvolatile impurities. One major requirement, however, is that because the CAD process involves nebulization to remove the mobile phase, volatile mobile phases must be used. That generally means aqueous–organic solvents (water–methanol–acetonitrile mixtures), with volatile buffer additives (when necessary) such as formic acid, acetic or trifluoroacetic acid, and ammonium acetate, similar to mass spectrometry (MS) mobile phase requirements. Finally, mobile phase viscosity also is important because it can affect both the nebulizer and drying process. Low viscosity mobile phases (that is, high organic) produce a greater number of droplets and particle generation is more efficient than those of high viscosity (that is, aqueous), increasing detector response and sensitivity. Also, with low viscosity mobile phases, more analyte is available for detection; with aqueous phases more analyte goes to waste, which affects sensitivity.
A good general approach to determine analyte response and solvent affects during AMD is to perform a flow injection analysis (FIA) experiment by injecting the analyte of interest into the mobile phase without the column in line (16). A typical AMD system might include multiple detectors in addition to the CAD, for example, UV–photodiode array (PDA) or MS detectors. Detectors in series are preferable to a parallel configuration to avoid flow splitting, however when used in combination with other destructive detectors (for example, MS) flow splitting is unavoidable. In series configurations, the CAD system should be placed last in line. A charged aerosol detector causes about 7 bar of back pressure, well within the range of typical UV–PDA detector flow cell limitations. In multiple detector system configurations extra care should be taken to make proper connections and to avoid excessive tubing lengths so as to not contribute additional dead volume that can lead to increased band spread.
Of course, in any AMD process, column choice is very important, a fact that naturally does not change with CAD. However, care should be taken to choose a column with minimal "bleed," as bleed in the form of nonvolatile compounds contributed by the column can result in increased background noise (17). For this reason, method developers sometimes choose polymeric based columns over silica to reduce background noise due to column bleed when sensitivity is of prime importance.
One additional AMD note, on the subject of fast HPLC: CAD detection is compatible with fast HPLC techniques on sub-2-μm particle columns to a point, as long as the width of analyte peaks is greater than 4 s (at base) and peak volume is greater than 40 μL (18). Future generations of CAD systems hopefully will push the envelope further to become fully compatible with fast HPLC technology.
CAD in Analytical Method Validation
Analytical method validation (AMV) is the process of providing documented evidence that the analytical method or procedure does what it is intended to do, or accomplishes its intended purpose. AMV guidelines are somewhat generic in nature, that is, they do not specifically reference individual technology or specific instrumentation. So in that regard, CAD should be treated just like any other detection system used for AMV in the regulated laboratory, and it should be held to the same standards. Indeed, there are many literature reports of validating methods using CAD (10,13,15).
During AMV, several analytical performance characteristics are evaluated, including specificity, accuracy, precision, linearity, range, limits of detection and quantitation, and robustness. It is also customary to evaluate system suitability before analyzing samples (22). While a detailed discussion of AMV is outside the scope of this article, guidance for AMV is available from a number of sources and should be consulted for more detail (19–21). However it is worthwhile to comment here on a couple of specific considerations, regarding robustness, linearity, system suitability and intermediate precision, that should be made when validating a method that includes CAD.
Robustness is one parameter that, if not investigated during AMD, usually is investigated early in AMV. The robustness of an analytical procedure is defined as a measure of its capacity to obtain comparable and acceptable results when perturbed by small but deliberate variations in procedural parameters listed in the documentation. Robustness provides an indication of the method's suitability and reliability during normal use. During a robustness study method parameters are intentionally varied to see if the method results are affected. Example HPLC variations include parameters such as flow rate, pH, and mobile phase organic and buffer concentrations. Because the CAD response can be dependent upon solvent composition, any potential for change in the mobile phase is one parameter that should be investigated in some detail, particularly when using gradients. In addition, the CAD response is somewhat sensitive to the nitrogen flow rate to the detector; therefore it is a CAD-specific parameter that should be investigated during any robustness study.
Linearity is the ability of the method to provide test results that are directly proportional to analyte concentration within a given range. While the dynamic range of CAD has been shown to be over four orders of magnitude (16), over wide ranges CAD response is often nonlinear and approximates a quadratic function. However for smaller ranges, CAD response can be treated as linear (12,23). With a dynamic range of four orders of magnitude, determining limits of quantitation and detection does not prove to be an issue for most compounds at the 0.1% and 0.05% concentration levels (relative to the target compound), respectively, as specified in International Conference on Harmonization (ICH) guidelines (24).
Resolution and efficiency are common criteria for system suitability, and can be affected by the band-spread in the system. When used by itself, CAD contributes little more than any other type of detection system in terms of band-spread. Where band-spread might become important, however, is when the charged aerosol detector is used in combination with other detectors, as mentioned previously. The detector used before the CAD system can cause band broadening and this effect (if any) should be measured in separations where resolution is critical, for example, closely eluted related substances.
Intermediate precision refers to the agreement between the results from within-laboratory variations due to random events that might normally occur during the use of a method, such as different days, analysts, or equipment. It is to be expected that differences between different charged aerosol detectors should be minimal. The authors' experience has borne this fact out (23). Satisfactory repeatability results also have been reported (10,13,15).
CAD in Analytical Method Transfer
The process that establishes documented evidence that the analytical method works as well in the receiving laboratory as in the originator's laboratory, or the transferring laboratory, is called analytical method transfer (AMT). AMT is required for GMP "reportable data" from laboratory results (25–27). The goal of AMT is to ensure that the receiving laboratory is well trained, qualified to run the method in question, and gets the same results — within experimental error — as the initiating laboratory. The success of AMT depends upon the development and validation of robust methods and strict adherence to well documented standard operating procedures (SOPs).
The AMT process can proceed by any one of four options: comparative testing, complete or partial method validation or revalidation, co-validation between the two laboratories, or omission of a formal transfer, sometimes called a transfer waiver. The option chosen depends upon many factors, like the complexity of the method, or level of experience. In general, transferring methods that use CAD is really no different than transferring methods using any other type of HPLC detection system. The same experimental design and statistical treatment can be used, however it is a good idea to make sure that the receiving laboratory personnel has adequate training in CAD in advance of the transfer. In this respect, regardless of the AMT process option chosen, it is a good idea for the originating laboratory to share any experience gained in the development and validation of the method, particularly related to instrument configuration, nitrogen source, purity and flow, solvent source–purity, and temperature considerations, among other parameters.
CAD in Formulation Development and Ion Analysis
Formulation plays a critical role in the drug development process. The counterion chosen during formulation can have a significant impact on the bioavailability, manufacturability and stability of the potential drug candidate. A critical requirement of the formulation process is the development of an analytical procedure that separates and quantitates the counterions (anions and cations) involved in the drug formulation being developed. Counterion analysis requires the repeatability and robustness that will enable it to be transferred easily to other analytical laboratories where the quality of the active pharmaceutical ingredient (API) will be closely monitored.
New chemical entities (NCEs) are commonly either weak acids or weak bases with a low molecular weight. In the majority of cases the free acid or base does not provide sufficient aqueous solubility, and are also often lacking in solid state stability. These weaknesses can usually be overcome by pairing a basic or acidic drug molecule with a counterion to yield the salt form of the NCE. The properties of the counterion that is selected can have a major impact on the performance of the resulting drug, not to mention its safety and manufacturability. Salt selection was previously performed relatively late in the drug development process. However, there have been numerous occasions when the salt that was initially selected later proved to have problems, which made it necessary to repeat toxicology, biological, and stability studies. As a result, the salt selection process is now initiated typically early in the development process for ionizable compounds that pass initial toxicology screening (28).
Chemists frequently search for the optimal crystalline form in a linear manner, creating and analyzing one substance after another in the search for a salt with the right physicochemical properties. In some cases, integrated salt selection systems are used to enable crystallization, salt selection, and polymorph studies to be completed in a fraction of the time. The first screen for salt forms that are identified by these methods is to assess their crystallinity. A crystalline salt form is usually easier to handle, transport and use. The salt forms that are identified as crystalline during these screens are selected for further evaluation and require analysis to confirm their identity and stoichiometry.
The next step is to assess the salt form's hygroscopicity profile to ensure that it will maintain its properties under the sometimes humid conditions experienced in pharmaceutical manufacturing. Other screens that are performed at this stage of the process include solubility, stability, polymorphism, and processability. The ion analysis method selected for the formulation process also is used typically in downstream processes when the API is monitored to ensure its safety, quality, strength, and purity. The importance of counterion analysis helps to explain the considerable attention that has been devoted in recent years to developing ion analysis methods with the accuracy, precision and robustness to be transferred easily from one analytical laboratory to another.
Several alternatives for ion analysis are in use today. The most common method, ion chromatography (IC) with conductivity detection, uses weak ionic resins for its stationary phase and an additional suppressor column to remove background eluent ions. IC has proven to provide very sensitive detection of both anions and cations. However it uses relatively expensive nonstandard chromatography instruments and consumables and requires two runs with different columns to measure anions and cations. Lengthy changeover times or duplicate systems normally are required to measure both anions and cations. Capillary electrophoresis (CE) also has demonstrated a high level of sensitivity in ion analysis but also requires two columns, two mobile phases, and two runs to detect both anions and cations.
A new approach to ion analysis overcomes these difficulties. This approach is based upon hydrophilic interaction liquid chromatography (HILIC), which uses very polar stationary phases such as diol (neutral), silica (charged), amino (charged), or zwitterionic (charged) phases. The mobile phase is highly organic but contains a small amount of aqueous–polar solvent. This establishes a stagnant enriched water layer around the polar stationary phase allowing analytes to partition between the two phases based upon polarity. Water or a polar solvent is the strong eluting solvent. With zwitterionic columns and chromatographic conditions, the partition function between the two phases permits easier access for electrostatic interaction of anionic analytes to the positively charged group, enhancing anion retention. Using a zwitterionic stationary phase operating in the HILIC mode, the separation and quantitation of 33 commonly used pharmaceutical counter-ions, 12 cations, and 21 anions was reported (29). This work used ELSD; however CAD can better provide the high sensitivity, dynamic range, precision, and robustness desirable from a workhorse technique in these types of critical pharmaceutical applications. Diclofenac is a nonsteroidal anti-inflammatory drug (NSAID) taken to reduce inflammation and as an analgesic reducing pain in conditions such as arthritis or acute injury. Figure 2 illustrates how the HILIC–CAD method was used to analyze diclofenac and its sodium counterion in a single run.
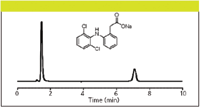
Figure 2: HILICâCAD analysis of API and counterion in a single run. Column: 150 mm à 4.6 mm, 5-μm particle Sequant ZIC-pHILIC (The Nest Group, Southborough, Massachusetts); mobile phase (isocratic): 75:25 acetonitrileâ100 mM ammonium acetate (pH 7.0); flow rate: 1.0 mL/min; temperature: 30 °C; injection volume: 10 μL. The early eluting peak is the API; the peak at approximately 7.5 minutes is the sodium counterion.
In addition to formulation analysis, the CAD also can be used for other types of ion analysis, such as API characterization and detection of ionic impurities. Figure 3 shows a further advantage of the HILIC–CAD combination; simultaneous analysis of several anions and cations in a single run, on a single system using one mobile phase, and one column. This method has been validated completely by determining linearity and range, accuracy, precision, specificity, and limits of detection and quantitation showing the utility of CAD in a regulated environment (30). A further example run under roughly the same conditions is presented in Figure 4 for the separation of some organic acids. Organic bases such as lysine and arginine also can be run under identical conditions. Good linearity and low nanogram on-column detection limits can be obtained in all cases.
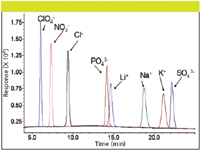
Figure 3: Simultaneous analysis of anions and cations using HILICâCAD. Column: 150 mm à 4.6 mm, 5-μm particle Sequant ZIC-pHILIC; mobile phase A: 15% 100 mM ammonium acetate (pH 4.68), 5% methanol, 20% isopropanol, 60% acetonitrile; mobile phase B: 50% 30 mM ammonium acetate (pH 4.68), 5% methanol, 20% isopropanol, 25% acetonitrile; gradient: 20â70% B over 26 min; flow rate: 0.5 mL/min; temperature: 30 °C; injection volume: 10 μL.
Carbohydrate Analysis by CAD
CAD response to a wide range of compounds has been explored (7,16). In our laboratories, there is increasing interest in analyzing compounds that do not have good UV chromophores, from complex (polyethylene glycol polymers, oligosaccharides, cyclodextrins, lipids) to more simple compounds (for example, sugars). One particular area of our focus is the analysis of sugars from fermentation broths.
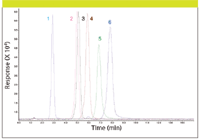
Figure 4: CAD HILIC analyses of organic acids. Column: 150 mm à 4.6 mm, 5-μm particle Sequant ZIC-pHILIC; mobile phase (isocratic): 70:30 acetonitrileâ200 mM ammonium acetate (pH 6.7); flow rate: 1.0 mL/min; temperature: 30 °C; injection volume: 10 μL. Peaks: 1 = maleic acid, 2 = glutaric acid, 3 = succinic acid, 4 = fumaric acid, 5 = oxalic acid, 6 = citric acid.
In many companies, the development and production of proteins, peptides, or antibodies through recombinant DNA technology is becoming increasingly important as new generations of therapeutics are based upon these types of biomolecules. However, direct assays to assess both the nutrients supporting the cells in the fermentation broth and measurements of the proteins or peptides themselves can be problematic to perform, especially if real time measurements are needed. Good, rapid analytical tools and assays are lacking to accurately measure many of the nutritional components of fermentation broths (for example, sugars, amino acids, and salts) as well as the levels of proteins themselves.
As assays for these nutrients and proteins are time consuming, many researchers are forced to default to using simple glucose–lactic acid measurements as a substitute for a real assessment of the metabolic state and protein production levels of their cells. Measurement of typical components of a fermentation broth can often involve very lengthy and complex techniques. For example, sugars are often analyzed by pulsed amperometric electrochemical detection coupled to HPLC. CAD also has been used for such analytes.
Figure 5 highlights an overlay of five injections of a separation of four simple sugars often found in fermentation broth analyses. Amino acids and peptides from the same sample matrices also can be analyzed using standard reversed-phase HPLC with CAD (31). We are also investigating the use of CAD for the analysis of sugars from glycopeptide and protein analysis.
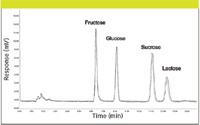
Figure 5: Analysis of fermentation broth sugars by HPLCâCAD. Column: 250 mm à 4.6 mm, 5-μm particle Shodex Asahipak NH2P-50; mobile phase (isocratic): 25:75 waterâacetonitrile; flow rate: 1.0 mL/min; temperature: 35 °C.
CAD in Stability Analyses
As mentioned previously, applications of CAD have included monitoring stability (15). Often a precursor to a formal stability study is a forced degradation or chemical stress study (32,33). A forced degradation study is undertaken to understand the reactive chemistry of the drug substance, and to help anticipate future stability issues of both drug substance and drug product, and also can provide useful information for formulation development. Forced degradation studies are also often required for various regulatory submissions. In addition, they can be used to demonstrate specificity when developing stability indicating methods (SIMs) and to actually generate a sample that can be used for method development in support of the stability study. Some typical conditions that might be used include extremes of acid and base pH, oxidation, heat, hydrolysis, and light. A SIM is a validated method that can accurately and precisely quantitate the decrease of the API content due to degradation. It is specific for the drug substance, shows a decrease in assay value (correlated to drug substance loss) due to degradation, has no interference from excipients, impurities or degradation products, and also might detect and quantitate impurities and degradation products of the target compound. For validation, SIMs fall into USP Category 2; methods for the quantitation of impurities or degradation products (19). For a Category 2 method, a complete list of analytical performance parameters that should be investigated include specificity, linearity and range, accuracy, precision, LOQ, and robustness.
Peptide therapeutics are an interesting case study for the use of CAD in the stability laboratory. Peptides themselves can often be detected readily by UV or MS detection, but their degradation products, or impurities, are potentially smaller peptides or amino acids that in many cases do not possess UV chromophores. (This fact leads us to ask what might we be missing in our other stability studies?) One example of work in progress in our laboratories is to look at a peptide called adrenocorticotropic hormone fragment 4–10 in a several ways. We chose this peptide because it is a good example representative of some of the proprietary peptide drugs we have analyzed previously, it is readily available commercially, and is not too expensive. It consists of seven distinct amino acids and it has been studied therapeutically for memory improvement.
This peptide can be used as a good example of how CAD can be used during a stability study, to detect degradants or impurities that don't have UV chromophores, and as a way to look at amino acid composition as a QC tool. The advantage in using CAD for this application is that the potential amino acid degradants and the peptide composition can be analyzed without any derivatization in a single simple reversed-phase HPLC system.
Figure 6 illustrates the analysis of a pure reference standard of the adrenocorticotropic hormone fragment 4-10 peptide, by both UV (PDA) detection and CAD. The PDA detector was run in series before the CAD system; the signal-to-noise ratio is higher on the CAD system versus the UV detector even at this low UV wavelength where the peptide bond absorbs strongly. We have obtained CAD sensitivity for peptides down to the low nanogram level, enough sensitivity to pick up potential impurities and degradants, particularly as the response to these analytes will be independent of their physical–chemical characteristics.
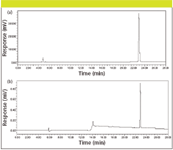
Figure 6: Analysis of adrenocorticotropic hormone fragment 4â10 peptide standard by UVâPDA and CAD. Column: 250 mm à 4.6 mm, 5-μm particle C18; mobile phase A: 0.1% trifluoroacetic acid in water; mobile phase B: acetonitrile; gradient: 5 min hold at 100% A, then a linear 0â40% B gradient over 20 min; flow rate: 0.6 mL/min; injection: 10 μL of a 1 mg/mL sample concentration in mobile phase A.
To fully test the sensitivity hypothesis, the reversed-phase HPLC separation of all of the amino acids present in the peptide, underivatized, using the same conditions used for the intact peptide analysis, again with both UV–PDA detection and CAD, is shown in Figure 7. Although not shown in this chromatogram, the parent peptide also is well resolved from all of the amino acids. As can be seen, some of the amino acids respond well to UV detection, however others without chromophores do not. Also, note that the CAD response is roughly equivalent, although some of the later eluted amino acids benefit from the organic rich mobile phase environment. This separation, as well as the peptide separation, are being evaluated in an ongoing forced degradation study, to determine if the method is stability indicating and can be used in support of stability studies. This method also can, of course, be used as a QC tool to analyze amino acid composition following hydrolysis using the same conditions, without the need for complex and time consuming derivatization processes.
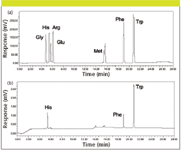
Figure 7: Analysis of amino acids of adrenocorticotropic hormone fragment 4-10 peptide standard by UV/PDA and CAD. Conditions identical to those listed in Figure 6.
Conclusion
The use of CAD can provide significant advantages to analysts in both the research and regulated pharmaceutical laboratory when compared to more traditional technology, such as UV, RI, or ELSD. CAD provides universal detection of nonvolatile analytes with a response independent of chemical properties, a wide dynamic range, high sensitivity and good precision. These characteristics, along with reliability and its ease of use, make this a superior detection method for a wide range of HPLC analyses throughout the drug development process.
Michael Swartz, Mark Emanuele, Amber Awad, and Deborah Hartley
Synomics Pharma Services, Wareham, Massachusetts
Please direct correspondence to mswartz@synomicspharma.com
References
(1) ESA Inc., Chelmsford, MA. www.esainc.com
(2) R.W. Dixon and D.S. Peterson, Anal. Chem. 74, 2930–2937 (2002).
(3) B.Y.H. Liu, and D.Y.H Pul, J. Aerosol Sci. 6, 249–250 (1975).
(4) A. Medved, F. Dorman, S.L. Kaufman, and A. Pocher, J. Aerosol Sci. 31 (Supplement 1), S616-S617 (2000).
(5) R.C. Flanagan, Aerosol Science Technol., 28 (1998).
(6) A.J. Alpert, J. Chromatogr. 499, 177-196 (1990).
(7) J. Reilly, B. Everatt, and C. Aldcroft, J. Liq. Chrom. and Rel'd. Tech., 31, 3132–3142 (2008).
(8) C. Schonherr, S. Touchene, G. Wilser, R. Peshka-Suss, and G. Francese, J. Chrom., A 1216, 781–786 (2009).
(9) M. Lisa, F. Lynen, M. Holcapek, and P. Sandra, J. Chrom., A 1176, 135–142 (2007).
(10) P. Sun, X. Wang, L. Alquier, and C.A. Maryanoff, J. Chrom., A, 1177, 87–91 (2008).
(11) D. Asa, Genetic Engineering News, 25(19), 33–34 (2005).
(12) B. Forsatz and N.H. Snow, LCGC 25(9), 960–968 (2007).
(13) L. Novakova, S.A. Lopex, D. Solichova, D. Satinsky, B. Kulichova, A. Horna, and P. Solich, Talanta, in press. (2009).
(14) R.A. Moreau, Lipids, 41, 727–734 (2006).
(15) X-K. Liu, J.B. Fang, N. Cauchon, and P. Zhou, J. Pharm. Biomed. Anal. 46, 639–644 (2008).
(16) P.H. Gamache, R.D. McCarthy, S.M. Freeto, D.J. Asa, M.J. Woodcock, K. Laws, and R.O. Cole, LCGC Europe 18(6), 345–354 (2005).
(17) T. Teutenberg, J. Tuerka, M. Holzhausera, and T.K. Kiffmeyera, J. Chrom., A 1119, 197–201 (2006).
(18) ESA Application #70-7918, www.esainc.com.
(19) Chapter 1225, United States Pharmacopeia No. 31-NF 26, (2008).
(20) Harmonized Tripartite Guideline, Validation of Analytical Procedures, Text and Methodology, Q2 (R1), International Conference on Harmonization, (November 2005), http://www.ich.org/LOB/media/MEDIA417.pdf.
(21) M. Swartz and I. Krull, LCGC Validation Viewpoint Columns; see http://chromatographyonline.findanalytichem.com/columns
(22) Chapter 621, United States Pharmacopeia No. 31-NF 26, (2008).
(23) M.E. Swartz, M. Emanuele, and A. Awad, unpublished results.
(24) Harmonized Tripartite Guideline, Impurities in new Drug Substances/Products, Q3A (R2)/Q3B (R2), See: http://www.ich.org/cache/compo/276-254-1.html.
(25) U.S. FDA. Current Good Manufacturing Practice in Manufacturing, Processing, Packing, or Holding of Drugs: General; 21 CFR, Part 210.
(26) U.S. FDA. Current Good Manufacturing Practice for Finished Pharmaceuticals; 21 CFR, Part 211.
(27) ISPE Good Practice Guide: Technology Transfer, March, 2003.
(28) L. Kumar, A. Amin, and A. Bansal, Pharm. Technol., March 2, 2008.
(29) D.S. Risley and B.W. Pack, LCGC 24(8), 776–785 (2006).
(30) C. Crafts, N. Santiago, J. Gray, M. Plante, and I. Acworth, Poster No. 2730-26, Pittsburgh Conference on Analytical Chemistry and Applied Spectroscopy, Chicago, Illinois, March 2009.
(31) M. Swartz and M. Emanuele, unpublished results.
(32) Pharmaceutical Stress Testing, Predicting Drug Degradation, Drugs and the Pharmaceutical Sciences, Volume 153, S.W. Baertschi, editor, Informa Healthcare Publishers, New York (2007).
(33) M.E. Swartz and I.S. Krull, LCGC 23(6), 586–593 (2005).

Polysorbate Quantification and Degradation Analysis via LC and Charged Aerosol Detection
April 9th 2025Scientists from ThermoFisher Scientific published a review article in the Journal of Chromatography A that provided an overview of HPLC analysis using charged aerosol detection can help with polysorbate quantification.
Removing Double-Stranded RNA Impurities Using Chromatography
April 8th 2025Researchers from Agency for Science, Technology and Research in Singapore recently published a review article exploring how chromatography can be used to remove double-stranded RNA impurities during mRNA therapeutics production.


