Effects of Water on Adsorbents in Porous Layer Open Tubular (PLOT) Column Gas Chromatography (GC)
The best option for the gas chromatographic (GC) analysis of highly volatile analytes without cryogenic cooling is to use solid adsorbents. Open tubular GC columns with a deposited layer of solid adsorbent on the inside are known as porous layer open tubular (PLOT) columns. Adsorbents like molecular sieves, alumina, porous polymers, and even carbon materials are essential when analyzing light gases. Most gas samples contain water; although we are not interested in the amount of moisture that is present in the sample, water is injected onto the column unless a drying step of the sample is utilized. This article reviews the effects of water on retention and selectivity in gas–solid chromatography of various adsorbent PLOT columns.
Activated alumina has been studied as a chromatographic material for over 70 years. The high surface area of this porous material showed promise in separating C1–C5 hydrocarbons. Because of the extreme activity, tailing, and inconsistent responses of alumina, the material was at first considered almost unusable. In the mid-1950s, alumina oxides were deactivated with water vapor. This new approach drastically improved peak shape and provided consistent compound responses. However, water-deactivated alumina columns could be used only under isothermal conditions. The next significant improvement for porous alumina columns occurred in the 1970s when more stable deactivations with inorganic salts, such as potassium chloride (KCl), sodium sulfate (Na2SO4), and various proprietary salts, were implemented (1–3).
Even though the industry moved away from alumina-packed columns in favor of alumina-based porous layer open tubular (PLOT) columns, alumina columns remained a reliable choice for analyzing C1–C5 hydrocarbons. One thing has not changed since the 1950s—we still have problems with chromatography in the presence of moisture. To better understand the problematic effects of water on alumina columns, we studied the chromatographic behavior of C1–C5 hydrocarbons. Various selectivities of alumina deactivated PLOT columns were tested under the same isothermal chromatographic conditions. The analysis was performed again after injecting 0.1 μL of water onto the column, and the procedure was repeated five times.
Regardless of the column deactivation, the introduction of water onto the alumina PLOT column changes the retention time by accelerating the elution of the analytes. Water will act as a deactivating agent, meaning that the adsorption sites where water molecules are adsorbed will not be available for hydrocarbon retention. This process results in a decrease in retention time. Figures 1 and 2 show examples of the analysis of those two analytes, alumina MAPD (Figure 1) and alumina potassium chloride (Figure 2), as well as the analysis of the columns after exposing them to 0.5 μL of water in increments of 0.1 μL. Not only do we notice shifting retention times, but we also see changes in resolution, indicating that the polarity of the column has changed.
FIGURE 1: Comparison of the analysis of C1–C5 hydrocarbons on alumina MAPD deactivated column, 30 m x 0.32 mm x 5 μm, (a) chromatogram is the original analysis and (b) chromatogram after treating the column with 0.5 μL of water. Analysis conditions: carrier gas: helium at 5 mL/min, oven: 110 °C isothermal (x-axis is time in minutes, and y-axis is detector response).
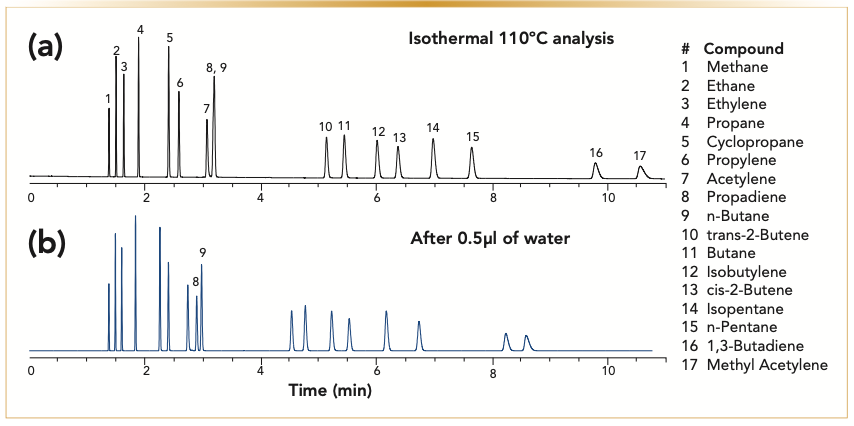
FIGURE 2: Comparison of analysis of C1–C5 hydrocarbons on a nonpolar alumina potassium chloride deactivated column, 30 m x 0.32 mm x 5 μm, (a) chromatogram is the original analysis and (b) chromatogram is after treating the column with 0.5 μL of water. Analysis conditions: carrier gas: helium at 5 mL/min, oven: 110 °C isothermal. (x-axis is time in minutes, and y-axis is the detector response).
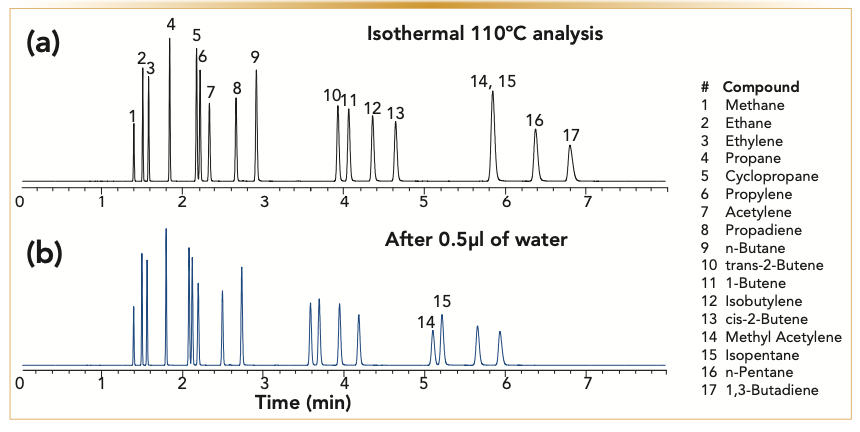
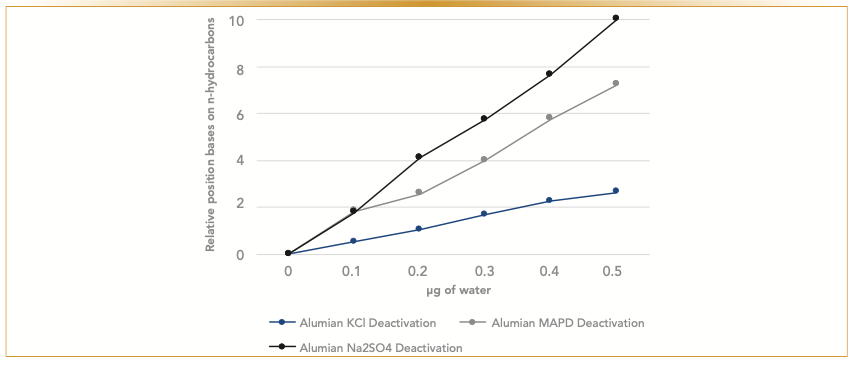
Regardless of whether the column was deactivated with proprietary deactivation, MAPD, or potassium chloride, exposure to water decreases retention time and impacts the resolution of the compounds. The introduction of any moisture to the column would further deactivate aluminum oxide, making the column less polar, which changes the column selectivity. The plotted deviation of retention indices of the analytes, which is based on the retention of adjacent n-hydrocarbons, confirms our observation. The analytes most affected by the moisture treatment over time are polar analytes—acetylene, propadiene, and methyl acetylene—that show more significant shifts in retention than the butanes and butenes (Figure 3). Similarly, the impact of moisture is more dramatic on a polar column, such as a sodium sulfate alumina column. Figure 4 illustrates changes in relative retention of acetylene on different types of deactivated alumina columns. The polarity of a sodium sulfate-deactivated alumina column declines considerably faster than a potassium chloride-deactivated alumina column. The potassium chloride-deactivated alumina has the lowest polarity, and it is the least sensitive to water.
FIGURE 3: Relative behavior of analytes with the addition of water by monitoring deviation of retention indices of individual analyte on methyl acetylene and propadiene (MAPD) deactivated column.
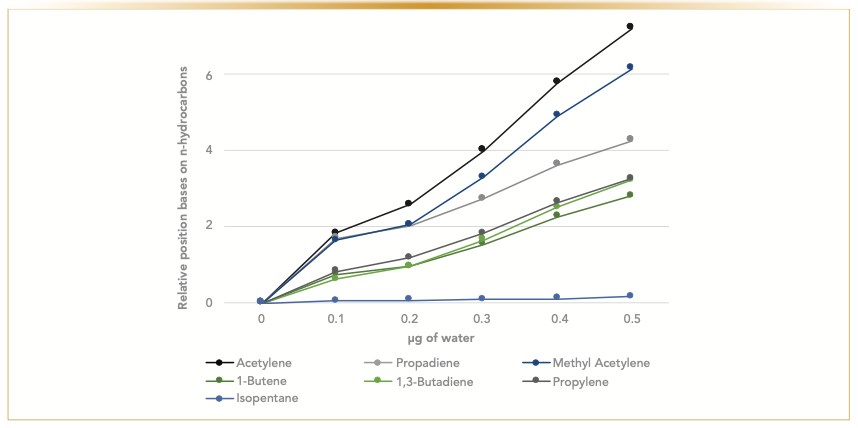
FIGURE 4: Behavior of acetylene. Comparison of changes of normalized retention after water treatment for all three deactivated columns. Water has the largest effect on a polar sodium sulfate deactivated column, followed by the methyl acetylene and propadiene (MAPD) deactivated column. The least affected is retention of acetylene on a potassium chloride deactivated column.
Water will not damage the alumina column. The column can always be regenerated by conditioning it at the maximum temperature of the column.
Molecular Sieve 5A
Molecular sieves 5A (MSieve 5A) are zeolites, which are part of the family of aluminosilicate minerals. They are strong adsorbents with an unique, tunnel-like crystalline structure and a well-defined pore size. These strong adsorption properties make them ideal for analyzing permanent gases. The analytes separate on molecular sieves based on two mechanisms: First, how well the molecules fit into the material’s pores, a separation based on the size of the molecules; and second, the physical interactions between the molecules and the MSieve 5A crystal, which is a separation that takes place based on the polarity. For example, nitrogen and oxygen are both small enough to fit in the pores of the 5A mineral, but oxygen, a smaller molecule than nitrogen, will navigate through the “tunnels” faster because it has less interactions with the pore surface and elutes from the column before nitrogen. In the case of carbon monoxide, dipole interactions play a more important role, and the MSieve 5A strongly retains these molecules. A bigger molecule, like sulfur hexafluoride (SF6), will not be able to enter the pores of the zeolite. It will only be retained by the outside, free-accessible surface area. The same phenomena is observed with isoalkanes. Isobutane, for example, would be eluted around nitrogen at 40 °C, while n-butane (which can fit in the pores because of the linear structure), needs a very high temperature to be eluted (4,5).
Adsorption on molecular sieves is reversible, and the adsorption–desorption process is easily regulated with temperature. Molecular sieves are generally used as drying agents, and we know that we cannot analyze water using the MSieve 5A columns because of the high temperature required to desorb water from the molecular sieve pores. Our study on the effects of water on molecular sieves showed that the MSieve 5A has a relatively high tolerance to moisture in comparison to salt-deactivated alumina columns. A MSieve 5A PLOT column, with the dimensions of 30 m x 0.53 mm x 50 μm, was tested using a mixture of permanent gases at 40 °C. Afterward, water was injected onto the column at 100 °C isothermal. Column behavior was monitored by repeating the analysis of permanent gases at 40 °C. Figure 5 demonstrates a chromatogram of the initial analysis of permanent gases, black overlay, and blue overlay is a chromatogram after exposing the molecular sieves to water. The column had to be treated with 1 μL of water to see a notable shift in the retention time of the polar compound, which in this case is carbon monoxide.
FIGURE 5: Chromatogram overlay of the analysis of permanent gases at 40 °C isothermal. The black overlay is the starting analysis, and the blue overlay is the analysis after exposing the MSieve 5A (30 m x 0.53 m x 50 μm) column to 1 μL of water. Peak identification is in order of elution: argon, oxygen, nitrogen, methane, and carbon monoxide. The retention time of carbon monoxide shifts after the column is treated with water. Analysis conditions are as follows: carrier gas, helium at 5 mL/min; and oven, 40 °C isothermal. (x-axis is the time in minutes, and y-axis is the detector response).
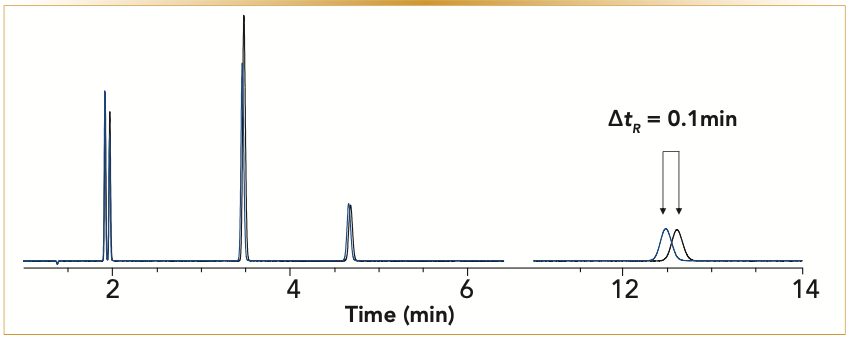
Although 1 μL of water may seem like a small amount, the quantity is more significant when we look at it from a different angle. For example, if the gas sample has 50% relative humidity, with every 1 mL injection of gas, we are injecting ~0.01 μL of water onto the column. To see a slight shift of the carbon monoxide peak, we would need to make hundreds of injections.
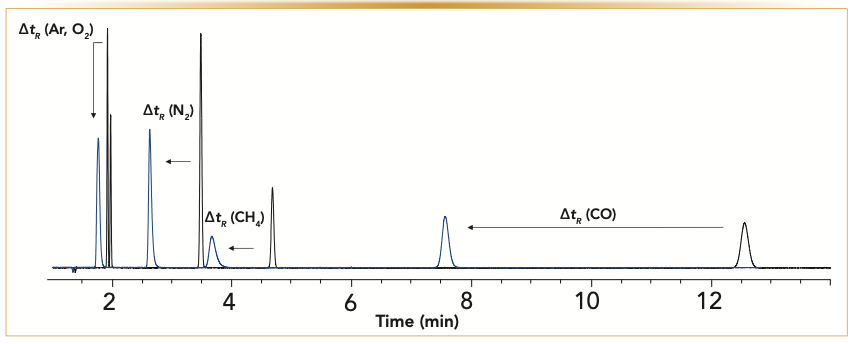
Continued exposure of water to a MSieves 5A column will pack the adsorption sites with water. Figure 6 illustrates the changes in chromatography when the molecular sieves are treated with 50 μL of water at 100 °C. Retention times for all the analytes decrease, and some will be coeluted. When the peaks start to tail (Figure 6, blue overlay), that is an indicator that the column has reached its loading capacity partially because of the adsorbent sites being occupied with water.
FIGURE 6: The overlay of the initial chromatogram of the analysis of permanent gases is in black, and the chromatogram after 50 μL of water was injected onto the column is in blue. Continued exposure of the MSieves 5A column to water will over time load the adsorption sites with water. Analysis conditions: carrier gas, helium at 5 mL/min; oven, 40 °C isothermal. (x-axis is the time in minutes, and y-axis is the detector response).
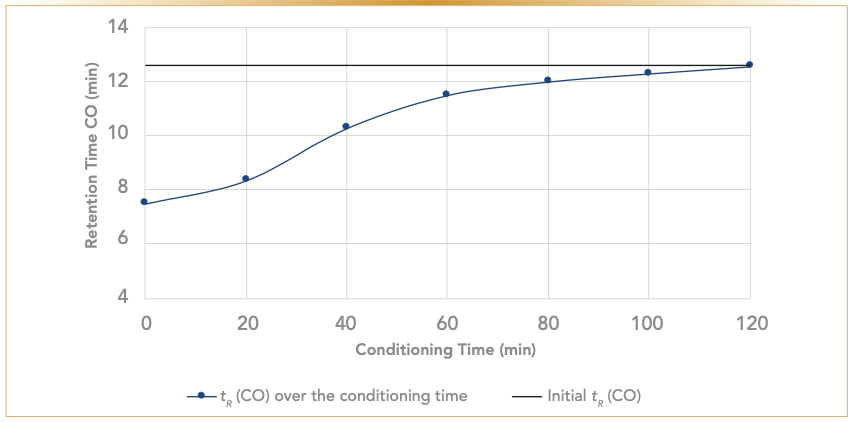
The temperature necessary to desorb the water from the 5A molecular sieves is lower than the maximum temperature of the PLOT column. Therefore, water can be removed from the column. By conditioning the column at the maximum temperature of 300 °C, moisture is removed and initial performance is restored (Figure 7).
FIGURE 7: Graph of desorption process relative to the retention time (tR) of the carbon monoxide (CO). The blue line is the original retention time, and the black line is the retention factor of CO over the conditioning time. Conditioning temperature is 300 °C.
Porous Polymer PLOT Columns
Porous polymer PLOT columns are based on styrene-divinylbenzene (DVB-styrene) cross-linked polymers. They come in a range of polarities. For example, Q PLOT columns are made with 100% DVB-styrene polymers and are nonpolar. On the other hand, DVB-ethylene glycol dimethyl acrylate PLOT columns, also referred to as U PLOTs, are highly polar (2,4).
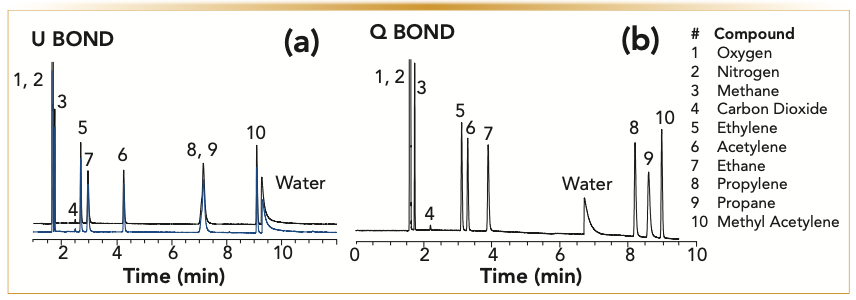
Porous polymer PLOT columns are extremely versatile. They can separate a wide polarity range of molecules from gases to semi-volatiles. The main advantage of porous polymers is their hydrophobicity. Treating a column with large, continuous water injections does not have any effect on the adsorbent. Water elutes from the column very fast as a chromatographic peak and does not change the selectivity of the column because of adsorption (Figure 8). This means there is no need to condition heat porous polymer columns to drive the water off, which reduces the downtime between injections.
FIGURE 8: (a) U BOND: Overlay of analysis of permanent and hydrocarbon gases on a 30 m x 0.53 mm x 20 μm U BOND column before (black overlay) and after treating the column with 20 μL of water (blue overlay). Water elutes from the column as a chromatographic peak and does not change the column polarity. (b) Q BOND: Chromatogram of analysis of hydrocarbon gases with water using 30 m x 0.53 mm x 20 μm Q BOND. Depending on the polarity of the polymer water will be more or less adsorbed and elution time will change accordingly. Analysis conditions: Carrier gas, helium at 5mL/min; and oven, 40 °C (3 min) then 10 °C/min to 190 °C. (x-axis is the time in minutes, and y-axis is the detector response).
Conclusion and Final Tips
Although we deliberately exposed our columns to aliquots of water to illustrate the effect of water on adsorbent PLOT columns, systems with alumina and MSieves 5A PLOTs should be protected to keep water from causing slow but continuous deactivation and changes in column selectivity. To conclude this column, here are a few tips to keep in mind to prevent water from further affecting your chromatography or to regenerate your column if it has already been exposed to moisture:
1. If the moisture has already accumulated in the column, sodium sulfate-, potassium chloride-, or MAPD-deactivated alumina PLOT columns as well as MSieves 5A columns can be regenerated by conditioning the column at their maximum temperature.
2. Increasing the final temperature of the analysis to the maximum temperature of the column for 5–10 min will desorb the water during each analysis cycle.
3. However, it is always better to avoid water getting into the alumina column. By using a thick film, polar precolumn with a column-switching device, water and other impurities in the sample are backflushed and never enter the analytical column.
4. Gas samples can be dried using Nafion dryers, salt filters, cryogenic trapping, and preconcentrators. Water and other impurities in the sample are backflushed and never enter the column.
References
(1) L.R. Snyder and E.R. Fett, J. Chromatog., 18, 461–476 (1965).
(2) R.E. Majors and J. de Zeeuw, LCGC N. Am. 28(10), 848–864 (2010).
(3) Z. Ji, R. Major, and E. Guthrie, J. Chromatogr. A. 842, 115 (1999).
(4) Colin Poole, Gas Chromatography, 2nd Edition (Wiley, New York, 2021).
(5) V.G. Berezkin and J. de Zeeuw, Capillary gas adsorption chromatography (Chromatographic methods) (Wiley, New York, 1996).
ABOUT THE CO-AUTHORS
Katarina Oden is an application chemist at Restek Corporation in Bellefonte, Pennsylvania.

Jaap de Zeeuw is the International Specialist Gas Chromatography at Restek Corporation in the Netherlands.

ABOUT THE AUTHOR
David S. Bell is a director of Research and Development at Restek. He also serves on the Editorial Advisory Board for LCGC and is the Editor for “Column Watch.” Over the past 20 years, he has worked directly in the chromatography industry, focusing his efforts on the design, development, and application of chromatographic stationary phases to advance gas chromatography, liquid chromatography, and related hyphenated techniques. His main objectives have been to create and promote novel separation technologies and to conduct research on molecular interactions that contribute to retention and selectivity in an array of chromatographic processes. His research results have been presented in symposia worldwide, and have resulted in numerous peer-reviewed journal and trade magazine articles. Direct correspondence to: LCGCedit@mmhgroup.com


University of Rouen-Normandy Scientists Explore Eco-Friendly Sampling Approach for GC-HRMS
April 17th 2025Root exudates—substances secreted by living plant roots—are challenging to sample, as they are typically extracted using artificial devices and can vary widely in both quantity and composition across plant species.
Sorbonne Researchers Develop Miniaturized GC Detector for VOC Analysis
April 16th 2025A team of scientists from the Paris university developed and optimized MAVERIC, a miniaturized and autonomous gas chromatography (GC) system coupled to a nano-gravimetric detector (NGD) based on a NEMS (nano-electromechanical-system) resonator.
Miniaturized GC–MS Method for BVOC Analysis of Spanish Trees
April 16th 2025University of Valladolid scientists used a miniaturized method for analyzing biogenic volatile organic compounds (BVOCs) emitted by tree species, using headspace solid-phase microextraction coupled with gas chromatography and quadrupole time-of-flight mass spectrometry (HS-SPME-GC–QTOF-MS) has been developed.


