Development of a Miniature Gas Chromatograph (µCAD) with Sample Enrichment, Programmed Temperature GC and Plasma Emission Detection (PED)
LCGC Europe
A miniature gas chromatograph incorporating a miniaturized chemical trap for enrichment, rapid thermal desorption of the trap, a resistively heated capillary column for programmed GC analysis and a micro-chip-based plasma emission detector (PED) is described. The sampling and chromatographic conditions for the analysis of volatile compounds in air are presented. The performance of the µCAD is illustrated in the universal (carbon) mode and for the selective detection of chlorinated and organo-mercury compounds. Detection limits (DLs) are at the sub-μg/L level in the carbon mode and 10 ng/L for organo-mercury compounds.
There are two main types of field portable instruments for monitoring chemicals in air samples. The first type includes (hand) portable systems based on sensors or selective detectors where no chromatographic separation is involved.1 These instruments are generally used in cases where the target application is well defined (e.g., one compound or a class of compounds). The second type is basically a scaled-down bench top system and can incorporate sample enrichment, chromatographic separation and universal or selective detection. Some commercial devices are equipped with (mass) selective detection and this improves the versatility of these instruments.2–4
These latter systems, however, often require additional parts (external power sources, gas supplies, etc.) limiting their portability. Scaling down a system to a portable size requires the implementation of new technologies in hardware components (column, pneumatics) and in micro-electronics for system control. Ultimately, chromatography is performed at the scale of microchips (micro-electro-mechanical systems, MEMS)5–7 although this level of miniaturization has not been implemented in practice.
This paper describes the construction and optimization of a recently introduced micro-GC (micro-chemicals in air detector, µCAD) for the analysis of air and gaseous samples.8 The system consists of built-in air pump and a miniature programmable chemical trap, a programmable resistively heated capillary column and a novel micro-chip plasma emission detector (μPED). The components are based on established technologies in benchtop systems that are now combined in a portable standalone unit. The hardware configuration, the sampling conditions and the chromatographic settings were optimized for the analysis of volatile compounds in air.
Experimental
Micro-GC: The micro-GC (μCAD) was developed for the analysis of air samples and it contains a micro pump that aspirates the air sample over a miniature chemical trap. In a second step, helium is purged through the trap in back-flush mode and sent through the capillary column. The temperature of the capillary column can be programmed. Finally, the solutes are detected by a newly developed μPED. A detailed flow scheme can be found in reference 8. The system is built in a metal casing of 250 mm x 200 mm x 150 mm (width x depth x height) and weighs 5 kg. The system is powered by a 24 VDC power adapter (150 W). Figure 1 shows the system with the cover open and the different parts labelled.
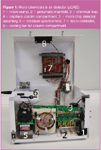
Figure 1
All sampling and chromatographic parameters are programmed through the microcontroller via a keypad build in the top cover. A laptop is connected through a USB connection onto the spectrometer to collect the spectroscopic data (not shown). The system also includes a gas cylinder (Figure 2, 1) that is connected to a dual-stage pressure release valve (2). The gas cylinder is filled up with helium (N6.0 quality, Air Products, Vilvoorde, Belgium) up to 124 bar and provides 18 L of expanded gas (@ 5 mL/min = 60 h of operation). A manual three-way valve (3) allows connection onto an external gas supply. The helium pressure is finally controlled by a proportional valve in the manifold. Three additional solenoid valves are programmed to set the flow paths during sampling, thermal desorption and chromatographic analysis.
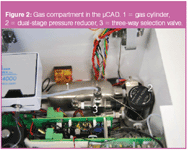
Figure 2
The chemical trap consists of a small quartz tube (50 mm x 1.5 mm i.d.) filled with trapping material. The quantity of this material is limited to 20–30 mg and it is fixed between two small plugs of deactivated glass wool. Two types of trapping phase were used in this work: Tenax TA and Carbotrap B (Figure 3). The trap is mounted between two low dead-volume Tee connectors [Figure 4(a), 1 and 2] using graphite ferrules. The connectors are constructed so that the sample does not come in contact with this graphite. The sample is aspirated from the entrance at the right side [Figure 4(a), 3], through a small pathway of the manifold to the connecter 1 (sampling from left to right).
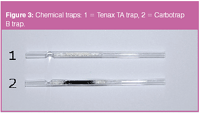
Figure 3
The whole flow path consists of Silcosteel-treated tubing (Restek, Bellefonte, Pennsylvania, USA). A parallel flow entrance and path is available to analyse calibration air standards [Figure 4(a), 4]. After sampling, the trap is purged with helium in the backflush mode (right to left) and after an equilibration time (approximately 30 s), the trap is heated at a speed of 1000 °C/min to 200 °C, 250 °C or 300 °C for thermal desorption. The final trap temperature is held for 10–180 s.

Figure 4
The column, typically 5 m long x 250 μm i.d. [360 μm o.d.; Figure 4(a), 5], is inserted into a newly developed heating jacket. The jacket consists of polyimide tubing (0.5 mm i.d.) on which a heating wire is densely braid [Figure 4(b)]. On top of the metal wire, a second polyimide layer is coated and this provides electrical isolation. The chromatographic column is easily inserted while keeping the heating jacket tubing straight. A column of 5 m is then wound up in a coil with a diameter of 50 mm. Electrical contacts are connected onto the metal braid with a 1 metre interval and the jacket is heated by applying electrical current. The temperature is sensed with a miniature temperature sensor that is glued onto the outside of the heating jacket and the temperature is controlled by the built-in microprocessor. The column temperature can be programmed from 30–200 °C at a rate between 1–100 °C/min (limited by the power supply). The heating jacket is reusable because the capillary column can be taken out and replaced by a new one.
The μPED consists of a fused-silica chip of 10 mm x 15 mm x 2.2 mm (Figure 5). The principle of the detector is based on the generation of a helium glow discharge between two electrodes.8–12 Platinum wires (100 μm o.d., Goodfellow, Huntington, UK) are, therefore, placed in two channels (Figure 5, 1 and 2) connected to the discharge channel (Figure 5, 3) and glued in with heat resistant UV-curing epoxy glue (Dymax 4-20586, Dymax, Frankfurt a.M., Germany).8 A short transfer capillary (20 mm x 250 μm i.d. is glued into the entrance channel (Figure 5, 4) and this capillary is then coupled onto the outlet of the chromatographic column via a deactivated stainless steel union (Ultimate union, Agilent Technolgies, Figure 6, 1). The carrier gas for the chromatographic separation is used as plasma gas and no auxiliary gases are added to the plasma chip. The microchip is installed into a custom-made cartridge (Figure 6, 2) and this cartridge is connected onto a power board assembly (Figure 6, 3).8 The power supply (EMCO, Sutter Creek, California, USA, Figure 6, 4) delivers 1 kV DC and this generates a micro-plasma in the discharge channel. An optic fibre (P40-2, UV/vis 200 μm i.d., Ocean Optics, Duiven, The Netherlands) is mounted on top of the chip via a SMA906 optic connector on the cartridge (Figure 6, 5). The optic fibre is further connected onto a miniature optic spectrometer (89 mm x 63 mm x 34 mm) equipped with a 3548-element linear silicon CCD-array detector (Figure 6, 6, USB4000, Ocean Optics).
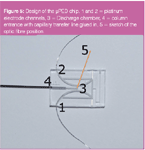
Figure 5
The spectrometer has a entrance aperture of 50 μm and it is configured for a maximum sensitivity at 400 nm (grating type #H2). The miniature spectrometer is connected onto a laptop through an USB cable and the emitted spectrum between 200 and 800 nm is captured with dedicated software (OOIBase32, Ocean Optics). Up to six single wavelengths can be measured as a function of time and these signals are imported into the Agilent Chemstation chromatographic software (version B.03.02, Agilent Technolgies, Litlle Falls, Delaware, USA) using an integrated programme.

Figure 6
Micro-GC conditions
For the analysis of BTEX in air, the following conditions are set, unless described otherwise: sampling is performed at 200 mL/min during 30 s (100 mL sample volume) and thermal desorption is done at 200 °C (40 s). The head pressure is set at 66 kPa (helium, 5 mL/min at 30 °C) and the column temperature is at a constant temperature of 30 °C. For the analysis of less volatile compounds, the column temperature is programmed from 35 °C (3 min) to 150 °C at a rate of 10 °C/min. The spectrometer was configured to record the C-signal at 558 nm (C2 band), the Cl-band at 837 nm and the Hg-band at 254 nm. The chromatographic data were imported in the Chemstation software (Agilent Technologies) for interpretation and quantification.
Results and Discussion
The μCAD contains a "classical" capillary column that is resistively heated with a newly developed polyimide heating jacket. The concept of resistively heating a capillary column is not new and in most cases the heating wire is braid directly onto the capillary column. This concept is commercially available and is known as "low thermal mass" technology (LTM, Agilent Technologies).13 In our approach, the capillary column is slipped into a polyimide-based heating jacket and it can easily be replaced whenever necessary. The column heat transfer and uniformity was verified with a 5 m x 250 μm i.d., 1 μm df HP1 (Agilent Technologies) column installed. First, the temperature variation was measured at eight randomly chosen positions of the coils and the temperature did not differ more than 1.8 °C (at 70 °C). This was only accomplished after installing electrical contacts every metre. Increasing this distance induced a negative Thomson effect (i.e., lower temperature at the anode and higher temperature at the cathode).
Secondly, the column heating was compared with a heated air oven. The column was, therefore, coupled between a split injector and a flame ionization detector (FID) into a standard gas chromatograph.
The column was set at 70 °C, either by the oven or by the heating jacket. A 2 μL gas sample from the headspace of a B, T, E, m-X, p-X, o-X mixture (16.7% each) in a 2 mL vial (BTEX stock solution) was split injected (split ratio 1:100). The head pressure was set to 25 kPa, giving a column flow of 1.3 mL/min (helium). The retention times of the most volatile benzene and least volatile o-xylene in the oven-heated column are 0.504 min and 2.78 min, respectively, while these are 0.504 min (benzene) and 2.80 min (o-xylene) for the resistively heated column. A similar experiment was performed for a column temperature programme from 50–150 °C at a rate of 10 °C/min. The retention times did not differ in this case more than 0.02 min for benzene and 0.04 min for o-xylene.

Table 1
The power consumption of this type of column heating is relatively low. It depends, however, on the dimensions of the column (diameter and length) and the temperature settings (temperature and ramp rates). A 5 m x 250 μm i.d. (360 μm o.d.) was heated from 35–200 °C and held there for 2 min. At 35 °C the heating jacket only takes around 5 W. A maximum of 60 W was measured at the moment the column starts to heat and it falls back again to 30 W at an isothermal temperature of 200 °C. After analysis, the column is cooled by a small fan (diameter 50 mm) that is installed in front of the column coil. Air is aspirated from inside the micro-GC and the hot air (max. 30 °C) is projected out of the box. Because of the low thermal mass of the heating jacket and capillary column, the 5 m column is cooled from 200–35 °C in less than a min (51 sec).
Fast chromatographic analysis is ideally performed on a short (5–10 m long) narrow bore column (100 μm i.d.) because those provide higher efficiency per unit length than columns with larger diameters. Additionally, hydrogen is preferred as the carrier gas because maximum efficiency is obtained at relatively high gas velocities (40–60 cm/s, 0.3–0.6 mL/min). Carrier gas flows can also be increased without losing much column efficiency. Helium is, however, used as carrier gas in this micro-GC because it also serves as plasma gas. Moreover, portable analysis systems are subject to safety concerns, including explosion, and hydrogen should, therefore, be avoided. The μCAD was initially optimized for the analysis of BTEX in air and different columns were tested for this application.
First, a 2 m x 100 μm i.d., 0.4 μm HP-1 (Agilent Technologies) was installed into a standard GC. The column was connected between a hot PTV injector (200 °C) equipped with an empty glass liner and a FID. The column was heated by the polyimide heating jacket. A headspace sample (2 μL) from the BTEX stock mixture in a 2 mL vial was injected at a split ratio of 1:50. The low phase ratio (β = 62.5) was chosen to increase the retention and, therefore, improve the resolution between the volatile compounds. The column temperature was kept at 30 °C, 40 °C and 50 °C isothermally. The column flow-rate (helium) was varied between 0.7 and 3.0 mL/min and the resolution between ethylbenzene and the peak from m- and p-xylene (co-eluting) was measured (Table 1).

Figure 7
Table 1 also gives the plate count for o-xylene. Figure 7(a) shows a typical chromatogram for a column temperature of 30 °C and at 1 mL/min. A flow around 1 mL/min (ū = 114 cm/s) resulted into an optimal resolution for the critical pair. Higher temperatures reduce retention of the volatile compounds and have drastic effects on the resolution: the Rs at 1 mL/min is reduced from 2.2 (30 °C) to 1.24 (50 °C). Using this column, the theoretical plate count of 20 000 is not reached and a maximum of 15 000 plates for o-xylene is obtained at 30 °C. This is most probably caused by a combination of column quality and injection phenomena.
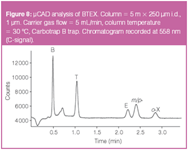
Figure 8
The selection of the chemical trap material is largely determined by its trapping efficiency. Whereas, the release rate of the compounds from the material during thermal desorption plays a significant role in the chromatographic output. While in benchtop systems, thermal desorption is usually combined with a refocusing step (usually a cryotrap), this is less feasible in miniature systems. Usually, the chemical trap ("injector") influences the chromatographic performance in a negative way, even if the amount of (ad)sorbent is minimized. Two parameters are important to reduce the band width during thermal release: temperature (i.e., desorption temperature and heating rate) and desorption flow.
The miniature trap installed in the μCAD system is heated to 200 °C, 250 °C or 300 °C at a speed of 1000 °C/min. For the BTEX application, the solutes are released within maximum 10 s. High carrier gas flow-rates during thermal desorption enhance the transfer of the released compounds to the capillary column but are a disadvantage for column efficiency and a compromise has to be found.
Tenax TA can be considered as a common material for trapping a wide range of volatile and semi-volatile compounds. It is preferred over carbon-based materials for its high-temperature stability and lack of water adsorption. A quartz tube (70 mm x 1.5 mm i.d.) filled with 20 mg Tenax TA was installed as trap in the μCAD. A headspace sample from the BTEX stock mixture was diluted 1:50 and 2 μL of the diluted gas standard was injected into a heated (80 °C) flow-through cell (10 mL content). Sampling was performed by aspirating air through the cell at 20 mL/min during 30 s into the trap. The compounds were thermally desorbed at 200 °C in back-flush mode using a helium flow of 1 mL/min. Figure 7(b) shows the resulting chromatogram and this situation is comparable with the chromatogram in Figure 7(a), except for the additional adsorption/desorption step. While a split gas injection (from which minimal band broadening can be expected) resulted in a Rs of 2.2 between ethylbenzene and m/p-xylene, the resolution decreased to 1.08 using the Tenax trap [Figure 7(b)]. Equally, the plate count for o-xylene was reduced from N = 13550–4417. This fundamentally reflects the contribution of the trap (desorption speed on peak shape).
Although the chromatographic resolution is impaired, the Tenax trap and selected GC conditions result in an acceptable profile for the BTEX application. The limited amount of Tenax in the miniature trap unfortunately gives low recoveries. Benzene is recovered for 71% after sampling at 100 mL/min during 30 s (50 mL air sampled), while this falls back to 58% and 14% for 1 min and 5 min of sampling, respectively. Keeping the sampling volume constant, the sampling time is found to be more critical than the flow-rate: 5 min sampling at 20 mL/min (100 mL air) gives 14% recovery and 0.5 min at 200 mL/min (100 mL air) results in 63%. This experiment also clearly shows the influence of sampling time versus sampling rate. A short sampling at relative high flow was, therefore, selected.
In comparison to Tenax, activated carbon shows much better retention for volatile compounds. A similar recovery experiment was performed with a Carbotrap B trap (60/80 mesh, 20 mg) installed in the μCAD and benzene is recovered for more than 95% when sampling is performed at 200 mL/min during 0.5, 1 and 5 min. Whereas, the compounds are more difficult to thermally desorb. Figure 7(c) shows the chromatogram of the BTEX analysis using the Carbotrap B trap in combination with the 2 m x 100 μm i.d., 0.4 μm df HP-1 column. The column temperature was set to 30 °C and a helium flow-rate of 3 mL/min was used. Lower flow-rates resulted in one single "hump". Increasing the length to 5 m did not significantly change the chromatographic performance. These profiles clearly show the incompatibility between the slow release/injection of the compounds from the trap and the narrow bore column.
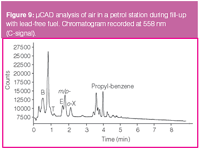
Figure 9
A better compromise was found in a 5 m x 250 μm i.d., 1 μm, df HP-1 column. The theoretical plate count and phase ratio are equal to this of the 2 m x 100 μm column (Nth= 20000, β = 62.5). An optimum column flow is expected around 1–1.5 mL/min (ū = 33–45 cm/s), but higher flows between 3–10 mL/min (ū = 85–214 cm/s) are chosen to enhance desorption from the carbon trap. Two μL of BTEX headspace sample was injected in the flow-through cell and air was aspirated at 200 mL/min during 30 s. Thermal desorption was performed at 200 °C during 30 s in the back flush mode. Figure 8 shows a typical chromatogram at a column flow rate of 5 mL/min (ū = 127 cm/s). The resolution between the critical pair ethylbenzene and m/p-xylene is Rs = 1.3 while the plate count for o-xylene is 5165. A flow of 3 mL/min results in better resolution (Rs = 1.5 for the critical pair) but increases the analysis time to about 5 min. At a flow of 10 mL/min, the resolution decreases to a limited value of Rs = 0.9.
In conclusion, the 5 m x 250 μm i.d. capillary column shows a better compatibility (chromatographic performance) in combination with the chemical trap than the 100 μm i.d. column. The carrier gas flow (5 mL/min) is programmed far above the theoretically optimum flow but this has a positive effect on the thermal release of the compounds from the trap and thus the chromatographic performance of the system. Activated carbon is a must for the retention of volatiles compounds in the miniaturized trap.
The final configuration using a carbon trap was used to measure the air quality at a petrol station. Air was sampled at 200 mL/min during 30 s during the filling of a car with lead-free fuel. The column head pressure was set to a 66 kPa. In contrast to earlier experiments, the column was programmed from 35 °C and further heated after 3 min to 150 °C at 10 °C/min to elute less volatile compounds from the column. For the same reason, thermal desorption was done at 300 °C during 30 s. Figure 9 shows the resulting chromatogram for the signal at 558 nm. The main peak is most likely iso-octane, but the toluene and xylene isomer peaks can clearly be distinguished in the profile. Quantification is possible because the procedure of sampling and analysis with the μCAD was validated for air samples containing BTEX at concentrations between 0.13–3.3 μg/L (m/V).8
The measured concentration of o-xylene was 0.5 μg/L. Para- and meta-xylene are quantified as a sum peak and are measured at a total level of 1 μg/L. The toluene concentration is less than 0.13 μg/L [i.e., the limit of quantification (LOQ)]. Benzene is hardly resolved from some volatile interferences, but it can be estimated that its concentration is not larger than 0.6 μg/L. Moreover, some less volatile propyl-benzenes are visible at around 3.0–4.5 min.
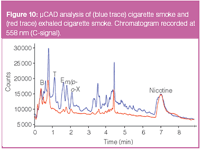
Figure 10
Figure 10 shows the overlay of two PED chromatograms at 558 nm for the analysis of cigarette smoke. The chromatographic conditions were equal to those used for the air in the petrol station. The blue trace shows the content of the smoke at the tip of the cigarette (side-stream), while the red chromatogram gives the output of the (mainstream) smoke blown out after inhalation. The two chromatograms are highly complex and the target compounds (BTEX) are hardly resolved from interfering compounds such as acetonitrile, isoprene, acroleine and other unknown aliphatic and aromatic hydrocarbons. The broad peak at around 7 min was identified as nicotine. Complete resolution of these peaks can only be accomplished when longer high resolution columns or mass spectrometric techniques are applied. Whereas, these profiles provide an estimation of the toxic compounds during inhalation.
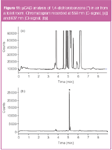
Figure 11
The plasma chip detector developed in this work also allows the measurement of wavelengths that are emitted by hetero-elements (atomic or molecular bands). In this way selective detection is possible. Reference 8 describes the specificity of the PED for sulphur and phosphorus compounds using a pulsed DC power supply. Using a constant DC power supply, this results in optimized selectivity for halogenated compounds. The presence of chlorine is measured at 837 nm, while at 882 nm and 740 nm, bromine and fluorine are selectively detected. Typically, element-to-carbon selectivities (ratio of the response for the test element to the response for an equal amount of carbon) between 10–200 are obtained for Cl, Br or F. These values are calculated from raw emission signals and it is estimated that background correction could increase these values by at least a factor of 10–50. Figure 11 illustrates the selective detection of p-dichlorobenzene (1,4-DCB) in air from a toilet room. 1,4-DCB is used in air fresheners and can cause coughing and irritating eyes.14 Sampling was performed during 2.5 min at a flow of 200 mL/min (500 mL sample). Figure 11(a) shows the carbon trace at 558 nm and illustrates the complexity of the air sample. p-DCB can nonetheless be clearly identified in the chromatogram at 837 nm [Figure 11(b)] and its concentration was calculated at 625 μg/m³ (versus external standard).
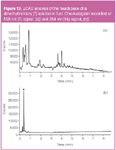
Figure 12
The PED also shows extremely good selectivity for the detection of organomercury compounds. This is illustrated in Figure 12, representing the analysis of the headspace of lead-free fuel in which a small amount of dimethylmercury was doped. Figure 12(a) shows the carbon signal at 558 nm, while the chromatogram in Figure 12(b) is recorded at 254 nm (Hg signal). The main peak (marked with an asterix*) in the latter profile represents dimethylmercury at a level of 74 ng on the column and it is not affected by the large amount of matrix compounds. Sampling was performed at 200 mL/min during 30 s (100 mL air sampled) and the dimethylmercury concentration in air corresponds to 0.74 μg/L. The LOD is in the order of 0.01 μg/L, which is below the occupational exposure limit (TWA) of 0.03 μg/L.15
Conclusion
A recently introduced micro-GC (μCAD) was optimized for the analysis of volatile compounds in air. The system is based on the enrichment of air contaminants on a miniature chemical trap, thermal desorption, chromatographic separation on a short resistively heated capillary column and a micro-chip based plasma emission detector (μPED). The configuration is very versatile because it can be optimized for different applications. Key features are i) the chemical trap. Different types can be installed and both sampling (sampling time) and thermal desorption conditions (temperature, flow) can be programmed; ii) temperature-programmed GC allows optimization of the chromatographic separation for volatiles and semi-volatiles; iii) the μPED can be used both as a universal (FID-like) and as an element-selective detector.
Acknowledgments
CASECT Ltd and NViro Cleantech are thanked for financially supporting this project.
Pat Sandra is professor at the University of Gent and director of the Research Institute for Chromatography (RIC).
Bart Tienpont is researcher at RIC.
Frank David is visiting professor at the University of Gent and R&D manager at RIC.
Wim Witdouck is technical engineer at RIC.
References
1. W. Wardencki, R.J. Katulski and J. Stefanski, Crit. Rev. Anal. Chem.,38, 259–268 (2008).
2. S.A. Lammert, Mass. Spectrom.,17, 916–922 (2006).
5. R. Sacks, M. Klemp and M. Akard, Field Anal., Chem. Technol.,1, 97–102 (1996).
6. H. van Weerden, G.J. Burger and J. Elders, Am. Lab.,40(16), 14 (2008).
7. W.C. Tian et al., J. Microelectromechanical Sys.,12, 264–272 (2003).
8. B. Tienpont et al., Lab Chip,8, 1819–1828 (2008).
9. J.C.T. Eijkel, H. Stoeri and A. Manz, Anal. Chem., 71, 2600–2606 (1999).
10. J.C.T. Eijkel, H. Stoeri and A. Manz, Anal. Chem.,72, 2547–2552 (2000).
11. J.C.T. Eijkel, H. Stoeri and A. Manz, J. Anal. Atom. Spectrom.,15(3), 297–300 (2000).
12. A. Bogaerts et al., Spectrochimica Acta B,57, 609–658 (2002).
14. http://www.epa.gov/ttn/atw/hlthef/dich-ben.html
15. http://www.ilo.org/public/english/protection/safework/cis/products/icsc/dtasht/_icsc13/icsc 1304.htm

New Study Reviews Chromatography Methods for Flavonoid Analysis
April 21st 2025Flavonoids are widely used metabolites that carry out various functions in different industries, such as food and cosmetics. Detecting, separating, and quantifying them in fruit species can be a complicated process.
University of Rouen-Normandy Scientists Explore Eco-Friendly Sampling Approach for GC-HRMS
April 17th 2025Root exudates—substances secreted by living plant roots—are challenging to sample, as they are typically extracted using artificial devices and can vary widely in both quantity and composition across plant species.
Sorbonne Researchers Develop Miniaturized GC Detector for VOC Analysis
April 16th 2025A team of scientists from the Paris university developed and optimized MAVERIC, a miniaturized and autonomous gas chromatography (GC) system coupled to a nano-gravimetric detector (NGD) based on a NEMS (nano-electromechanical-system) resonator.

.png&w=3840&q=75)

.png&w=3840&q=75)


.png&w=3840&q=75)


.png&w=3840&q=75)


