Testing Method Performance
What measurements are required for system suitability?
Often, one of the first signs of trouble with a liquid chromatography (LC) method is a failure to pass the system suitability requirements for the method. In fact, early warning of potential problems is one of the primary purposes of a system suitability test. As stated in the regulatory guidance,1 "The accuracy and precision of HPLC data collected begin with a well-behaved chromatographic system. The system suitability specifications and tests are parameters that provide assistance in achieving this purpose." Unfortunately, sometimes we lose sight of the purpose of a system suitability test and worry more about checking the boxes on a form than what the test is trying to do. I am often asked what system suitability requirements are mandated by regulation. This is an interesting question, because as far as I know, there are no firm requirements as to what parameters must be measured or what the minimum values of these parameters must be. The closest thing that I can find to requirements is a document called "Reviewer Guidance: Validation of Chromatographic Methods,"1 from the Food and Drug Administration's Center for Drug Evaluation and Research (FDA-CDER). This is a document intended to give CDER reviewers of LC methods some guidelines about what to look for in a "good" method. Or as the document states,1 "The purpose of this technical review guide is to present the issues to consider when evaluating chromatographic test methods from a regulatory perspective." Many workers feel that if their methods perform at least as well as the recommendations of this document, they will be safe from regulatory criticism. This may or may not be a well-reasoned response. This month's "LC Troubleshooting" discussion will centre on the recommendations of the CDER document, especially in terms of what it means from a practical method performance standpoint.
The Recommendations
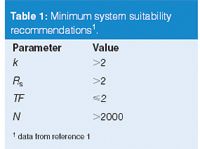
Table 1 summarizes four of the key parameters that can be used to evaluate method performance. These are standard measurements that most workers make on a routine basis. Let's review the definitions of each of these, then look at some examples.
Retention factor, k. The retention factor (also sometimes called capacity factor, k') is a measure of the distribution of the analyte between the mobile phase and the stationary phase in the column in isocratic (constant organic solvent) separations. It can be thought of as a way to measure retention in a manner that is independent of column dimensions and flow-rate. Retention factor is calculated as

where tR is the retention time of the analyte of interest and t0 is the column dead-time ("solvent front"). As has been discussed in other "LC Troubleshooting" columns (for example, see reference 2), when developing a new method, we strive for 2 < k < 10, but usually will accept 1 < k < 20 for all the peaks of interest in a separation. Peaks with k < 1 can be compromised with real samples that contain large "garbage" peaks at t0. Methods with k > 2 also tend to be more robust to small changes in the chromatographic conditions.
Resolution, Rs. Resolution is the measurement of the separation of two peaks in a chromatogram and is a function of both the peak widths w and retention times:

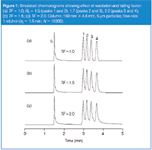
where the subscripts refer to the first and second peaks. The peak width is determined by drawing tangents to the sides of the peak and measuring the distance between the tangents where they intersect the baseline. Baseline separation of a perfectly shaped Gaussian peak pair (a rarity in LC) is observed with Rs = 1.5 [see peaks 1 and 2 in Figure 1(a)].
Tailing factor, TF. Peak tailing is measured with the tailing factor in the pharmaceutical industry and with a slightly different calculation called the asymmetry factor As for most nonpharmaceutical applications.

where AC is the width of the peak at 5% of its height and AB is the front half-width at the same height. (As is calculated as the back half-width divided by the front half-width at 10% of the peak height.) New columns with well-behaved test compounds will generate tailing factors of 0.9–1.2, so a little tailing is normal.
Column plate number, N. The plate number, also called the column efficiency, is a unitless way to measure the performance of the column. It is calculated as:

Plate numbers for new columns can be quite large. For example, a 150 mm x 4.6 mm column packed with 5 μm diameter particles can give plate numbers of 12000–15000 with well-behaved compounds. A 100 mm x 4.6 mm, 3 μm column might give 13000–16000 plates under the same conditions. Under more realistic conditions with "real" samples, plate numbers of 10000 are more reasonable for these columns, and we will use this as a reference value for a well-behaved 150 mm x 4.6 mm, 5 μm or 100 mm x 4.6 mm, 3 μm column in the present discussion.
Checking the Numbers
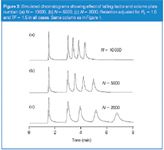
Let's look next at the practical impact of the recommendations of Table 1. Figures 1 and 2 contain simulated chromatograms that will help illustrate various points. A 150 mm x 4.6 mm, 5 μm particle diameter column operated at a flow-rate of 1 mL/min is assumed (t0 = 1.5 min). In Figure 1, N = 10000; in Figure 2, the plate number is noted. Tailing is simulated using an exponential calculation, which might be adequate for some types of tailing, but not others.
Retention factor. In Figure 1, k = 1.0 for the peak 1 and k = 1.75 for peak 4. It can be seen that with these chromatograms with a fairly small t0 peak, k > 1 should avoid any interference with the unretained material. However, if the unretained peak is quite large and tails badly, it is quite possible that retention of k < 1 might have some interference problems. So the recommendation of Table 1 of k > 2 is fairly conservative; although it is nice to have k > 2, as long as k > 1, the first peak should be sufficiently retained to avoid problems with the unretained peak. Sometimes k-values are reduced to speed up the separation, but this can be false economy, because of potential for problems at the beginning of the chromatogram. One way around this problem is to increase the flow-rate, which will shorten the retention times but will not affect k — most methods operate well below the maximum pressure limits of the LC system, so an increase in flow (and pressure) can be tolerated.
Resolution. In Figure 1(a), symmetric peaks are assumed (TF = 1.0) and the peak spacing has been adjusted so that the resolution between peak 1 and peak 2 is 1.5, between peak 2 and peak 3 is 1.7 and between peaks 3 and 4 is 2.0. For these perfectly shaped peaks, it can be seen that with Rs = 1.5, the valley between the peaks just touches the baseline. If there is any deterioration of the column or peak tailing, the valley will rise and resolution will be inadequate. Many workers accept Rs = 1.7 as a minimum (the separation of peaks 2 and 3) and although this does offer baseline separation, there is no safety margin if the column deteriorates. Only Rs = 2.0 (between peaks 3 and 4) gives both adequate separation and a little safety for small changes in the separation.

Figure 1
Tailing factor. When the peaks tail, resolution suffers. This is illustrated in Figure 1(b) for TF = 1.5 and Figure 1(c) for TF = 2.0. With no change in retention times, now the resolution that ranged from 1.5 to 2.0 in Figure 1(a) is only 1.0 to 1.3 in Figure 1(b) and 0.75 to 1.0 in Figure 1(c). This means that if peaks tail and Rs > 2.0 is desired, retention must be increased, which will result in longer run times (see discussion of Figure 2). Tailing peaks also complicate the calculation of resolution. With Equation 2, symmetrical peaks are assumed. If peaks tail, it is only the portion of the peak that contributes to the valley that is important, so the back half of the first peak and the front half of the second peak contribute to the resolution. Data systems base resolution calculations on the peak width, so reported values with tailing peaks might not reflect the true resolution.

Figure 2
Column plate number. Peak width changes with the square root of the plate number (Equation 4), so smaller plate numbers mean broader peaks and less resolution. Figure 2 shows the result of a combination of TF = 1.5 and Rs = 1.5 for various plate-number columns. As N is reduced, retention must be increased to maintain resolution. To obtain Rs = 1.5 for all peaks, the run time of Figure 1(b) must be increased to that shown in Figure 2(a). The run must be even longer for columns that have lower plate numbers and, thus, generate broader peaks, as seen by comparing the chromatograms of Figure 2. The larger retention times and lower plate numbers combine to give shorter peaks (constant area is assumed), so detection limits will suffer when the plate number is reduced. For example, The retention of peak 4 is 50% larger in Figure 2(c) when compared with Figure 2(a). At the same time, the peak width is more than twice as large, so the peak height and, thus, sensitivity has dropped by more than two-fold.
What Does It Mean?
So are the recommendations of Table 1 reasonable or not? I have mixed feelings about using these values as targets for system performance, but they certainly are not unreasonable. If you can develop a method so that k > 2 for the first peak, you are likely to have fewer problems with the method, but many methods work very well with k > 1. The remaining parameters are somewhat interrelated. As columns age, typically peak tailing increases and the plate number drops. These factors, coupled with any change in retention time, will result in a change in resolution — usually for the worse. For this reason, it is usually worthwhile to spend extra time during method development to develop a more robust separation — one that will tolerate the inevitable changes in the separation that occur over time.

Table 1: Minimum system suitability recommendations1.
Rs = 2 is adequate for equal-sized peaks. If the peak size varies widely between peaks in the chromatogram, such as with impurity analysis or stability-indicating assays, larger values of resolution might be required. Today's high-purity-silica columns generate much more symmetrical peaks than the previous generation of columns, so I would target a maximum tailing factor of 1.5–1.7. More tailing than this can usually be avoided by picking another column, adjusting the mobile phase pH, or changing the mobile phase organic solvent. Remember, if you develop a method that starts with TF = 2, it will only get worse as the column ages.
A plate number of 2000 is likely to be inadequate unless you have a very simple separation. You will be able to get better sensitivity, higher resolution and faster runs (all other factors the same) with a column that generates more plates. A new 150 mm-long, 5 μm particle or 100 mm, 3 μm column will give N ≈ 10000 for real compounds; by the time the initial plate number drops by 25–30%, it is probably time to replace the column. Although a new column costs $500 or so, if it lasts more than ≈500 injections, it accounts for less than ≈2% of the overall analysis costs, so it is prudent to replace the column when it gives signs of deterioration.
If you meet the guidelines of Table 1, will your methods always pass regulatory scrutiny? No. Is it necessary to meet the guidelines to have a method that performs well? No. However, if you use Table 1 as it is intended — a guideline — you should be able to develop methods that perform well and will pass regulatory inspection. The key is to test the method for robustness — tolerance to small changes of the type expected in normal operation, such as ±2% organic, ±3 °C, or ±0.1 pH units. And then develop a system suitability test that really checks to be sure the method is functioning adequately to gather reliable data. If you develop a robust method and document how and why you chose the method settings, you will be less likely to have regulatory issues. More importantly, you will understand the effects of the method variables on method performance, so you can keep the method working well and can know what to do when it begins to show signs of problems.
References
"Reviewer Guidance: Validation of Chromatographic Methods," FDA-CDER (1994), www.fda.gov/cder/guidance/cmc3.pdf
J.W. Dolan, LCGC Eur. , 20(11), 568–573 (2007).
"LC Troubleshooting" editor John W. Dolan is vice president of LC Resources, Walnut Creek, California, USA; and a member of the Editorial Advisory Board of LCGC Europe. Direct correspondence about this column to "LC Troubleshooting", LCGC Europe, Park West, Sealand Road, Chester CH1 4RN, UK.

Silvia Radenkovic on Her Research and Passion for Scientific Collaboration
April 3rd 2025Radenkovic is a PhD candidate at KU Leuven and a member of FeMS. Her research focuses on inborn metabolic disorders (IMD), like congenital disorders of glycosylation (CDG), omics techniques such as tracer metabolomics, and different disease models.
Evaluating Natural Preservatives for Meat Products with Gas and Liquid Chromatography
April 1st 2025A study in Food Science & Nutrition evaluated the antioxidant and preservative effects of Epilobium angustifolium extract on beef burgers, finding that the extract influenced physicochemical properties, color stability, and lipid oxidation, with higher concentrations showing a prooxidant effect.


