Determination of Organophosphate Esters in Water Samples Using Gas Chromatography–Mass Spectrometry (GC–MS) and Magnetic Solid-Phase Extraction (SPE) Based on Multi-Walled Carbon Nanotubes (MWCNTs)
A method based on gas chromatography–mass spectrometry (GC–MS), coupled with magnetic solid-phase extraction (SPE) with multi-walled carbon-nanotube (MWCNT)-coated iron oxide (Fe3O4) as the adsorbent, was developed for analyzing four organophosphate esters in ambient water samples. The magnetic, MWCNT composites were prepared by hydrothermal synthesis and characterized with scanning electron microscopy (SEM), transmission electron microscopy (TEM), Fourier transform infrared (FT-IR) spectroscopy, and superconducting quantum interference device magnetometry (SQUID). The extraction and desorption conditions, such as adsorbent dosage, adsorption time, eluent type, and eluent volume, were studied. The adsorbent was used to extract analytes within 50 min. The limit of detection (LOD) was between 0.038–1 μg/L, and the limit of quantitation (LOQ) was between 0.10–3.59 μg/L. The method was applied to analyze organophosphate esters in environmental water samples. A 72.5–89.1% recovery was obtained by analyzing spiked samples with low-, medium-, and high-concentration analytes. The relative standard deviations (RSDs) were less than 10%. This method displayed better sensitivity and accuracy; therefore, it could be successfully used to detect organophosphate esters in environmental water samples.
Organophosphate esters (OPEs) are often used as common flame retardants and plasticizers in plastic foam, electronics, furniture, textiles, and construction materials (1,2). It has been reported that the widespread application of OPEs has resulted in their becoming an emerging pollutant. Most OPEs are primarily combined with the product through physical action. Therefore, they are easily released into the surrounding environmental media using volatilization, abrasion, and even dissolution. They have been detected in surface water (3,4), groundwater (5), wastewater (6,7), atmospheric particulate matter (8,9), and dust (10). The previous studies found that some commonly used OPEs have carcinogenicity, neurotoxicity, and hepatoxicity, all of which could threaten human health and ecosystems (11,12). Exposure to triphenyl phosphate (TPhP) disturbed hormone levels and sperm quality in fish (13). Tributyl phosphate (TnBP) and tris (2-ethylhexyl) phosphate (TEHP) showed strong irritation to the skin (1). In recent years, the United States, the European Union, and other countries have established laws and regulations to limit the use of OPEs in domestic products. On a global scale, organizations and institutions have also begun to pay closer attention to the issue of environmental pollution from OPEs, researching this subject more often.
Currently, there are many kinds of pretreatment methods for OPEs extraction in water samples, mainly including liquid–liquid extraction (LLE) (14), membrane-assisted solvent extraction (MASE) (6), solid-phase extraction (SPE) (3,15), and solid-phase microextraction (SPME) (16,17). LLE and SPE are the two most commonly used pretreatment methods. However, these methods are cumbersome and require a large amount of organic solvent for pretreatment of the extraction column. Moreover, LLE and SPE methods have poor recoveries for polar and volatile compounds, such as trimethyl phosphate (TMP) and tris (2-chloroethyl) phosphate (TCEP); or hydrophobic compounds, such as TEHP (15,18–19). Magnetic solid-phase extraction (MSPE) has been developed rapidly as a new type of sample preparation technique and has received considerable attention. MSPE uses magnetic or magnetizable material as the sorbent for the extraction or preconcentration of the target analytes (20). The method overcomes the column plugging problem often occurring in SPE, simplifies the SPE process greatly, and enhances the extraction efficiency. Currently, MSPE is widely used for qualitative and quantitative analysis of various organic pollutants and inorganic metal ion contaminants in the environmental sample when combined with high performance liquid chromatography (HPLC) or gas chromatography (GC) (21–23), which makes the method ideal for applications in biological separations and environmental analysis. However, MSPE is rarely used for OPE analysis in the present.
Instrumental analysis of OPEs is mainly conducted using the GC and nitrogen–phosphorous detector method (GC-NPD) (4), GC–mass spectrometry (GC–MS) (17,23), and LC–tandem MS (LC–MS/MS) (14,24). Among them, GC-NPD offers poor stability, requiring regular replacement parts. The sample matrix can affect the electrospray ionization source (ESI) of LC–MS/MS. In this study, we developed a method based on MSPE-GC–MS for analyzing OPEs in river water samples. The MSPE and GC–MS detection conditions were investigated. The method offers a wide linear range, good sensitivity, and recovery for both polar and nonpolar OPEs. It can be successfully used to detect OPEs in environmental water samples.
Materials and Methods
Materials
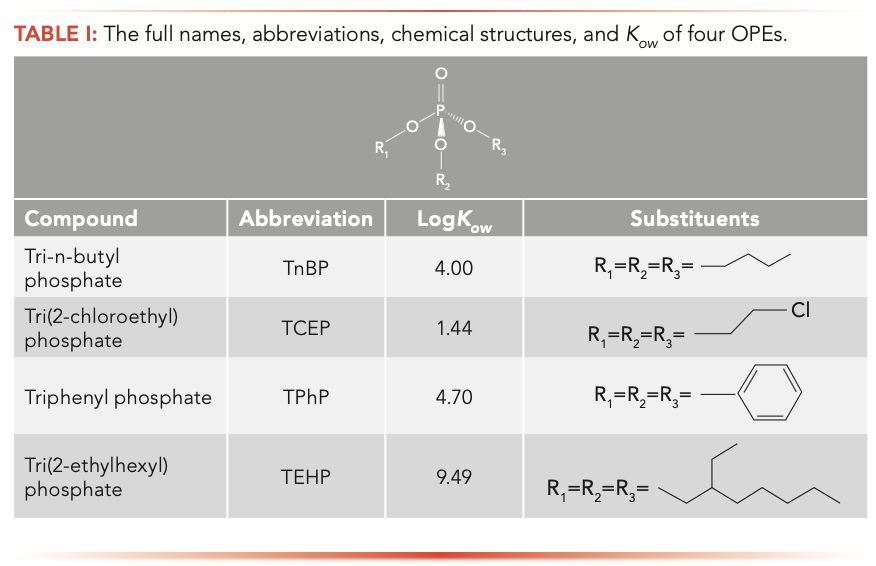
Organophosphate esters (TnBP, TCEP, TPhP, and TEHP) were purchased from AccuStandard. Their full names, abbreviations, chemical structures, and octanol-water partition coefficient (Kow) are shown in Table I. Ethyl acetate and multi-walled carbon nanotubes were obtained from the Aladdin Reagent Company (Shanghai). Tetraethyl orthosilicate (TEOS), polyethylene glycol, FeCl3•6H2O, aqueous ammonia (25 wt% aqueous NH3), and ethylene glycol were obtained from Tianjin Damao Chemical Reagent Factory (Tianjin).
The OPEs stock solution with a concentration of 10 mg/mL was prepared with ethyl acetate and was stored in a refrigerator at 4 °C. According to experimental needs, other solutions were diluted by using the stock solution. Unless specified otherwise, ultrapure water was used in all experiments.
Instruments
The analysis was done using an Agilent 7890 gas chromatograph coupled to an M7-300EI single quadrupole mass spectrometer (GC–MS) instrument. The morphology of the prepared material was observed by using a Tecnai-G20 transmission electron microscope (TEM) from FEI and a JSM-7500F scanning electron microscope (SEM) from Japan Electronics. Magnetic measurements were performed by using a superconducting quantum interference device (SQUID) and a magnetometer (VSM, Quantum Design). The functional groups of the synthesized adsorbent were measured using a Fourier-transform infrared spectroscopy (FT-IR) spectrometer (920, Tuopu). Water was purified through a Milli-Q system (Millipore).
Preparation of MSPE Sorbent
Synthesis of Iron Oxide (Fe3O4)
Fe3O4 magnetic nanoparticles were synthesized by using a solvothermal method (25). First, 1.35 g of FeCl3•6H2O was added to a beaker containing 40 mL of ethylene glycol. Next, the solution was stirred for 15 min. Then, 3.6 g of anhydrous sodium acetate and 1.0 g of polyethylene glycol were added to the mixed solution. Stirring was continued even after the formation of a uniform yellow thick liquid. The sample was then transferred to a 50 mL polytetrafluoroethylene autoclave, which was sealed and placed in an oven at 190 °C for 8 h. The new-solid sample was then cooled to room temperature, and the Fe3O4 nanoparticles were separated with the magnet. After washing three times with ultrapure water and anhydrous ethanol, the sample was vacuum dried at 60 °C for 2 h. The Fe3O4 black powder was obtained.
Synthesis of Fe3O4@SiO2 Microspheres
SiO2-coated Fe3O4 microspheres were prepared via a modified Stöber synthesis (26). First, 0.1 g Fe3O4 nanoparticles were added to 50 mL of hydrogen chloride (HCl) (0.1 mol/L), and the solution underwent ultrasound treatment for 10 min. After washing with distilled water, the Fe3O4 was added to a three-necked round bottom flask containing 80 mL of absolute ethanol, 20 mL of water, and 1 mL of aqueous ammonia. The solution was mixed well through mechanical agitation. Next, 0.03 g of tetraethyl orthosilicate (TEOS) was added dropwise and stirred at room temperature for 6 h. Finally, the product was separated with a magnet, washed three times with distilled water and absolute ethanol, respectively, and vacuum dried at 60 °C for 2 h. The Fe3O4@SiO2 microspheres were then obtained.
Synthesis of Fe3O4@SiO2 Multi-Walled Carbon Nanotubes (MWCNTs)
Fe3O4@SiO2 (0.004 g) and multi-walled carbon nanotubes (MWCNTs) (0.016 g) were added to deionized water. The mixture was sonicated for 15 min to ensure complete self-assembly of MWCNTs onto Fe3O4@SiO2 nanoparticles. A black homogeneous liquid was formed.
Sample Preparation by MSPE
Several factors of extraction such as adsorbent dosage, adsorption time, elution solvent, and elution time were studied. During MSPE, 20 mg Fe3O4@SiO2 MWCNTs were dispersed to 20 mL pure water solution spiked with four OPEs (10 μg/L), which was subjected to a constant-temperature 25 °C water bath with vibration mixing for 50 min. After the oscillation extraction, Fe3O4@SiO2 MWCNTs adsorbing four OPEs were separated by a magnet. The supernatant was then discarded. Then 1400 μL of the ethyl acetate was used to desorb the OPEs by ultrasonic treatment for 20 min. The obtained elution solution containing OPEs was aspirated off with nitrogen. The residual sample was dissolved with 200 μL ethyl acetate before undergoing GC–MS analysis.
GC–MS Analysis
The GC conditions were as follows: an HP-5 column (30 m × 0.32 mm × 0.25 μm) was used for separating the target analytes. The carrier gas was helium (purity ≥ 99.999%), and flow rate was 1.2 mL/min. For the heating program, the initial temperature was 70 °C before being heated at 15 °C/min to 200 °C. Then, heating was increased at 10 °C/min to 280 °C (where the temperature was held for 5 min). The inlet temperature was 280 °C, and the interface temperature was 280 °C. The splitless mode was then adopted and the injection volume was 1 μL.
The mass spectrometry conditions were as follows: EI ion source, energy = 70 eV, temperature = 230 °C, quadrupole temperature = 150 °C, and the data acquisition mode was a selected ion monitoring (SIM) scan. The SIM ions (m/z) of TnBP were 99 and 155. The TCEP ions were 63 and 249, the TPhP ions were 326 and 77, and the TEHP ions were 99 and 113.
Results and Discussion
Characterization of Fe3O4@SiO2 MWCNTs
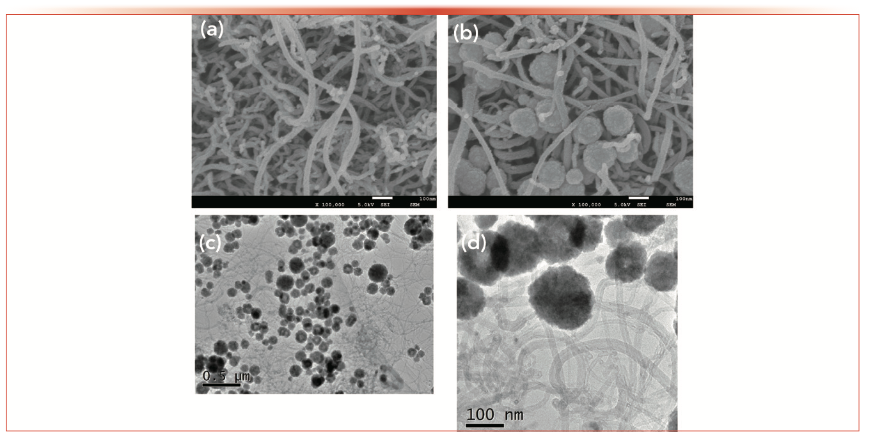
The preparation procedure of Fe3O4@SiO2 MWCNTs is shown in Figure 1. Its structure and composition were characterized by SEM, TEM, and FT-IR. Figure 2a displays the SEM image of the pristine MWCNTs. It can be seen that the MWCNTs are long with a rather smooth surface and are curly shaped. With the help of the literature (27,28) and the SEM and TEM images of Fe3O4@SiO2 MWCNT nanocomposites shown in Figures 2b–d, it can be seen that the material is nearly in a core-shell structure, with black-solid spheres showing Fe3O4 and a surface coating of a thin layer of SiO2 (Figures 2c and 2d). The SiO2 shell modified by the Stöber method not only protects the Fe3O4 magnetic shell from O2 oxidation in the air, but it also prevents Fe3O4 agglomeration. Almost all the Fe3O4@SiO2 nanoparticles were preferentially adhered to the surfaces of MWCNTs, indicating that the MWCNTs had been successfully modified (Figure 2b).
FIGURE 1: The schematic procedure of Fe3O4@SiO2 multi-walled carbon nanotubes (MWCNTs).
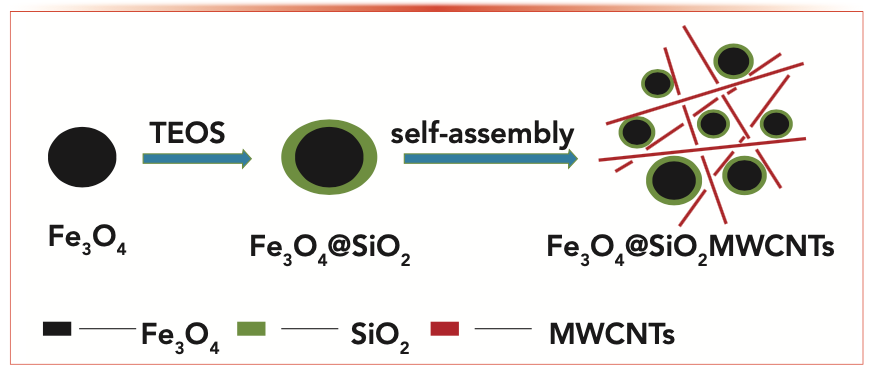
FIGURE 2: (a) SEM image of MWCNTs. (b) SEM image of Fe3O4@SiO2 MWCNTs. (c) and (d) TEM images of Fe3O4@SiO2 MWCNTs.
The FT-IR spectra of the Fe3O4@SiO2 MWCNT composite are shown in Figure 3a. The characteristic absorption peak of Fe–O in Fe3O4 is approximately 631 cm-1 (29). In the vicinity of 1045 cm-1, the stretching vibration characteristic absorption peak of Si–O–Si can be observed, indicating that SiO2 was successfully modified on the surface of Fe3O4 (30). The bands around 1630 cm-1 can be assigned to the stretching vibration peak of C=C in MWCNTs (31). These results confirmed that the Fe3O4@SiO2 MWCNT magnetic composites have been successfully prepared.
FIGURE 3: (a) FT-IR spectra of Fe3O4@SiO2 MWCNTs. (b) Magnetization curve (hysteresis loop) of Fe3O4@SiO2 MWCNTs.
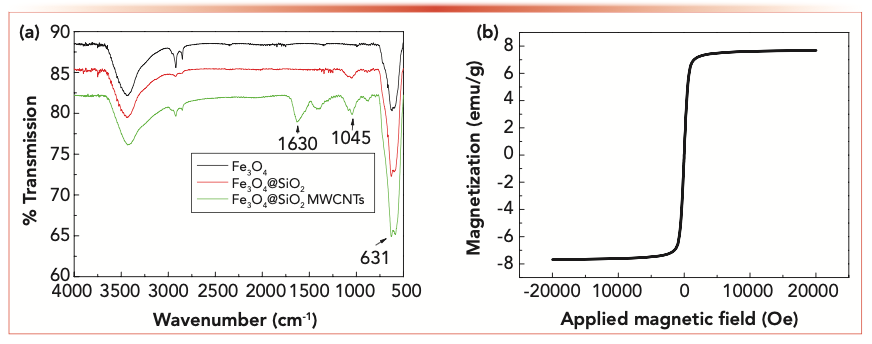
A magnetometer was used to study the magnetic properties of the adsorbent. Figure 3b shows the magnetization curve (hysteresis loop) of Fe3O4@SiO2 MWCNT nanoparticles. The saturation magnetization was 7.68 emu/g. The curve was smooth and symmetrical at the origin, and no remanence (residual magnetism) was found, indicating superior magnetic character.
Effect of the Amount of Magnetic Adsorbent
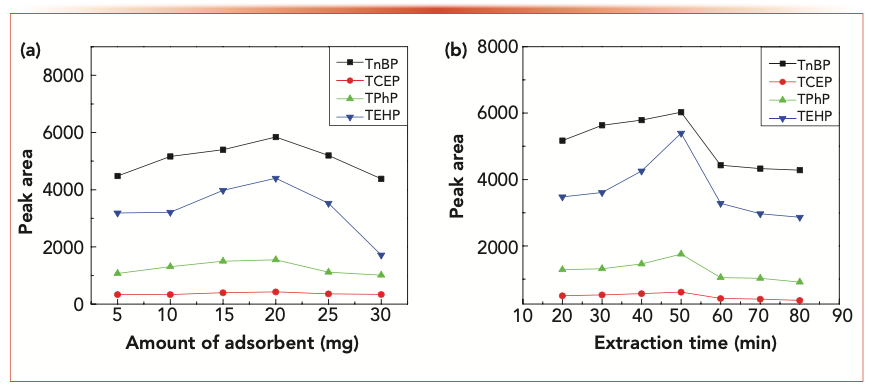
A different mass of magnetic adsorbent (5–30 mg) was added to a 20 mL spiked solution to study the extraction efficiency of OPEs. The results are shown in Figure 4a. The peaks of OPEs significantly increased with the increase of adsorbent amount within the range of 5–20 mg. When the adsorbent added was greater than 20 mg, the OPEs extraction efficiency decreased, which might be because the excessive adsorbent enhances the adsorption capacity between the adsorbent and the analytes, so that the eluent could not completely dissolve the analytes. Therefore, the amount of magnetic adsorbent added was 20 mg.
FIGURE 4: (a) Effect of the amount of Fe3O4@SiO2 MWCNTs on the adsorption of OPEs. (b) Effect of extraction time on the extraction performance.
Effect of Extraction Time
Extraction time is one of the most important parameters in MSPE. The effect of extraction time on the adsorption of OPEs was determined by testing using extraction times of 20–80 min. The results are shown in Figure 4b. With the extension of time, the extraction efficiency gradually increased, but then decreased after 50 min. We speculated that volatilization of eluent causes sample loss and decrease the extraction efficiency. Based on the above experimental results, the best extraction time was 50 min.
Effect of Eluent
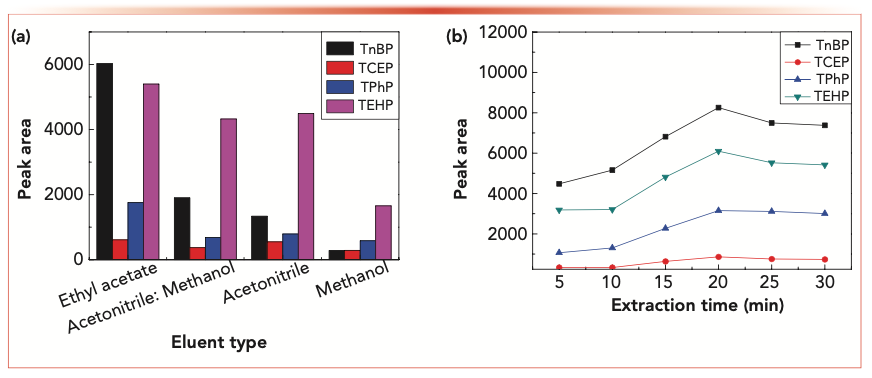
The eluent is also an important factor affecting extraction efficiency. Therefore, the effects of methanol, acetonitrile, methanol/acetonitrile (1:1, v/v), and ethyl acetate on the OPEs extraction efficiency were investigated, respectively. The results are shown in Figure 5a. The ethyl acetate solution is the most efficient eluent. This result is consistent with previous literature (32–34), so the ethyl acetate was chosen as the eluent.
FIGURE 5: (a) Effect of different eluents on the extraction performance of OPEs. (b) Effect of elution time on elution efficiency of OPEs.
Elution Volume and Elution Time
We also investigated the influence of the eluent volume on the extraction efficiency of OPEs. An eluent volume of 1400 μL was sufficient to obtain better extraction effi- ciency. More elution had nearly no effect on the extraction results, but it extended the concentration time. Therefore, a volume of 1400 μL ethyl acetate was used to elute the sample.
We also investigated the influence of the elution time on the extraction efficiency of OPEs. With ultrasonic assistance, OPEs were eluted quickly and efficiently from the MSPE adsorbent surface. As shown in Figure 5b, when elution time was extended over 20 min, the extraction efficiency decreased; therefore, 20 min was chosen as the elution time.
Method Evaluation
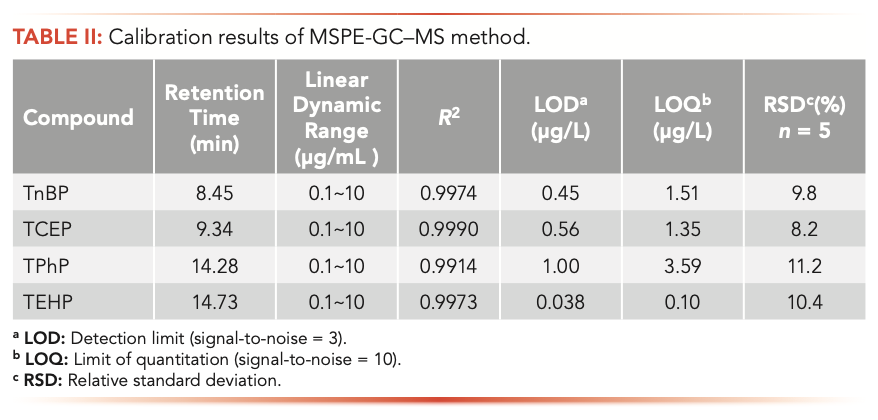
Under optimal conditions, the detection limit (LOD), the limit of quantitation (LOQ), recovery, and precision were used to evaluate the developed MSPE-GC–MS method. The instrumental linearity was performed by detecting OPEs standard solutions with 0.1, 0.5, 1, 2, 5, and 10 μg/mL. Good linearity with the coefficient R2 = 0.9914–0.9990 was obtained in this range (Table II). The LOD and LOQ, defined as three times and ten times signal-to-noise (S/N), respectively, was achieved by analyzing four spiked OPEs in a pure water sample. The LOD of TnBP, TCEP, TPhP, and TEHP were 0.45, 0.56, 1, and 0.038 μg/L, respectively. The LOQ of TnBP, TCEP, TPhP, and TEHP were 1.51, 1.35, 3.59, and 0.1 μg/L, respectively. In pure spiked water solutions, the average recoveries of TnBP, TCEP, TPhP, and TEHP were 84.3%, 90.7%, 83.8%, and 79.4%, respectively. According to a previously reported result (35), the high extraction efficiency can be attributed to the fact that the OPEs can interact with the Fe3O4@SiO2 MWCNT adsorbents via Brønsted acid-base interactions, van der Waals forces, and π-π electron donor-acceptor (EDA) interactions between the OPEs and the functionalized groups of the adsorbents.
Actual Water Sample Detection
To determine the applicability of this method, Songhua River water was selected (Jilin Province) for testing. First of all, water samples were centrifuged at 10,000 rpm for 10 min to remove sediment, and the supernatant was passed through a 0.45 μm filter. Then, the
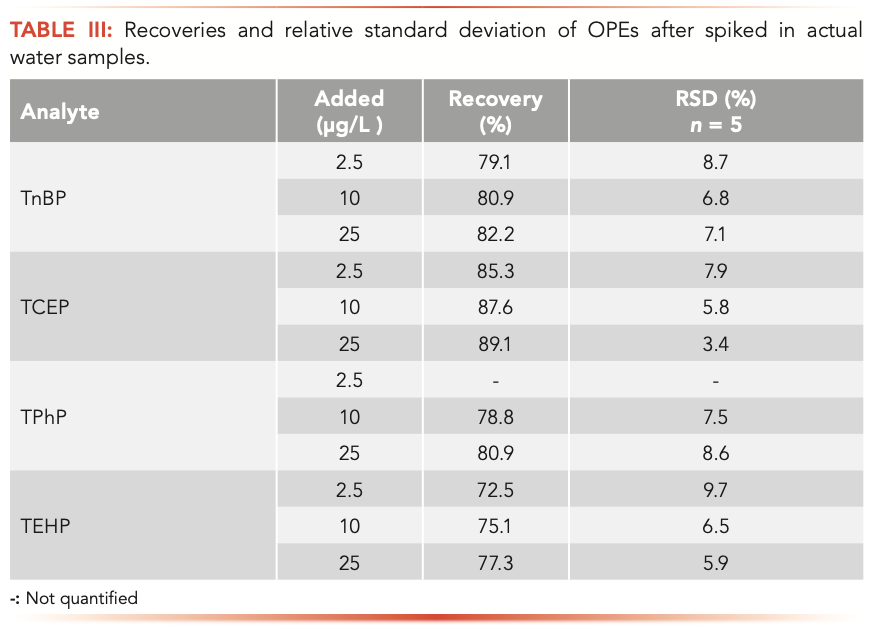
water sample was processed as described in the “Sample Preparation by MSPE” section, and the extracted OPEs were analyzed using the GC–MS technique. No OPEs were detected. Then, the OPEs were added to Songhua River water samples to make the concentrations of 2.5, 10, and 25 μg/L. The recoveries of OPEs spiked at the low, middle, and high concentrations were between 72.5–89.1%, with the mean relative standard deviations (RSDs) ranging from 3.4% to 9.7% (Table III). There were inorganic salts, organic matter, microorganisms, and some impurities in the Songhua River water. As a result, the extraction efficiency of the adsorbent had a certain impact. However, recoveries of the four OPEs in environmental water were acceptable.
Compared with Other Methods
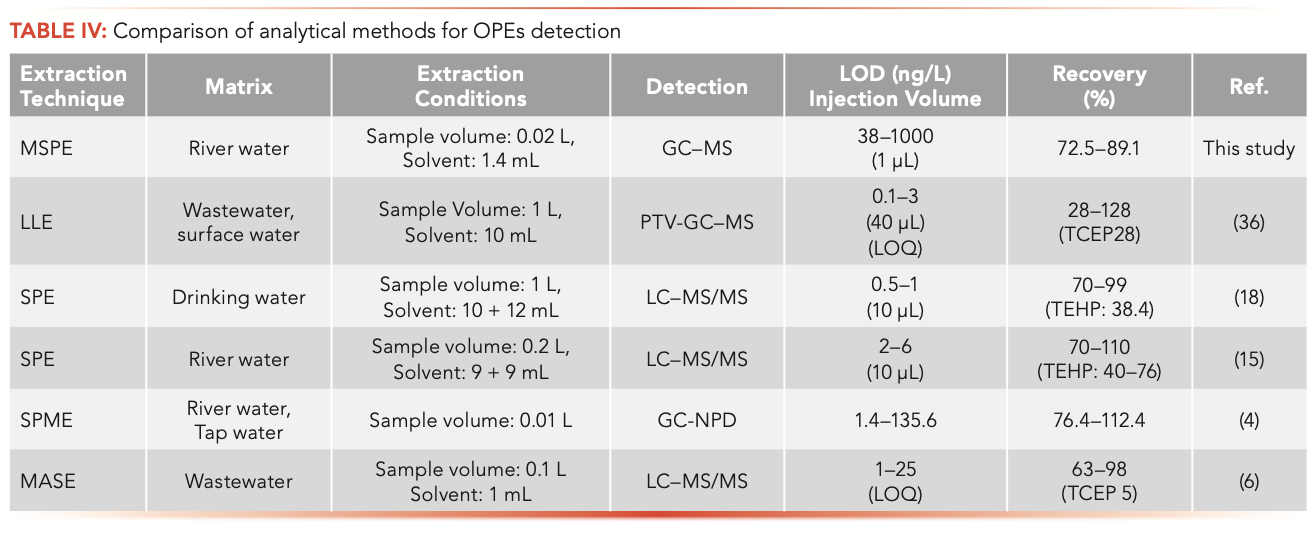
The MSPE-GC–MS method established in this paper was compared with other methods (Table IV). It was shown that the MSPE-GC–MS method had preferable recoveries for both polar and hydrophobic OPEs (TCEP and TEHP) and required less organic solvent compared with LLE and SPE methods (18,36). However, the LOD and LOQ of this method were higher than in the previous study (see references in Table IV [4,6,15,18,36]). We think it might be attributed to the smaller sample volume used in this study. The SPME method is a solvent-free sample preparation method, which also had a lower LOD (4). The recovery of polar TCEP in MASE was only 5%. Moreover, the MASE method was time-consuming, and the cost of the membrane is higher (6).
Conclusions
In this study, Fe3O4@SiO2 MWCNT magnetic composite was prepared and used to analyze organophosphate esters in water samples in combination with GC–MS for the first time. This method required only 20 mg of magnetic adsorbent, isothermal oscillation for 50 min, 1400 μL of eluting solvent, and 20 min of elution time. The method allowed for good recoveries, a wide linear range, low consumption of organic solvents, and low preparation cost of magnetic composite materials. This method could be successfully used to extract and analyze organophosphates (TnBP, TCEP, TPhP, and TEHP) in environmental water samples.
Acknowledgments
This work was supported by the Project of Science and Technology Development of Jilin Province (No. 20190303116SF and 202002008JC), the Research and Development Project for Industrial Technology of Jilin Province (No. 2020C028-1), the Talents Project for Innovation and Entrepreneurship of Jilin province (No. 2020030), and the Project of Science and Technology of the Education Department of Jilin Province (No. JJKH20210242KJ). The financial support from the Key Laboratory of Fine Chemicals of Jilin Province is also acknowledged.
Conflict of Interest
There are no conflicts of interest to declare.
References
(1) I. van der Veen and J. de Boer, Chemosphere 88(10), 1119–1153 (2012).
(2) H. Zhu, M.M. Al-Bazi, T.A. Kumosani, and K. Kannan, Environ. Sci. Tech. Let. 7(6), 415–420 (2020).
(3) L. Xing, Q. Zhang, X. Sun, H. Zhu, S. Zhang, and H. Xu, Sci. Total Environ. 636, 632–640 (2018).
(4) T. Jin, J. Cheng, C. Cai, M. Cheng, S. Wu, and H. Zhou, J. Chromatogr. A. 1457, 1–6 (2016).
(5) J. Regnery, W. Puttmann, C. Merz, and G. Berthold, J. Environ. Monit. 13(2), 347–354 (2011).
(6) J.B. Quintana and T. Reemtsma, J. Chromatogr. A. 1124(1), 22–28 (2006).
(7) L. Pang, P. Yang, L. Ge, J. Du, and H. Zhang, Anal. Bioanal. Chem. 409(5), 1435–1440 (2017).
(8) A. Möller, R. Sturm, Z. Xie, M. Cai, J. He, and R. Ebinghaus, Environ. Sci. Technol. 46(6), 3127–3134 (2012).
(9) F. Wong, C.A. de Wit, and S.R. Newton, Environ. Pollut. 240, 514–522 (2018).
(10) S. Langer, M. Fredricsson, C.J. Weschler, G. Bekö, B. Strandberg, M. Remberger, et al, Chemosphere 154, 559–566 (2016).
(11) W. Föllmann and J. Wober, Toxicol. Lett. 161(2), 124–134 (2006).
(12) Q. Shi, M. Wang, F. Shi, L. Yang, Y. Guo, C. Feng, et al, Aquat. Toxicol. 203, 80–87 (2018).
(13) R. Chen, X. Hong, S. Yan, and J. Zha, Environ. Pollut. 263, 114525 (2020).
(14) E. Martínez-Carballo, C. González- Barreiro, A. Sitka, S. Scharf, and O. Gans, Sci. Total Environ. 388(1), 290–299 (2007).
(15) X. Wang, J. Liu, and Y. Yin, J. Chromatogr. A 1218(38), 6705–6711 (2011).
(16) J. Zheng, Z. Gao, W. Yuan, H. He, S. Yang, and C. Sun, J. Sep. Sci. 37(17), 2424–2430 (2014).
(17) F. Shi, J. Liu, K. Liang, and R. Liu, J. Chromatogr. A 1447, 9–16 (2016).
(18) J. Li, N. Yu, B. Zhang, L. Jin, M.I. Li, M. Hu, et al, Water Res. 54, 53–61 (2014).
(19) H. Wolschke, R. Sühring, Z. Xie, and R. Ebinghaus, Environ. Pollut. 206, 488–493 (2015).
(20) C. Herrero-Latorre, J. Barciela-García, S. García-Martín, R.M. Peña-Crecente, and J. Otárola-Jiménez, Anal. Chim. Acta 892, 10–26 (2015).
(21) N.-E. Song, M.-C. Lim, S.-W. Choi, D.-O. Kim, and T.G. Nam, J. Food Sci. 85(4), 1098–1104 (2020).
(22) D. Li, M. He, B. Chen, and B. Hu, J. Chromatogr. A 1601, 1–8 (2019).
(23) X. Wei, Y. Wang, J. Chen, P. Xu, W. Xu, R. Ni, et al, Anal. Chim. Acta 1056, 47–61 (2019).
(24) E. Cequier, R.M. Marcé, G. Becher, and C. Thomsen, Anal. Chim. Acta 845, 98–104 (2014).
(25) H. Deng, X. Li, Q. Peng, X. Wang, J. Chen, and Y. Li, Angew. Chem. Int. Ed. 44(18), 2782–2785 (2005).
(26) L. Lian, X. Cao, Y. Wu, D. Lou, and D. Han, J. Taiwan Inst. Chem. Eng. 44(1), 67–73 (2013).
(27) R. Wang, X. Wang, X. Xi, R. Hu, and G. Jiang, Adv. Mater. Sci. Eng. 2012, 1–8 (2012).
(28) T.T. Baby and S. Ramaprabhu, Talanta 80(5), 2016–2022 (2010).
(29) Z.H. Zhou, J.M. Xue, and J. Wang, J. Appl. Phys. 91(9), 6015–6020 (2002).
(30) X. Wang, Q. Kang, D. Shen, Z. Zhang, J. Li, and L. Chen, Talanta 124, 7–13 (2014).
(31) T.K. Gupta, B.P. Singh, S.R. Dhakate, V.N. Singh, and R.B. Mathur, J. Mater. Chem. A 1(32), 9138–9149 (2013).
(32) S. Brommer, S. Harrad, N. Van den Eede, and A. Covaci, J. Environ. Monit. 14(9), 2482–2487 (2012).
(33) J. Meyer and K. Bester, J. Environ. Monit. 6(7), 599–605 (2004).
(34) L. Pang, P. Yang, L. Ge, J. Du, and H. Zhang, Anal. Bioanal. Chem. 409(5), 1435–1440 (2016).
(35) W. Yan, L. Yan, J. Duan, and C. Jing, J. Hazard. Mater. 273, 53–60 (2014).
(36) A. Jens and B. Kai, Water Res. 40, 621–629 (2006).
Xiyue Wang, Yuanyuan Tian, Lili Lian, Hao Zhang, Bo Zhu, Wenxiu Gao, and Dawei Lou are with the Department of Analytical Chemistry at the Jilin Institute of Chemical Technology, in Jilin, People’s Republic of China. Direct correspondence to: wangxiyue119@163.com
University of Rouen-Normandy Scientists Explore Eco-Friendly Sampling Approach for GC-HRMS
April 17th 2025Root exudates—substances secreted by living plant roots—are challenging to sample, as they are typically extracted using artificial devices and can vary widely in both quantity and composition across plant species.
Thermodynamic Insights into Organic Solvent Extraction for Chemical Analysis of Medical Devices
April 16th 2025A new study, published by a researcher from Chemical Characterization Solutions in Minnesota, explored a new approach for sample preparation for the chemical characterization of medical devices.
Miniaturized GC–MS Method for BVOC Analysis of Spanish Trees
April 16th 2025University of Valladolid scientists used a miniaturized method for analyzing biogenic volatile organic compounds (BVOCs) emitted by tree species, using headspace solid-phase microextraction coupled with gas chromatography and quadrupole time-of-flight mass spectrometry (HS-SPME-GC–QTOF-MS) has been developed.
Extracting Estrogenic Hormones Using Rotating Disk and Modified Clays
April 14th 2025University of Caldas and University of Chile researchers extracted estrogenic hormones from wastewater samples using rotating disk sorption extraction. After extraction, the concentrated analytes were measured using liquid chromatography coupled with photodiode array detection (HPLC-PDA).


