Detective Work, Part 4: Chemical Problems with the Column: Chemical Attack
The silica-based packing in reversed-phase columns is not inert. Here we consider what happens when the mobile-phase pH is too high or too low.
John W. Dolan, LC Troubleshooting Editor.
The silica-based packing in reversed-phase columns is not inert. Here we consider what happens when the mobile-phase pH is too high or too low.
This is the fourth “LC Troubleshooting” column in a series related to problems that we associate with liquid chromatography (LC) columns. We started with a look at the major causes and symptoms of LC column failure (1). In the second instalment (2), we concentrated on problems that are caused by physical problems with the column. Chemical problems (adsorbed sample and chemical attack) are associated primarily with changes in retention and selectivity (peak spacing). Last month (3), we started looking at trouble related to chemical problems with the column, specifically what happens when materials from the sample are strongly adsorbed on the column. This month’s topic is related to what happens when the column packing material is chemically attacked when mobile-phase conditions are beyond the recommended limits.
Reversed-Phase Column Packings
Reversed-phase is the most popular mode of liquid chromatography, with C8 and C18 columns accounting for somewhere around 80% of all columns sold. These columns typically comprise totally porous, spherical silica in the range of <2 µm to 5 µm in diameter. Superficially porous particles are becoming more popular, and particles beyond this size range are also used, but chemically they all behave in the same way in the context of the present discussion.

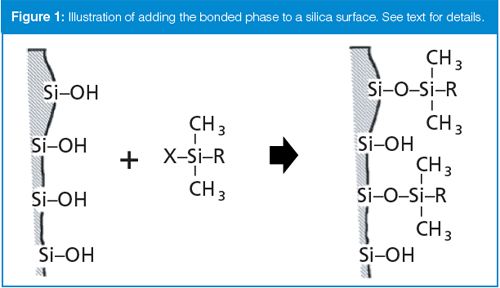
Silica is an amorphous polymer of silicon and oxygen, with a surface that terminates in silanol (Si-OH) groups. These silanols provide an attachment point for the bonded phase. For example, consider a silanol reagent X-Si(CH3)2R, where X is a reactive chloro or ethoxy group and R is C18H37; a C18 bonded phase could be created by forming a “silyl ether” as shown in Figure 1. Because the C18 group is quite bulky, only part of the free silanols on the silica surface are bonded in this reaction because of steric hindrance. Most C18 columns are further bonded through an endcapping process to increase column stability and reduce the population of unbonded silanols. This is the same reaction but uses a smaller trimethyl reagent: X-Si(CH3)3. Even with “complete” bonding and endcapping, approximately half of the silanol surface remains unbonded. As we saw last month (3), these residual silanols can be a source of strong chemical interaction with the analyte or other sample components.
Low-pH Problems
The bonded phase illustrated in Figure 1 is quite easy to form. Unfortunately, under the right conditions, it is also easy to destroy. When the mobile-phase pH is too low, the silyl ether on the right of Figure 1 can be hydrolyzed, gradually returning the surface to the condition at the left of Figure 1. This hydrolysis is generally a concern for mobile-phase pH < 2 for most reversed-phase columns, although there are exceptions as noted below.

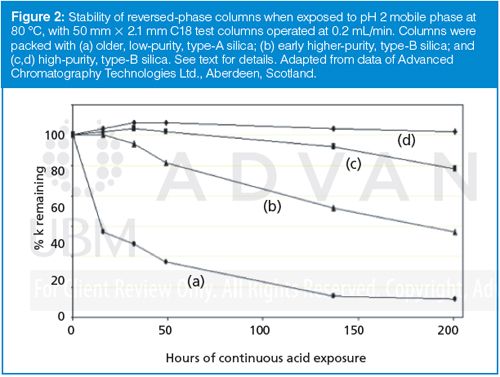
The effect of continued exposure of the column to low pH is illustrated in Figure 2. Here the loss of bonded phase is followed by measuring retention of a hydrocarbon solute, such as phenylhexane, that is retained only by hydrophobic interaction with the bonded phase. The initial retention is normalized to 100%, and as retention drops over time, it is an indication of the loss of bonded phase. The conditions in Figure 2 are quite severe: 0.1% trifluoroacetic acid (pH ≈ 2) and 80 °C. The performance of four C18 LC columns is shown: a column using older, type-A, low-purity silica typical of most columns introduced before 1990; one of the early high-purity, type-B silicas introduced in the early 1990s; and examples of today’s high-purity, type-B silica columns. You can see that the type-A column is not at all stable by today’s standards, and while the early type-B column is an improvement, it also has a limited lifetime under these conditions. The current-day high-purity type-B columns are quite stable, but it should be recognized that any column will eventually deteriorate under sufficiently low pH if the exposure time is long enough. Before we leave Figure 2, let’s consider what 200 h of exposure to these conditions means. The test columns had dimensions of 50 mm × 2.1 mm, with a column volume of ≈100 µL; the flow rate was 0.2 mL/min, so the exposure rate was two column volumes per minute. The experiment went for 200 h, which is 12,000 min or 24,000 column volumes. For the traditional 150 mm × 4.6 mm column, this test would be the equivalent of running 36 L of hot acid through the column! If samples with a retention factor of 2 were run in a continuous sequence with a one-column-volume pause between injections, you could run 6000 samples during the 200 h test period. All this is to say that today’s LC columns based on high-purity silica are amazingly stable.
What would you expect to see as the bonded phase is gradually hydrolyzed off the column? As is illustrated in Figure 2, retention times would generally drop as the hydrophobic stationary phase is lost. However, more of the bare silica surface would be exposed during this process, so the strong polar interactions between polar sample functional groups and the silanol groups would be expected to increase. This would likely change selectivity and increase peak tailing, as discussed in last month’s “LC Troubleshooting” (3). Furthermore, as the bonded phase is hydrolyzed from the surface, it has to go somewhere. This gradual loss of bonded phase is called column bleed. Column bleed is a special problem with mass spectrometry (MS) detection - the hydrolyzed bonded phase is not volatile, so it will contaminate the interface at the point of solvent evaporation, and in some cases analyte adducts or complexes with bonded phase contaminants can confuse interpretation of the collected sample spectra. In any event, running with mobile-phase conditions under which the column is not stable would cause changes in retention, selectivity, and peak shape - all of which are undesirable for robust LC methods.
High-pH Problems
Hydrolysis of the bonded phase, which is unstable at sufficiently low pH, is not a concern when the pH is greater than 2–3 or so. However, at sufficiently high pH, the underlying silica becomes soluble and will dissolve out from under the bonded phase. Most silicas are stable below pH ≈ 8, so pH 8 is a somewhat arbitrary upper limit for mobile phases for generic reversed-phase columns. As noted below, there are many columns available today that can operate successfully with higher-pH mobile phases.
Short-term operation of silica-based columns at pH > 8 will probably not generate dramatic changes. There will be a gradual change in the surface of the column as more silanol groups are exposed and bleed of the bonded phase (perhaps with additional silica attached). These processes will give similar results to the loss of bonded phase discussed in the previous section: changes in retention, peak spacing, peak tailing, and possible additional problems if MS detection is used.

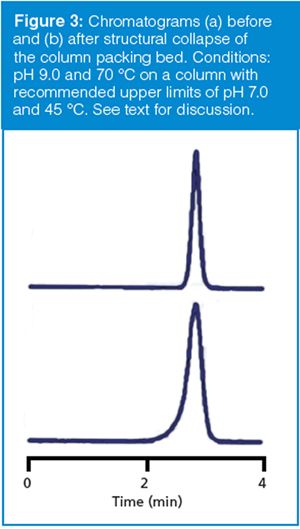
After sufficient exposure to high-pH mobile phase, the structural stability of the column will suffer, with physical collapse of the column packing bed at some point. A typical symptom of column collapse is shown in Figure 3. The upper chromatogram represents a normal chromatogram after approximately 500 injections; the lower one is the next injection. The lower peak can be seen to front strongly, and although it is not apparent from the chromatogram because of height normalization, the peak area is the same. Figure 3 is an example of operating a column for too long under too high a pH. The mobile phase is pH 9.0 and the column temperature is 70 °C. The column was designed for low-pH work, and the column care-and-use instructions clearly state the column limits (which were not followed . . .): the allowable pH range is 2–7, the temperature range is 20–45 °C, and a special caution regarding column stability is noted when both the pH and temperature limits are approached.

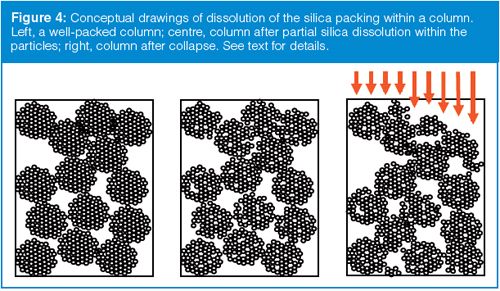
The cartoon of Figure 4 gives us a concept of what is likely occurring when symptoms such as those of Figure 3 are observed. The porous silica particles in the column are made up of much smaller nanoparticles much like the popcorn kernels in a popcorn ball. The spaces between these smaller particles are the pores in the packing. The left-hand column of Figure 4 represents a normal, tightly packed column. When the pH is too high, the particles dissolve, but the 5-µm packing particles do not dissolve sequentially from the outside inward as would happen when peeling layers off an onion. Rather, the mobile phase has full access to the pores in the particles, so the nanoparticles dissolve, gradually reducing the structural integrity of the larger particle. This is illustrated in the middle column of Figure 4, where the inner structure of some of the larger particles is missing. At some point, this particle structure becomes so fragile that any shock to the system, such as the pressure shock of cycling the sample injection valve, can crush a particle. As one particle collapses into another, it can result in a settling of the packing bed, as shown in the right column of Figure 4. If the collapse is even, there will be a void at the top of the column that can cause mixing and peak broadening. If it is uneven, as in Figure 4, it is possible for some sample molecules to flow further down the column before they reach the packing. This distorted profile is shown for the right column by the arrows at the inlet. This behaviour would give some sample molecules a head start in the separation process, so they would lead the main sample band, resulting in a fronting peak as shown in Figure 3. At this point, there is nothing that can be done to salvage the column. Although you might try to fill in the void at the column inlet, it will have no effect on the damage done to the remaining particles in the column. The best advice to avoid this kind of problem is to read (and follow) the directions that come with the column! (For further discussion on the example of Figure 3, see reference 4.)
The pH Sweet Spot
Silica makes a very convenient substrate for support of the bonded phase in reversed-phase LC, but it does have limitations, as discussed above. For most reversed-phase columns, it is safe to assume that they are stable in the 2 < pH < 8 range. As was shown in Figure 2, the newer, higher-purity, type-B silica columns are more stable than the older, type-A columns. If you are using a method on an older type column, it may be a good idea to be overly cautious and set the range to 2.5 < pH < 7.5. It should be noted that column failure from inappropriate mobile-phase pH does not take place instantaneously, but is a gradual process over time; even the dramatic failure of the column of Figure 3 took ~500 injections to occur.
Today there are many columns that have been designed for extended pH ranges. Some of these will perform over 1.5 < pH < 12 or other ranges advertised by the manufacturers. One way to extend the upper pH range is to use “hybrid” particles that are not pure silica, but are modified to be less soluble at high pH. Some manufacturers make particles with proprietary treatment of the silica surface or some kind of a coating on the silica that protects the silica from attack by the mobile phase. These extended-pH columns are widely advertised; consult the manufacturer’s literature for descriptions of pH tolerance and (sometimes) a description of the physicochemical process used to protect the column.
There are hundreds of different reversed-phase columns on the market today, and sorting through the offering can be a daunting task. Whether you are using a column that is new on the market or one that has been available for decades, it is always a good idea to follow the age-old advice, “if all else fails, read the directions”. Every column should have care-and-use instructions either packed in the column box or available on the column manufacturer’s web site. As a final note, remember that no matter how the silica is manufactured, if you use it long enough at extreme pHs, it will die, so don’t expect any column to be immortal.
References
- J.W. Dolan, LCGC Europe28(11), 612–615 (2015).
- J.W. Dolan, LCGC Europe28(12), 652–656 (2015).
- J.W. Dolan, LCGC Europe29(1), 28–30 (2016).
- R.D. Morrison and J.W. Dolan, LCGC North Am.23(6), 566–574 (2005).
“LC Troubleshooting” Editor John Dolan has been writing “LC Troubleshooting” for LCGC for more than 30 years. One of the industry’s most respected professionals, John is currently the Vice President of and a principal instructor for LC Resources in Lafayette, California, USA. He is also a member of LCGC Europe’s editorial advisory board. Direct correspondence about this column should go to: “LC Troubleshooting”, LCGC Europe, Hinderton Point, Lloyd Drive, Ellesmere Port, CH65 9HQ, UK, or e-mail the editor-in-chief, Alasdair Matheson, at amatheson@advanstar.com

New TRC Facility Accelerates Innovation and Delivery
April 25th 2025We’ve expanded our capabilities with a state-of-the-art, 200,000 sq ft TRC facility in Toronto, completed in 2024 and staffed by over 100 PhD- and MSc-level scientists. This investment enables the development of more innovative compounds, a broader catalogue and custom offering, and streamlined operations for faster delivery. • Our extensive range of over 100,000 high-quality research chemicals—including APIs, metabolites, and impurities in both native and stable isotope-labelled forms—provides essential tools for uncovering molecular disease mechanisms and exploring new opportunities for therapeutic intervention.
New Guide: Characterising Impurity Standards – What Defines “Good Enough?”
April 25th 2025Impurity reference standards (IRSs) are essential for accurately identifying and quantifying impurities in pharmaceutical development and manufacturing. Yet, with limited regulatory guidance on how much characterisation is truly required for different applications, selecting the right standard can be challenging. To help, LGC has developed a new interactive multimedia guide, packed with expert insights to support your decision-making and give you greater confidence when choosing the right IRS for your specific needs.

.png&w=3840&q=75)

.png&w=3840&q=75)


.png&w=3840&q=75)


.png&w=3840&q=75)


