Characterizing SEC Columns for the Investigation of Higher-Order Monoclonal Antibody Aggregates
Special Issues
When selecting the optimum phase for SEC separations, several key column parameters must be considered carefully.
Ronald E. Majors1andLinda L. Lloyd2, 1Column Editor Emeritus for LCGC, 2Agilent Technologies, Church Stretton, Shropshire, UK.
With many new biopharmaceuticals now being developed, robust analytical methods are needed to ensure that these protein-based drugs are of high purity and safe with a minimum amount of side effects. Size-exclusion chromatography (SEC) is an important technique for investigating purity and is useful to identify and monitor protein aggregation, which can have economic and immunogenicity effects. This article discusses those column parameters that are most important in the selection of the optimum phase for SEC separations.
The development of biologicalâbased pharmaceuticals is growing. In 2012, of the top selling 200 drug products in the United States 25% were based on a biological entity (1). It is anticipated that by 2020 52% of all top selling drugs will fit into this category (2). These continuing trends will have strong implications for the analytical techniques used to characterize these largeâmolecule products. Chromatographic separations will still play a key role not only in the purification of these biologics, but also in the analysis from the early phases of product development to the final quality control of formulations. Continued improvements in liquid chromatography (LC) column materials to cope with higherâmolecular-weight biopharmaceuticals will be needed. Many of the attributes for optimized chromatographic packings that have been developed for smallâmolecule drugs will not always directly extrapolate to those needed for these biological-based drugs. For example, LC separations requiring nondenaturing conditions will not tolerate high concentrations of organic mobile phases or, when LC coupled to mass spectrometry (MS) is used, high amounts of nonvolatile salt buffers. New workflows may be required to ensure that the analysis conditions do not cause degradation of sensitive biomolecules. The complexity of new biological drugs may require much greater levels of resolution than was required for well characterized smallâmolecule drugs. Two-dimensional (2D) chromatographic separations may become the norm for some of these drugs, especially when biosimilars are undergoing characterization.
Monoclonal Antibodies and Aggregation
Monoclonal antibodies (mAbs) are in favour since they are highly specific and often bind to a single antigen target. The cellular processes to produce mAbs are complex, however, and multistep purification procedures subject the protein to numerous changes in their environment. Like many recombinant proteins that are inherently unstable, the increased degree of handling of the mAbs may cause conformational changes and increased levels of aggregation with the possibility of visible precipitation and invisible soluble aggregates. At the molecular level, the process of mAb aggregation is complex with a possible loss of its three-dimensional (3D) structure by interacting with other protein molecules. Aggregation can be reversible or irreversible and, in some cases, the protein can become irreversibly denatured thereby losing its bioactivity. There are many mechanical stress and chemical conditions that can cause or change aggregation including storage, interactions with surfaces or solids, flow or agitation, and temperature changes. An earlier paper (3) provided more details of the upstream and downstream processes that can affect mAb aggregation including the method of analysis.
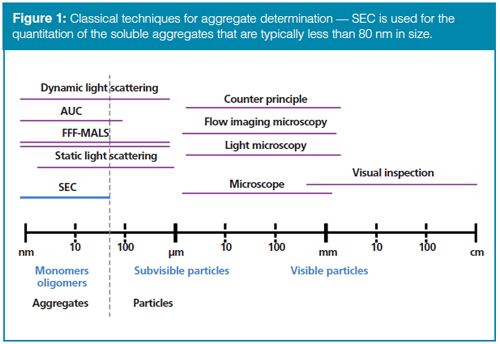
The impact of aggregation on the process economics (product yield), efficacy (decreased bioactivity), and immunogenicity (recipient immune system response) are considerable, thus, reliable and accurate methods of analysis and quantitation are required. Although there are a number of traditional methods commonly used to measure aggregation (see Figure 1), the technique of size-exclusion chromatography (SEC) is a required technique for soluble aggregation analysis and quantitation.
Size-Exclusion Chromatography
Unlike all other modes of high performance liquid chromatography (HPLC), pure SEC involves absolutely no interaction between the analyte and the packing material. The molecules are separated based on differences of size in solution, their hydrodynamic volumes. Figure 2 shows a schematic of the differential flow paths as a function of molecular size along with the associated chromatogram. The SEC packing material consists of neutral, porous, spherical particles with a defined pore size. The “fit” of the molecule into the porous structure will determine its residence time inside of the packing. The largest molecule, depicted in green in Figure 2, will not permeate very far into the pore, if at all, and it will move down the packed bed virtually unretained and will be eluted first from the column. The blue molecule, being smaller in size, will permeate further into the pore, spend more time inside the packing, and will be eluted from the column after the largest green molecule. The red molecule, being the smallest in size, will permeate well into the porous packing and spend the most residence time there and will be eluted after the blue molecule. Thus, as depicted in the chromatogram of the right hand side of Figure 2, the order of elution is green (large), blue (intermediate), and red (small).
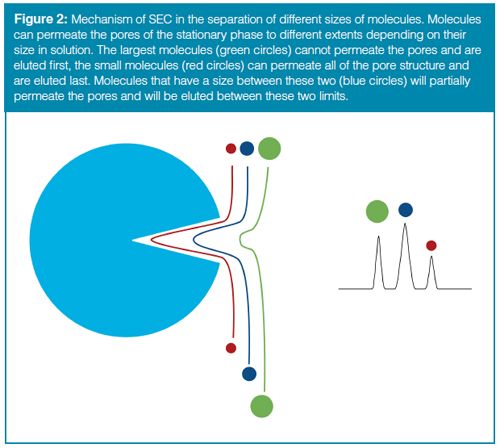
The pore size of an SEC column will define the molecular sizes that can be resolved - anything that is bigger than the pore opening will be excluded and all molecules equal to or larger than the pore will be eluted at the exclusion volume (Ve), sometimes referred to as the interstitial volume (Vi), of the column and the smallest molecules that permeate all of the pore volume will be eluted at the total permeation volume (V0). These two volumes define the elution volume–resolving range of the column and all separation must take place within these two volumes. Thus, SEC is quite different from the other LC modes that can have the separation take place over many column volumes. Also, for SEC, the elution order is unlike other LC modes such as reversed phase chromatography where the larger, more-hydrophobic molecules are eluted last and the smaller, more-hydrophilic molecules are eluted first.
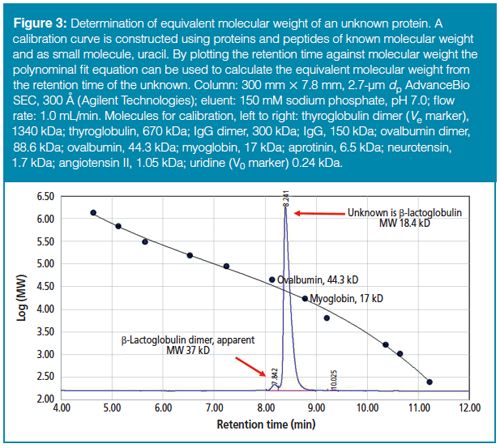
How is the SEC data used? Most frequently, a calibration curve is first generated (see Figure 3). In this plot, the log of the molecular weight (MW) of known protein–peptide standards are plotted versus retention time (or elution volume). In Figure 3, a protein–peptide standard mix consisting of various known molecular weight compounds was used to make up this plot. The proteins, peptides, and their respective MWs are identified in the figure caption. The calibration plots are generally-fitted to a polynomial. Because the SEC separation is based on the hydrodynamic volume of a molecule in solution and not solely on MW, any extrapolated MW is referred to as apparent MW. In this example, an unknown sample solution of protein containing a small amount of its dimer was injected onto a modern SEC column containing a packing with a 300-Å pore size. By noting the retention time on the calibration curve of 8.6 min, the apparent MW of the main compound was determined to be 18.4 kDa, which coincides with the MW of β-lactoglobulin. The small peak eluted just before the major peak has a retention time of 8.3 min, which from the calibration curve is determined to have an apparent MW of 37 kD and thus was estimated to be the β-lactoglobulin dimer. By measuring the relative peak areas one could estimate the level of dimer in the original solution. For an absolute MW, another method beyond ultraviolet (UV) or refractive index detection must be used. Most often a light scattering (LS) detector is used to provide absolute MW and also provides an increased sensitivity for the higher MW aggregates. A mass spectrometer can also be used to measure an absolute MW and provide structural identification for unknown impurity peaks.
Characterization of SEC Columns for mAb Analysis
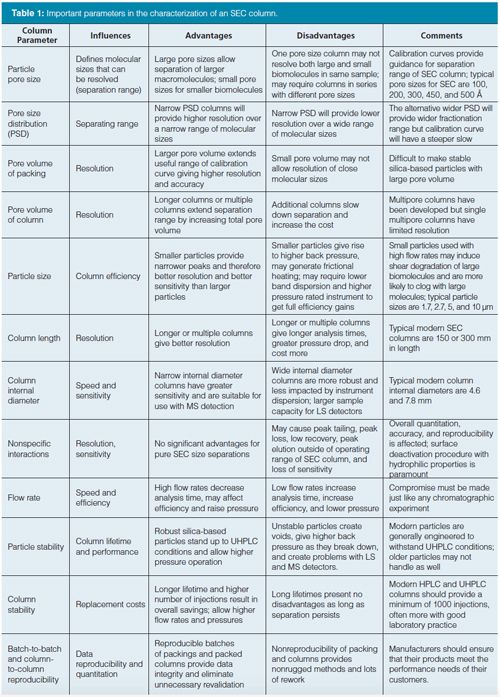
Now that we have introduced the concept of SEC and how the separation mode can be used to separate biomacromolecles and higher order earlier eluted aggregates, we would like to look at those characteristics of packed SEC columns that can be used to optimize their ability to provide the best resolution of mAb monomers from higher order aggregates in the shortest possible time. The overall desire is for the SEC column to deliver accurate separation and precise quantitation. A typical SEC column has notable parameters that define its separation characteristics, some unique to the SEC mode and some that are well known chromatographic principles. Table 1 provides typical column parameters that are useful for comparison with advantages and disadvantages listed. Out of this large number of parameters, we shall now look at the more important ones and see if these parameters can be tested to meet the separation requirements.
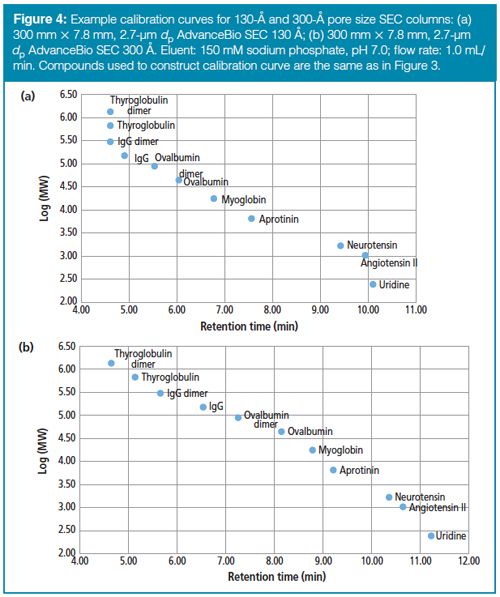
Effect of Pore Size on SEC Resolution: One must select the proper pore size to allow adequate resolution for molecules of interest. Figure 4 shows the results of a calibration curve of the standard protein mixture on two different columns with the same dimensions but with different pore sizes, 130 Å and 300 Å. The molecular weights of the compounds in the protein–peptide test mixture goes from the thyroglobulin dimer (MW 1340 kDa) to the V0 marker uridine (MW 0.24 kDa). For the smallerâporeâsize column, the largest molecules IgG dimer, thyroglobulin, and the thyroglobulin dimer are totally excluded from all the pores of the packing and are eluted in a single volume (Figure 4[a]). Other more moderate sized proteins and dimers are separated nicely on this column. For the larger-pore-size column (300 Å), the entire range of proteins and peptides can be adequately resolved and it would be the column of choice if a large range of proteins and peptides were encountered (Figure 4[b]). In addition, the larger-pore-size column also possesses a larger pore volume, which allows for better resolution throughout the chromatogram. Sometimes one can achieve improvements in resolving range by coupling two columns with different pore sizes in series - say a 200-Å column and a 450-Å column - but run times are increased as is added expense in purchasing two columns instead of one. For increased resolving power, one can also add additional columns of the same pore size to increase the total pore volume and hence resolution between peaks.
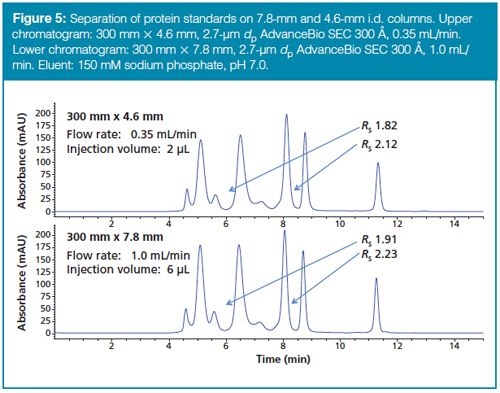
Effect of Column Dimensions and Flow Rate on SEC Separations: In recent years, faster separations became the name of the game. As the number of samples increase and laboratory personnel are pushed for higher productivity, everybody wants to do things faster. In the past, SEC columns were considered somewhat fragile, especially when the soft gels were used in low-pressure columns. Most laboratories practising HPLC and ultrahigh-pressure liquid chromatography (UHPLC) have highâpressure systems available that can achieve fast separations in a matter of minutes. Although SEC has some limitations of column dimensions (smaller column lengths and volumes mean lower resolution because of decreased pore volume availability), there has been a tendency to shift from the standard 7.8-mm i.d. SEC columns to those diameters more popular in HPLC, such as 4.6 mm. Figure 5 shows a separation of protein standards on 300-Å columns 300 mm in length, but with 7.8-mm and 4.6-mm internal diameters. The 7.8-mm column run at 1.0 mL/min gave a separation time of just under 12 min as did the 4.6-mm column run at same linear velocity (0.35 mL/min). Compared to the 7.8âmm i.d. column, the overall resolution for the 4.6-mm i.d. column was barely impacted for these proteins. However, the amount of injected sample required for a 4.6-mm i.d. column is smaller so in sampleâlimited situations, a 4.6-mm i.d. column would be preferred. The injected volume is adjusted downwards based on the inverse square of the column radii. In addition, a lower flow rate for the 4.6âmm i.d. column saves mobile phase. For applications requiring the use of less-sensitive detectors including light scattering and refractive index detectors and longer UV detector wavelengths (when using mobile-phase eluents that have a high background at lower wavelengths, for example), then 7.8âmm i.d. columns offer the capability to handle much larger sample volumes.
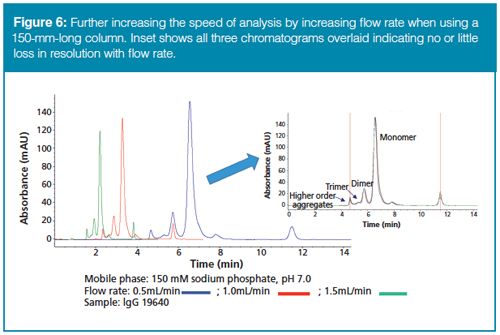
Newer SEC packings that are more rigid and robust can withstand higher operating pressures. Thus, separation times can be shortened even further by using higher flow rates. Figure 6 shows results using a 4.6-mm i.d. column with an even shorter column length of 150 mm, which in itself allows for a decrease of 50% of the run time observed with the popular 300 mm columns. A series of chromatograms of an IgG sample containing dimers, trimers, and higher order aggregates was generated at three flow rates: 0.5, 1.0, and 1.5 mL/min; the total run times were determined to be 12, 6, and 3 min, respectively. The inset chromatogram included in Figure 6 shows that all three chromatograms - when normalized for time and aligned - gave virtually complete overlap without any sacrifice in resolution. Thus, an increase in sample throughput of a factor of three was achieved while the chromatographic resolution was maintained.
Particle Size of SEC Packing: As with any form of chromatography, the particle size is an important parameter. In aqueous SEC, sometimes referred to as gel filtration chromatography, original particles were quite large (in the tens of micrometres) and quite soft (for example, polydextran and agarose). Modern SEC packings are closer to the range of other HPLC packings, with 5 µm having been the standard diameter for many years. More recently, particles in the 3-µm range have become more popular and even a few sub-2-µm packings have been introduced. The larger-pore silica-based SEC packings (>300 Å) become more fragile and sub-2âµm particles generate too high of a pressure drop for long-term stability, so most manufacturers have settled on particle diameters of 2.5–3 µm for these products.
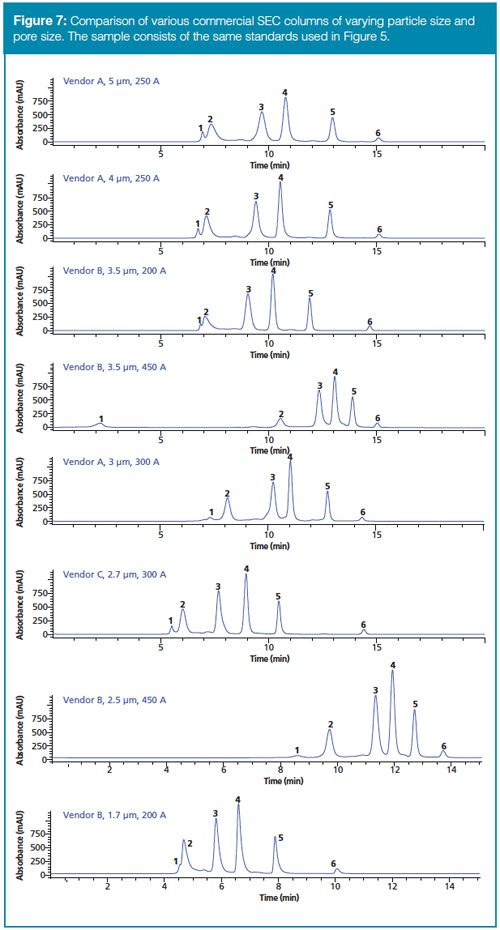
Of course, in SEC, particle size is only part of the equation. The pore size comes into play to a greater extent than in other LC modes. This can be clearly seen in Figure 7 where several popular commercial products of different particle sizes and pore sizes are compared. The sample was a standard protein mixture. Figure 7 is organized by the largest particle size at the top and the smallest currently available particle size at the bottom. The pore sizes are shown next to each chromatogram. The column dimensions were 300 mm × 7.8 mm, except for the two bottom chromatograms that were obtained using columns with smaller internal diameters, 4.6 mm, which are especially designed for more-sensitive methods. Although, the particle size of the smallest SEC packing is 1.7 µm, the pore size (200 Å) is not sufficiently large enough to resolve the thyroglobulin dimer from thyroglobulin and thus for the purposes of this study, a largerâpore-size column would be required. To resolve the monomer and dimer, one would have to resort to a larger-pore-size packing (300 Å or 450 Å) with a larger particle size. It is readily apparent, as one scans down the figure for the various columns, particle size appears to have a minimal influence of resolution for this test mix while pore size is more influential.
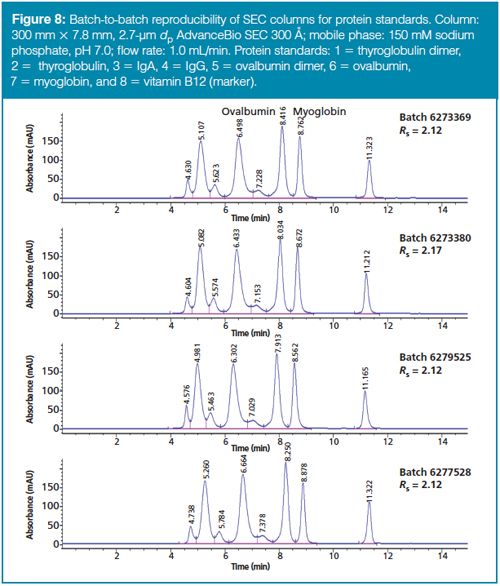
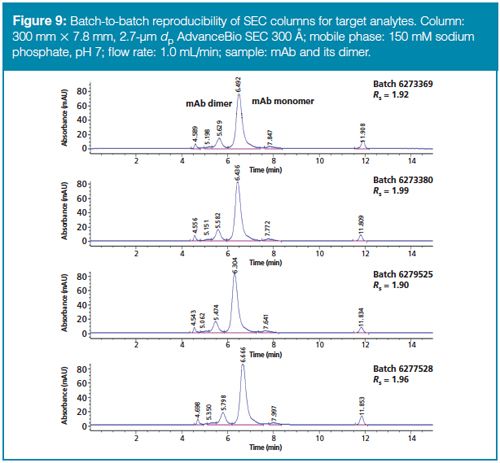
Batch-to-Batch and ColumnâtoâColumn Reproducibility: For validated methods, it is imperative that each batch of column packing behave like its predecessors. As part of any ruggedness test protocol, most biochromatographers are required to investigate multiple batches (at least three) and multiple columns to ensure that the method can be reproduced over a long period of time. Figures 8 and 9 show four chromatograms indicating the reproducibility of four batches of manufactured material. Batches were tested with a standard protein mix (Figure 8) as well as a test of the target analytes that are higherâorder aggregates from the monomeric mAb (Figure 9). The resolution of the myoglobin–ovalbumin pair was used for batch-to-batch comparison (Figure 8), while the resolution of the mAb dimer and mAb monomer was used for the target analyte test (Figure 9). Rather than testing each column with a series of proteins and mAb aggregate samples, for quality control purposes, an inert small molecule is used to ensure that the column is packed according to specification. Therefore, users can be assured that the column that is received has not seen any protein sample. In addition, to prevent any possibility of bacterial growth during shipping or storage, most SEC columns are shipped and stored in a solvent such as a 0.02% sodium azide or a solvent rich in organic solvent. Before use, columns from any vendor should be thoroughly rinsed with the mobile phase that will be used for SEC.
Particle, Phase, and Column Stability: SEC columns are expensive, and all precautions taken with any HPLC or UHPLC column should also be observed with SEC columns. Most of the aqueous SEC columns used for protein–peptide size separations are based on spherical silica gel, which has been produced by any number of synthesis procedures. Silica gel is a more rugged packing than the soft gels of yesteryear, but nevertheless does require some care in its use. SEC columns do have defined pH limits, upper pressure limits, upper temperature limits, and so on - the biochromatographer should be familiar with these attributes before use. To cut down or eliminate nonspecific surface interactions, silica gel SEC columns require some surface deactivation by bonding, coating, or building into the phase strong hydrophilic characteristics. The bonding of the diol functionality appears to be the favoured approach to provide a hydrophilic surface, but newer approaches such as bonding with a hydrophilic polymer may prove to be more successful. If proteins are allowed to interact with the silica surface, sample integrity may be compromised. Tailing, irreversible adsorption with subsequent low recovery, and nonreproducible separations are signs of possible nonspecific interactions. Repetitive injections of a test protein sample should be performed. Peak areas should be reproducible with less than a 1% relative standard deviation.
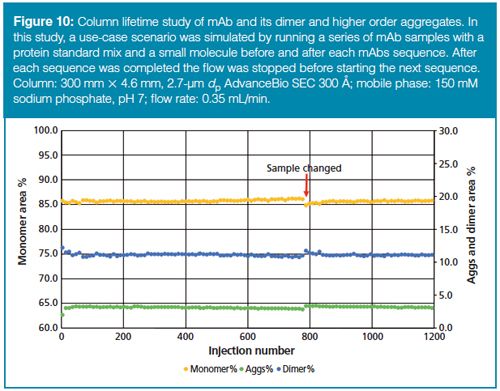
Column lifetime is another parameter of great interest. Besides the expense of replacing a dead column, the time to re-equilibrate and recalibrate the column and running necessary blanks should also be taken into account. Modern SEC columns, if properly treated, should provide at least 1000 injections. Lifetimes can be even further extended by the use of guard columns, which are a lot less expensive to replace and, as long as connections are minimized to prevent band broadening, should have no effect on the separation. To test an SEC column, a series of 1200 injections of a mAb containing dimers and higher order aggregates (depicted as aggs in the figure) was made over a period of 10 days. Although not shown, the peaks were well resolved and the resolution of the monomer–dimer changed about 3% over the time period. Figure 10 shows that the quantitation for monomer, dimer, and aggregates was still reproducible after 1200 injections, and the quantitation is consistent over the lifetime of the column.
Application of Optimized SEC Column to a Stressed Monoclonal Antibody and Biosimilar - A Typical Biopharma Application: To test an SEC column on a real sample, the innovator drug rituximab, a medication to treat non-Hodgkin’s lymphoma or chronic lymphocytic leukemia and the first monoclonal approved by the United States Food and Drug Administration (FDA) in 1997, and a biosimilar were subjected to forced degradation studies. The resulting breakdown products were separated by SEC. Samples of the mAbs were prepared by first diluting them in mobile phase and then a pH stress test was performed by adding hydrochloric acid to the sample solutions to adjust the pH to 1.0, then adding sodium hydroxide to adjust the pH to 10.0, and finally getting the pH back to 6.0 by the addition of hydrochloric acid (4). The resulting solution was incubated at 60 °C for 60 min. Figures 11(a) (innovator drug, red trace) and 11(b) (biosimilar drug, red trace) show the initial profile of each drug determined by SEC and both were found to give a single, fairly symmetrical peak showing no indication of aggregation or degradation.
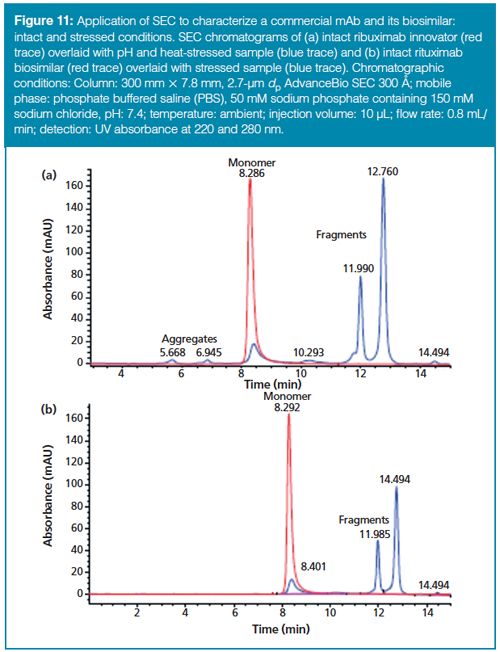
After the pH and heat-stressed experiments were performed, the SEC profiles were dramatically changed. The innovator drug (Figure 11[a], blue trace) showed evidence of aggregate formation as can be seen by the small higherâMW aggregate peaks eluted before the monomer. Additional lowerâMW degradation peaks were observed after the elution of the monomer. For the rituximab biosimilar (Figure 11[b], blue trace) no evidence of higherâorder aggregates was found but lower-MW fragments could be observed in the SEC profile. In both cases, a relative decrease in the main mAb peak was observed, indicating a molecular breakdown caused by the stress experiments. More information about these drugs and quantitative results can be found in reference 5. This series of experiments shows that SEC can be very helpful in the process of mAb-based product development especially for the quantitation of dimer and higher-order aggregates.
Conclusion
As the shift in pharmaceutical drug development towards biologicalâbased entities continues, HPLC and UHPLC column technology will have to shift with the market demands. Columns that were suited for small molecules will not necessarily be useful for the larger biomolecules, and older biocolumns that have been used for years may not have the proper characteristics to meet the demands required for treatment of newer biopharmaceuticals. In this article, we have tried to show the important characteristics that impact the performance of an aqueous SEC column, particularly one that is suited for the separation and quantitation of a monoclonal antibody and higher aggregates such as dimers, trimers, and other high-molecular-weight species. Some of the characteristics are familiar chromatographic principles (such as column length, particle size, and flow rate) but others are unique to SEC (for example, pore size, pore volume, and nonspecific interactions). It is anticipated that further developments in SEC columns for biomolecules will come about in future years with further research and development for smaller particles and tuned inert porous surfaces underway. It should be noted that, because of the fixed retention mechanism of SEC, a single column and mobile phase can be used for multiple types of samples requiring a size separation including fragment analysis, separation of antibody-drug conjugates, PEGylated proteins, and general protein and peptide separations.
References
- http://cbc.arizona.edu/njardarson/group/top-pharmaceuticals-poster.
- World Preview Outlook to 2020, EvaluatePharma (2014).
- L. Lloyd, LCGC Europe 27(s11), 25–29 (2014).
- B. Basak Kukrer, V. Filipe, E. van Duijn, P.T. Klasper, R.J. Vreeken, A.J.R. Heck, and W. Jiskoot, Pharm. Res. 27,
- 2197–2204 (2010).
- M.S. Palaniswamy, “Separate and Quantify Rituximab Aggregates and Fragments with High-Resolution SEC,” Agilent Technologies, Application Note 5991-6304EN, October, 2015.
Disclaimer
For research use only. Not for diagnostic purposes. This information is subject to change without notice.
Ronald E. Majors is Column Editor Emeritus for LCGC, and an analytical consultant in West Chester, Pennsylvania, USA. Linda L. Lloyd is with Agilent Technologies in Church Stretton, Shropshire, UK. Direct correspondence to: ronald.e.majors@gmail.com

New Method Explored for the Detection of CECs in Crops Irrigated with Contaminated Water
April 30th 2025This new study presents a validated QuEChERS–LC-MS/MS method for detecting eight persistent, mobile, and toxic substances in escarole, tomatoes, and tomato leaves irrigated with contaminated water.

.png&w=3840&q=75)

.png&w=3840&q=75)


.png&w=3840&q=75)


.png&w=3840&q=75)


