Capillary Electrophoresis in the Biopharmaceutical Industry: Part II
LCGC North America
In some biopharmaceutical companies, CE has virtually replaced gels for electrophoretic analyses. But challenges include management acceptance, technical hurdles, and the need for training.
The previous installment of "Directions in Discovery" discussed the growing use of capillary electrophoresis (CE) to replace gel-based analyses in the biopharmaceutical industry, and pointed out the advantages of CE in terms of obtaining quantitative information with good reproducibility, fully automating routine analysis, and eliminating the requirement for large volumes of toxic reagents (1). The focus of the first column was the replacement of sodium dodecyl sulfate–polyacrylamide gel electrophoresis (SDS-PAGE) by CE using entangled-polymer sieving systems, a technique known in the biopharmaceutical industry as CE-SDS. This second column will explore the remaining techniques that are replacing gel electrophoresis, including capillary isoelectric focusing (cIEF) and capillary zone electrophoresis (CZE) with laser-induced fluorescence (LIF) detection for glycan analysis. Like CE-SDS, these techniques can be applied to a wide range of samples, and so can be developed as generic or platform methods.

Tim Wehr
Moving IEF to the Capillary Format
Gel IEF suffers from the same limitations as those described above for SDS-PAGE. For this reason, many labs in the biopharmaceutical industry have turned to performing IEF in the capillary format.

The initial steps in cIEF are analogous to gel IEF (Figure 1). The sample is mixed with carrier ampholytes and the capillary is filled with the sample plus ampholyte solution. One end of the capillary is immersed in an anolyte solution (typically, dilute phosphoric acid), and the other end is immersed in catholyte (typically, dilute sodium hydroxide). Upon application of high voltage, carrier ampholytes migrate to form a stable pH gradient, and proteins migrate to the region of the gradient where they are isoelectric, and become highly focused. The focusing process typically is complete within a few minutes. Because commercial CE systems use on-tube detection at a fixed point along the capillary, cIEF requires some means of mobilizing focused zones across the detection point. This mobilization process is unique to cIEF. Mobilization can be accomplished by pressurizing the capillary inlet, applying a vacuum to the capillary outlet, or by adjusting the liquid levels at the capillary outlet. This latter technique, termed gravity mobilization, is pictured in the schematic in Figure 1.
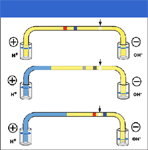
Figure 1: Schematic of the cIEF process. The upper trace represents the completion of focusing, and the lower traces represent mobilization. Gravity mobilization is pictured here. Note the reduced level in the catholyte reservoir during mobilization and the displacement of anolyte into the capillary.
Mobilization also can be accomplished by changing the composition of either the anolyte or the catholyte. This causes the pH gradient to shift along the capillary with time so that proteins move electrophoretically across the detection point. This is variously termed electrophoretic mobilization, ion-addition mobilization, or chemical mobilization. The separation pattern in cIEF is subject to a large number of variables, and obtaining good results requires the use of internal standards, preferably at least two standards bracketing the mobilization time of the analyte proteins.
The major applications of cIEF in the biopharmaceutical industry are the determination of protein isoelectric point (pI) and monitoring protein charge heterogeneity (2). An example of the first application is presented in Figure 2. Three variants of proteins containing zero, one, or two terminal lysines are resolved by cIEF with internal standards bracketing the analyte proteins. A plot of migration time versus pI permits estimation of the isoelectric points of the three variants.
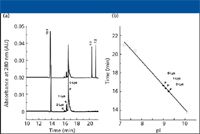
Figure 2: Determination of apparent pI values of protein variants differing in the number of terminal lysine residues. (a) Electropherograms of a recombinant monoclonal antibody (rhuMab) and pI markers and (b) plot of pI values against migration times. Open squares, pI markers 7.2, 7.7, and 10.1. Closed circles, antibody variants shown in (a). Figure provided by Genentech, Inc.
Charge variants can arise from the loss of terminal lysines, deamidation of glutamine residues, or the presence of variable numbers of sialic acids at glycosylation sites. The Fc fusion protein analyzed by cIEF in Figure 3 exhibits approximately 28 charge variants (3). Treatment of the protein with carboxypeptidase (to remove terminal lysines) or neuraminidase (to remove sialic acids) simplifies the cIEF pattern. Moreover, a comparison of the pattern following treatment with the two enzymes reveals that the majority of charge heterogeneity in this protein arises from variable numbers of charged sialic acid residues.
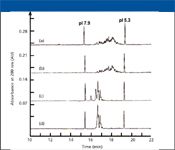
Figure 3: Determination of charge heterogeneity in an Fc fusion protein using cIEF. (a) Intact sample, (b) sample treated with carboxypeptidase, (c) sample treated with neuraminidase, and (d) sample treated with carboxypeptidase and neuraminidase. Reproduced from reference 3 with permission from Vieweg & Sohn Verlagsgesellschaft GmbH.
The requirement for mobilization of focused proteins in a conventional CE instrument lengthens analysis time, can compromise resolution by allowing diffusional band broadening during transition from focusing to mobilization, and can increase the risk of protein precipitation. Imaging cIEF, a relatively new approach being commercialized by Convergent Bioscience (Toronto, Ontario, Canada), eliminates the need for mobilization (4). A UV-transparent capillary is used, and an entire capillary length is illuminated with light from a xenon source and imaged by a charge-coupled device (CCD) camera (Figure 4). Because mobilization is not required, analysis time is much shorter, and the risk of precipation is reduced. In addition, focusing can be monitored in real time, which can be an aid in method development and optimization.
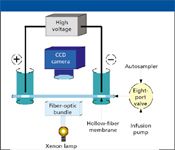
Figure 4: Schematic diagram of imaging cIEF. Figure provided by Convergent BioScience, Ltd.
Glycan Analysis by CE-LIF
The presence of carbohydrates and their structure is known to influence the biological activity of protein therapeutics, so it is of great importance to characterize the carbohydrate content of a therapeutic monoclonal antibody (Mab) and the batch-to-batch consistency of the glycosylation (5). The occupancy of glycosylation sites and the structure of the oligosaccharide is influenced by the cell line, the conformation of the protein, and the culture conditions. Carbohydrate processing during biosynthesis can result in microheterogeneity with regard to oligosaccharide structure.
Carbohydrates present a challenge for CE analysis because they have poor UV absorbance even at low wavelengths, and neutral sugars exhibit electrophoretic mobility only under extremely basic conditions. However, derivatization with a charged fluorophore provides a solution to both problems. Aminopyrene trisulfonic acid in the presence of sodium cyanoborohydride reacts with the carbonyl of the reducing end of an oligosaccharide to form a derivative that fluoresces strongly when excited by the 488 line of an argon ion laser. In addition, the sulfonic acid groups provide electrophoretic mobility. The derivatives can be separated readily using CZE. This approach can be used to characterize glycans cleaved from the protein and to analyze monosaccharides produced by hydrolysis of the glycans. This is illustrated in the characterization of oligosaccharides cleaved from the Fc region of a chimeric humanized monoclonal antibody by PNGase (Figure 5). In this particular molecule, a single N-linked glycosylation at the Asn-301 site of the Fc domain consists of a biantennary structure with zero, one, or two terminal galactose residues (G0, G1, G2).
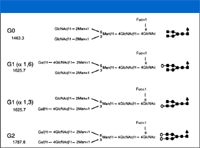
Figure 5: Structure of carbohydrates located on the Fc domain of rituximab, a genetically engineered chimeric monoclonal antibody. Reproduced from reference 5 with permission from the American Chemical Society.
Analysis of the cleaved glycans by CZE with LIF detection readily resolves all four species (5), including the positional isomers of G1 (Figure 6). The separation was performed using reversed polarity (anode at detector end) and coated capillaries to reduce electroosmotic flow (EOF). Because all of the glycans have the same net charge, separation is based upon differences in size and shape. Therefore, differences in the number and position of terminal galactose residues alters glycan mobility, with G0 (no terminal galactose residues) migrating faster than G2 (with two terminal galactose residues). The G1 isomers migrate at intermediate mobility; the faster-migrating G1 species is present at relatively higher amounts. Additional experiments involving seqential enzymatic removal of N-acetylglucosamine and mannose residues suggested that the fast-migrating major G1 peak was the branch linked to the core structure via the 1–6 linkage (refer to Figure 5).
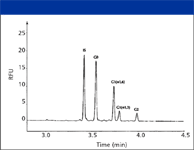
Figure 6: Separation of glycans cleaved from rituximab with PNGase. The internal standard is maltoheptaose. Reproduced from reference 5 with permission from the American Chemical Society.
Current and Future CE Usage in the Biopharmaceutical Industry
This and the previous installment of "Directions in Discovery" have explored the use of CE as a replacement for conventional GE assays, with a focus on generic or platform methods which could be applied to many different products. In the course of preparing this report, scientists at several biopharmaceutical companies were interviewed. Of these, Genentech and Amgen emerged as the leaders in this technology.
Genentech currently has twenty validated CE assays (2). In the QC environment, this includes lot release testing. In the product development environment, CE assays are used for cell culture development, recovery process design, formulation and stability studies, product characterization including comparability studies, and clinical lot release. The company started their CE program almost 10 years ago, and has over 30 CE systems in use. Currently every new molecule has one or two CE assays. Of the electrophoretic methods in use, 100% of the QC methods are CE, and 90% of analytical characterization methods are CE-based.
Amgen (6) has validated methods for CE-SDS (primarily for lot release of monoclonal antibody products), cIEF, CZE-LIF (for oligosaccharide characterization), and CZE-UV (for isoform determination). The company has 40 CE systems at four sites. At Amgen, CE has replaced gel electrophoresis for QC assays.
Although CE is routinely used in many biopharmaceutical companies, the technology is not without challenges. Management acceptance, which was certainly an issue when CE programs were initiated in the industry in the mid-to-late 1990s, is still a concern. Questions about analytical performance and vendor commitment still arise. Practitioners desire better chemistries, including more stable capillary coatings, improved derivatization procedures, and more versatile polymer sieving matrices. Training surfaced as a serious problem as well. Personnel turnover is a fact of life in this industry, and academic labs are not providing a pipeline of students with CE expertise.
In spite of these concerns, CE is now — and is likely to remain — a core analytical technology in the development and manufacture of biotherapeutics. In the future, CE will most likely evolve away from general-purpose capillary-based instruments towards miniaturized chip-based platforms and specialized applications-directed systems.
Tim Wehr "Directions in Discovery" editor Tim Wehr is staff scientist at Bio-Rad Laboratories, Hercules, California. Direct correspondence about this column to "Directions in Discovery," LCGC, Woodbridge Corporate Plaza, 485 Route 1 South, Building F, First Floor, Iselin, NJ 08830, e-mail lcgcedit@lcgcmag.com
References
(1) T. Wehr, LCGC 23, 676–681 (2005).
(2) S. Ma, Abstract L05-K4-M, presented at the 18th International Symposium on Microscale Bioseparations, New Orleans, Louisiana, 2005.
(3) S. Ma and W. Nashabeh, Chromatographia 53, S-75–S-89 (2001).
(4) J. Wu and A. Watson, J. Chromatogr., A 817, 163 (1998).
(5) S. Ma, and W. Nashabeh Anal. Chem. 71, 5185–5192 (1999).
(6) A. Guo, M. Han, P. Jones, and A. Balland, Abstract L05-O12-M, presented at the 18th International Symposium on Microscale Bioseparations, New Orleans, Louisiana, 2005.
New Study Investigates Optimizing Extra-Column Band Broadening in Micro-flow Capillary LC
March 12th 2025Shimadzu Corporation and Vrije Universiteit Brussel researchers recently investigated how extra-column band broadening (ECBB) can be optimized in micro-flow capillary liquid chromatography.

.png&w=3840&q=75)

.png&w=3840&q=75)


.png&w=3840&q=75)


.png&w=3840&q=75)
