Capillary Electrophoresis in the Biopharmaceutical Industry: Part I
LCGC North America
Almost 40 years have passed since the concept of capillary electrophoresis (CE) was described by Hjertén (1) in 1967. It emerged as a viable analytical technique after the pioneering work of Jorgenson (2) in the early 1980s, and commercial instruments were first introduced at the end of that decade. It is appropriate at this time to survey the history of CE and to judge its success in the world of analytical instrumentation.
Almost 40 years have passed since the concept of capillary electrophoresis (CE) was described by Hjertén (1) in 1967. It emerged as a viable analytical technique after the pioneering work of Jorgenson (2) in the early 1980s, and commercial instruments were first introduced at the end of that decade. It is appropriate at this time to survey the history of CE and to judge its success in the world of analytical instrumentation. In the world of small molecules, the success of CE has been limited by poor reproducibility due to capillary–analyte wall interactions, variable electroosmotic flow (EOF), and limited sensitivity using on-tube detection. In the world of biopolymers, the story is quite different, as CE has been applied to separations historically performed by gel electrophoresis. The most notable example is the adaptation of CE technology in multichannel DNA sequencers, which accomplished the task of sequencing the human genome in less than two years. A less well-publicized success story for CE is its replacement of gel electrophoresis for analysis of protein therapeutics in the biopharmaceutical industry. The role of CE in the biopharmaceutical industry was discussed in this column four years ago in a review of the first two annual meetings of "CE in the Biotechnology and Pharmaceutical Industries." The next two installments of "Directions in Discovery" will explore the current status of CE in the biopharmaceutical industry, with a focus on how CE has fared as a replacement for conventional gel electrophoresis, and how generic or platform CE methods have been employed successfully for routine use. Three primary methodologies will be addressed: use of CE as a replacement for sodium dodecyl sulfate (SDS)-polyacrylamide gel electrophoresis (PAGE) and gel isoelectric focusing, and use of CE for glycan analysis. Several major biopharmaceutical companies have developed and validated these methods according to FDA and ICH guidelines, and examples taken from industrial settings will be presented.

Tim Wehr
The focus of this month's column will be the use of CE to replace SDS-PAGE. In the following column, the other applications of CE in the biopharmaceutical industry will be addressed. Finally, the successes of CE in biopharmaceutical analysis will be discussed and some of the challenges facing its use in the industry will be assessed.
Replacing SDS-PAGE
For years, SDS-PAGE has been an essential tool for monitoring product purity, detecting minor impurities, and confirming batch-to-batch consistency of protein products. However, the technique has several limitations that argue against its use in an industrial laboratory. It is time consuming; it typically takes at least a day to run the gel, stain it, and destain it. These tasks are labor-intensive and can require large volumes of toxic reagents.

Directions in Discovery
Gel-to-gel reproducibility can be a problem even with commercial precast gels. The staining reaction can be protein-dependent (particularly for silver staining) and display poor linearity. For these reasons, SDS-PAGE is at best a semiquantitative technique.
Early attempts to perform SDS-PAGE in the capillary format used the direct approach of casting a cross-linked polyacrylamide gel within the capillary (3,4). This proved to be a difficult challenge, particularly for routine analysis. Capillary gel electrophoresis has virtually disappeared, to be replaced by a more convenient and reproducible approach that uses solutions of hydrophilic polymers (5). This approach is variously termed nongel sieving, replaceable polymer sieving, entangled polymer sieving, or physical gel CE. At the appropriate polymer concentration and chain length, the polymers form an entangled network within which the electrophoretic migration of analyte molecules is impeded based upon hydrodynamic size. The polymer solution is replaced between injections, completely eliminating the lifetime problems of gel-filled capillaries and permitting very reproducible separations. When used for the separation of SDS-protein complexes, the technique is referred to most often as CE-SDS in the biopharmaceutical industry. Several CE-SDS analysis kits are available commercially. The resolution provided by these sieving polymer solutions is equivalent to that of a 12% T PAGE gel.
Adapting SDS-PAGE to the capillary format has several advantages. On-tube absorbance detection provides quantitative information on protein concentration, and the entire process including capillary conditioning, sample injection, separation, integration, and report generation can be automated fully. The CE-SDS technique has two unique advantages that eliminate the problems encountered in other CE techniques such as capillary zone electrophoresis. First, the high viscosity of the sieving polymer reduces EOF to a very low level. This eliminates the major source of poor reproducibility of migration times and peak areas in CE. Second, the high negative charge density of SDS-protein complexes eliminates the problem of protein adsorption to the capillary wall. Interaction of proteins with ionized silanols on the wall surface is a major contribution to variable EOF and poor reproducibility in CZE of native proteins. So these two common problems in CZE, EOF, and protein–wall interactions disappear in CE-SDS.
A typical CE-SDS method resolves proteins ranging from 10 to 200 kDa in 10–15 min (Figure 1). Sample preparation is the same for both SDS-PAGE and CE-SDS; the sample is mixed with a buffer containing SDS and (if appropriate) a reducing agent such as mercaptoethanol. The mixture is then heated for a few minutes at elevated temperature. The typical capillary conditioning procedure for CE-SDS is rather lengthy, involving washing the capillary with base and acid solutions, loading the polymer solution into the capillary, and dipping the capillary end into wash solutions to wash off the residual viscous polymer solution. This can require 9–12 min, depending upon the sieving solution and the instrument. However, the ability to automate the entire process minimizes the impact of the additional analysis time. Two variations incorporated into the CE-SDS method by some labs are the introduction of a water plug between the sample and the polymer solution during injection (thought to improve resolution) and pressurization of the capillary inlet and outlet during separation (considered to minimize the risk of bubble formation).
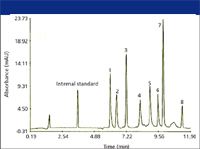
Figure 1: Separation of protein standards by CE-SDS. Peaks: 1 = lysozyme (14,000), 2 = trypsin inhibitor (21,500), 3 = carbonic anhydrase (31,000), 4 = ovalbumin (45,000), 5 = serum albumin (66,200), 6 phosphorylase B (97,400), 7 = β-galactosidase (116,250), 8 = myosin (200,000). (Figure provided by Bio-Rad Laboratories, Hercules, California.)
Analysis of monoclonal antibodies is one of the most frequent applications of CE-SDS in the biopharmaceutical industry. Because it replaces SDS-PAGE, typical applications in the development environment (6) include cell culture development, recovery process design, formulation development, stability studies, and product characterization including comparability studies. Typical applications in the manufacturing environment (7) include in-process monitoring (clone selection, determination of product-related and process-related impurities, and assessment of batch-to-batch product consistency), and lot release (determination of product purity, product identity, and characterization of posttranslational modifications such as glycosylation).
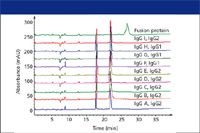
Figure 2: Reduced CE-SDS of different antibody molecules. (Figure provided by Amgen, Inc., Thousand Oaks, California.)
An example of the use of CE-SDS for characterizing reduced monoclonal antibodies (7) is presented in Figure 2. The fact that the same methodology could be applied to 10 different products demonstrates that this is a generic method usable for routine analysis.
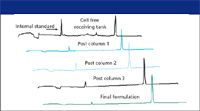
Figure 3: Purification process monitoring using CE-SDS. (Figure provided by Biogen-IDEC, Inc., Cambridge, Massachusetts.)The application of CE-SDS in purification process monitoring (8) is shown in Figure 3, in which monoclonal antibody recovery in a multicolumn purification scheme was monitored. Note that a desalting and concentration step was needed to obtain good quality electropherograms. Application of CE-SDS to fermentation monitoring is presented in Figure 4. Samples were drawn daily for nine days from the cell culture tank. The monoclonal antibody was isolated by protein A affinity chromatography and then subjected to CE-SDS analysis.

Figure 4: Daily analysis of cell culture tank using CE-SDS. (Figure provided by Biogen-IDEC, Inc.)
A limitation of CE-SDS with UV absorbance detection is sensitivity, which is comparable to that of SDS-PAGE with Coomassie staining. This is not suitable for detection of minor impurities, for which SDS-PAGE with silver staining is used. To circumvent this limitation, workers at Genentech (9) derivatized monoclonal antibodies with 5-carboxytetramethylrhodamine succinimidyl ester (5-TAMRA.SE) and used laser-induced fluorescence (LIF) detection. This permitted detection of minor impurities such as proteolytic fragments and aggregates (Figure 5). It is clear from Figure 5 that derivatization does not alter the separation selectivity nor cause peak broadening.
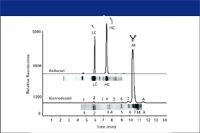
Figure 5: Monitoring product variants and process impurities using CE-SDS with LIF detection. (Figure provided by Genentech, Inc., San Francisco, California.)
Chip-Based CE-SDS Instruments
Recently, chip-based instruments for analysis of biopolymers have been introduced by three companies. These employ photolithographic technologies to microfabricate devices with channels etched into substrates such as glass and plastics for electrically driven separations. All three commercial systems provide chips and application kits for the CE-SDS chemistry. The chip pictured in Figure 6 has wells for 10 samples, a protein ladder for size calibration, and the polymer solutions. The chip is preloaded with the polymer solution by pressure, and samples are injected electrophoretically. Detection is accomplished by incorporating a fluorescent dye in the polymer solution, which binds both to SDS micelles in the separation medium and to the SDS associated with proteins in the sample.
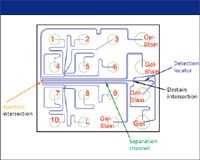
Figure 6: Protein chip layout. (Figure provided by Bio-Rad Laboratories.)
To remove the background fluorescence of dye associated with the detergent micelles, a "destaining" solution of the sieving polymer without SDS or dye is introduced at the end of the separation channel but upstream from the detection point. This "destaining" medium migrates electrophoretically as a stream flanking the sample stream, and SDS diffuses across the boundary between them, reducing the detergent concentration in the sample stream below the critical micelle concentration. Laser-induced fluorescence is used to detect the dye-protein-SDS complexes. The advantages of the chip-based CE-SDS systems are speed (separation times are approximately 60 s/sample), size (the entire instrument including PC controller/data station occupies about 2 ft of bench space), and ease of use (turnkey application kits with reagents and standards are supplied by the vendor). An example of data output from a commercial protein chip system is shown in Figure 7, and a separation of reduced and nonreduced IgG is shown in Figure 8.
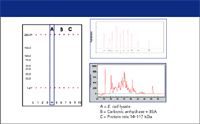
Figure 7: Protein sizing with a chip-based CE-SDS system. The migration times and peak areas from the electropherograms are used to construct the migration distances and band intensities in the simulated gel image. Lane 4 and the lower electropherogram represent separation of an E. coli lysate, and lane 10 and the upper electropherogram represent separation of a protein ladder. Lanes 1 and 6 display separation of carbonic anhydrase + bovine serum albumin (BSA), while lanes 2 and 7 display B carbonic anhydrase bands. The bands at 1.2 and 260 kDa are calibration markers for size determination. (Figure provided by Bio-Rad Laboratories.)
All biopharmaceutical labs contacted for this study have evaluated chip-based CE-SDS instruments and use them where they are applicable. They find them to be convenient and robust to operate. However, they note two limitations. First, the LIF dye detection systems provide sensitivity only to the level of Coomassie staining, which is unsuitable for detecting low-level impurities. Second, the turnkey approach of dedicated software and chemistries (a plus in the QC environment) prevents the user from "getting under the hood" to tweak the system for a particular application (a limitation in research and development labs).
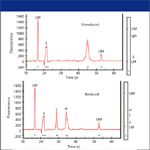
Figure 8: Electrophoresis of an IgG under (upper trace) reduced and (lower trace) nonreduced conditions using CE-SDS on a protein microchip system. IgG = immunoglobulin G, H = heavy chain, L = light chain, S = system peak, LM = lower size marker, UM = upper size marker. (Figure provided by Bio-Rad Laboratories.)
Conclusions
CE employing entangled polymer sieving systems provides a rapid, reproducible, and robust method for the separation of SDS-protein complexes. The major benefits of the technique are the ability to acquire quantitative information and the replacement of time-consuming and laborious steps in SDS-PAGE with a fully automated instrumental method. Commercially available analysis kits are available from several manufacturers, which can be used directly or with a few procedural modifications. When used with UV detection, CE-SDS provides sensitivity comparable to Commassie staining. Modification of the sample preparation procedure to introduce a covalently linked fluorophore and the use of LIF detection extends the sensitivity of CE-SDS to a level equivalent to SDS-PAGE with silver staining. Several major biopharmaceutical companies have adopted CE-SDS as a replacement to SDS-PAGE, have demonstrated comparability with the gel-based method, and have validated the method successfully, according to FDA and ICH guidelines. The major application is analysis of monoclonal antibodies. CE-SDS methods are now in routine use for in-process monitoring (including clone selection, determination of product consistency, detection of product- and process-related impurities) for lot release assays of product identity and purity, for stability studies, and for product characterization.
Acknowledgments
The author would like to thank S. Ma, Genentech, Inc. (San Francisco, California), A. Guo, Amgen, Inc. (Thousand Oaks, California), J. Fitchett, Biogen-IDEC, Inc. (Cambridge, Massachusetts), and M. Schenerman, Medimmune, Inc. (Gaithersburg, Maryland) for their perspectives on the use of CE at their companies and for providing material for the figures in this review.
References
(1) S. Hjertén, Chromatogr. Rev. 9, 122 (1967).
(2) J. Jorgenson and K.D. Lukacs, Anal. Chem. 53, 1298 (1981).
(3) S. Hjertén, in Electrophoresis '83, H. Hirai, Ed. (Walter de Gruyter Press, New York, 1984), p. 71.
(4) A.S. Cohen and B.L. Karger, J. Chromatogr. 397, 409 (1987).
(5) M. Zhu, D.L. Hanson, S. Burd, and F. Garrison, J. Chromatogr. 480, 311 (1989).
(6) S. Ma, Abstract L05-K4-M, presented at the 18th International Symposium on Microscale Bioseparations, New Orleans, Louisiana, 2005.
(7) A. Guo, M. Han, P. Jones, and A. Balland, Abstract L05-O12-M, presented at the 18th International Symposium on Microscale Bioseparations, New Orleans, Louisiana, 2005.
(8) J. Fitchett, M. Helm, K. Lowery, C. McClusky, and M. LaBarre, paper presented at the 5th Symposium on CE in the Biotechnology and Pharmaceutical Industries, San Francisco, California, 2003.
(9) G. Hunt and W. Nashabeh, Anal. Chem.71, 2390–2397 (1999).
Tim Wehr "Directions in Discovery" editor Tim Wehr is staff scientist at Bio-Rad Laboratories, Hercules, California. Direct correspondence about this column to Direct correspondence about this column to "Directions in Discovery," LCGC, Woodbridge Corporate Plaza, 485 Route 1 South, Building F, First Floor, Iselin, NJ 08830, e-mail lcgcedit@lcgcmag.com.
New Study Investigates Optimizing Extra-Column Band Broadening in Micro-flow Capillary LC
March 12th 2025Shimadzu Corporation and Vrije Universiteit Brussel researchers recently investigated how extra-column band broadening (ECBB) can be optimized in micro-flow capillary liquid chromatography.

.png&w=3840&q=75)

.png&w=3840&q=75)


.png&w=3840&q=75)


.png&w=3840&q=75)
