The Benefits of Thermogravimetric Gas Chromatography–Mass Spectrometry
The combination of a thermogravimetric analyzer (TGA) with mass spectrometry (MS) to analyze evolved gases is a well-known technique. However, it does not allow differentiation between gases that evolve simultaneously; TG combined with gas chromatography–mass spectrometry (TG–GC–MS) can allow for a more complete characterization. This article explains more
The combination of a thermogravimetric analyzer (TGA) with mass spectrometry (MS) to analyze evolved gases is a well-known technique. However, TG–MS does not allow differentiation between gases that evolve simultaneously; TG combined with gas chromatography–mass spectrometry (TG–GC–MS) can allow for a more complete characterization.
(PHOTO CREDIT: EASTNINE INC./GETTY IMAGES)

Pyrolysis is now a standard way to introduce samples to gas chromatography (GC) systems, but it is limited because it cannot correlate the evolution of volatiles to precise temperatures. The same issue arises in thermal analysis when using data from a thermogravimetric analyzer (TGA). A TGA measures the change in the weight of a sample as a function of temperature. The temperature-to-weight loss relationship is precisely defined, but researchers are limited to guessing what is eluting at each temperature point. Replacing a headspace or pyrolysis unit with a TGA can allow a more precise determination of the off-gas's relationship to temperature. This can help analysts to determine the source of the off-gas, whether it is the result of evaporation or the combination of another material.
The use of a TGA also allows characterization of materials not suitable for gas chromatography–mass spectrometry (GC–MS) including solid residues left after pyrolysis. For example, fillers such as carbon black, glass fibres, or oxides; or the heavy oils remaining after a simulated distillation.
Researchers can also produce heat capacity and enthalpy values for a reaction that is evolving gas by using a simultaneous differential thermal analyzer (STA) to introduce a sample to a gas chromatograph system. This can be extremely useful in combustion reactions such as the burning of a biofuel or in the release of a chemical during a condensation polymerization reaction.
Using TG to Understand the Leaching Process
GC–MS can differentiate between similar compounds, such as methanol and ethanol, and can also characterize complex gaseous mixtures coming off a sample. GC–MS can be used to detect extremely small levels of contaminants such as those in leachates. In fact, information can be collected on the small amounts of material evolved from complex matrices and this ability to analyze very small amounts of evolved gases is needed to understand processes like leaching, where a packaging material and/or its contents contaminate each other and degrade properties. This is a concern for many people as bisphenol A (BPA) and other plastizers can be leached into food. In some cases, researchers can even quantify the size of the effect by determining the amount of leachable material absorbed by using gas sample capture loops. This is often semi-quantitative as precise determinations can be difficult.
In the following two case studies, we look at the benefits of combining the techniques.
Case Study: Analysis of Coffee Beans in Plastic Containers
TG combined with GC–MS can be applied to the detection of leachable substances that contaminate foods and pharmaceuticals and which are often present at very low levels and in complex matrices, such as plasticizers or other packaging contaminants. It is important to understand the relationship of temperature with the evolution of the gas, to avoid misidentifying the products of decomposition or pyrolysis of the sample as a contaminant.
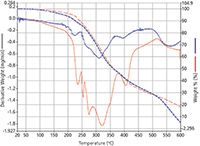
Figure 1: Thermogram from the analysis of African (blue) and Indonesian (red) green coffee beans.

Method: The analysis was performed on a Pyris 1 TGA (PerkinElmer) using alumina pans and a standard furnace. The instrument was calibrated with nickel and iron and all samples were run under helium purge. Heating rates varied from 5 °C/min to 40 °C/min, depending on the sample under test. The furnace was burned off between runs in air. Samples were approximately 10–15 mg. Data analysis was performed using Pyris 9.0 Software (PerkinElmer). During the TG–GC–MS analysis, a Clarus 680 C GC–MS (PerkinElmer) was used. A 0.32 mm i.d. deactivated fused-silica transfer line was connected to the GC injector port. The transfer line was heated to 210 °C and connected to a 30 m × 0.32 mm, 1-µm Elite WAX column (PerkinElmer). In both cases, data analysis was performed using TurboMass GC–MS software (PerkinElmer).
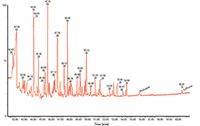
Figure 2: Chromatogram of the off-gas from the TGA run. Caffeine appears at 60.8 min.

Results: Figure 1 shows the thermogram from the analysis of two types of coffee beans. The TGA weight loss curve for both is similar and uncomplex, but the derivative curve of weight loss versus temperature gives an indication of the complexity of the material.
The derivative curve can be used as a "fingerprint" to identify the type of bean, because there are distinct derivative profiles for the Ethiopian bean (blue) compared to the Indonesian bean (red). Figure 2 shows the higher retention time peaks, with a caffeine peak at 60.8 min as well as a phthlate peak at 56 min.
TGA Analysis of Switchgrass
Switchgrass (Panicum Virgatum) is a perennial warm-season grass native to the northern states of the USA and is easily grown in difficult soils. It has great potential as a biofuel, specifically cellulosic ethanol and bio-oil.
Method: A Pyris TGA system (PerkinElmer) was interfaced with a Clarus 600 GC–MS system (PerkinElmer ) with a S-Swafer micro-channel flow splitting device. The same column mentioned in the previous case study was used for the GC separation.
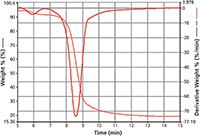
Figure 3: Typical TGA of a switchgrass sample.

A small quantity of dried and ground switchgrass was placed on the TGA pan and weighed using the software. A rapid TG analysis based on heating the sample from 30 °C to 1000 °C at 100 °C/min in a nitrogen atmosphere was performed to determine which regions of the weight loss curve were to be further studied using the TG–GC–MS technique.
Results: A typical TG weight-loss curve for the sample is shown in Figure 3. Superimposed onto the curve is the derivative that determined the timed events used to sample the evolved gas onto the GC–MS column.
Figure 3: Typical TGA of a switchgrass sample.

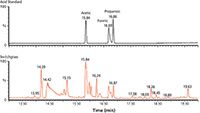
Figure 4 shows the analysis of the timed events that collected the evolved gases from the main transition shown in Figure 3. The smaller, earlier transition was also sampled, but was shown to contain mostly water. The major transition produced a large number of oxygenated volatile organic compounds (VOCs), including some very polar species.
The three peaks seen at 15.84, 16.69, and 16.86 min were identified as a homologous series of free fatty acids based on a library search of their MS spectra (NIST 2008). In GC analysis, a homologous series usually tends to elute in carbon number order, but here the elution order appears to be acetic, followed by formic and propanonic acid. This retention behaviour is not typical and so a simple retention time standard was analyzed to confirm this tentative result, as shown in Figure 4.
Conclusion
Using a thermogravimetric analyzer instead of a headspace or pyrolysis unit to introduce a sample to a GC system gives a precise determination of the off-gas composition relative to evolution temperature.
If an STA is used instead of a standard TGA, the analyst can also produce heat capacity and enthalpy values for the reaction producing the evolving gas. In combustion reactions, such as the burning of a biofuel or in the release of a chemical during a reaction, this can be extremely useful in better understanding the thermodynamics of the analyzed material. Finally, a TGA also allows for precise characterization of the materials that are not suitable for GC–MS analysis alone.
In addition, TGA can determine the boiling points of materials too heavy to be run by simulated distillation methods as well as measure the kinetics of degradation in materials such as plastics, pharmaceutical, nature products, and foods.
Dr. Kevin Menard has worked in oil and gas, polymers, academia, and aerospace before joining PerkinElmer. He is currently product manager for the thermal and elemental product lines, where he has been involved in developing hyphenated products.
E-mail: perkinelmer@perkinelmer.com
Website: www.perkinelmer.com/
This article is from The Column. The full issue can be found here: http://www.chromatographyonline.com/vol-10-no-13-column-july-24-2014-europe-and-asia-pdf

Regulatory Deadlines and Supply Chain Challenges Take Center Stage in Nitrosamine Discussion
April 10th 2025During an LCGC International peer exchange, Aloka Srinivasan, Mayank Bhanti, and Amber Burch discussed the regulatory deadlines and supply chain challenges that come with nitrosamine analysis.


