Asymmetric Flow Field Flow Fractionation: A Powerful Method for Polymer Characterization
The Application Notebook
Recent development of the instrumentation for asymmetric flow field flow fractionation (FFF) brings new possibilities for the characterization of synthetic and natural polymers with several advantages over traditionally used size exclusion chromatography (SEC). The main difference of asymmetric flow FFF compared to SEC is that the polymer separation takes place in an entirely empty channel, which eliminates undesirable SEC effects such as shearing degradation of polymers with ultra high molar mass, anchoring of branched macromolecules in SEC column packing, and enthalpic interactions of polymer molecules with a stationary phase.
Asymmetric flow field flow fractionation is a type of field flow fractionation (FFF) separation technique. FFF has been co-existing with size exclusion chromatography (SEC) for several decades. However, unlike SEC, where the development of instrumentation has been driven by other liquid chromatography (LC) techniques, commercially available and reliable FFF instruments were, until recently, unavailable. Although there are many publications dealing with FFF theory (1–4), many fractograms published so far suffer from poor signal-to-noise ratio and the experimental results usually do not prove FFF to be a mature technique for routine applications. For that reason, SEC in either conventional mode using column calibration, or combined with molar mass-sensitive detectors, became a dominating method for the characterization of molar mass distribution of synthetic and natural polymers.
However, recent developments in asymmetric flow FFF provide several advantages for the separation of various polymers, proteins, and particles over traditionally employed SEC. The possible advantages of asymmetric flow FFF over SEC include a broad separation range accessible by a single channel, a significantly reduced risk of shearing degradation, elimination of polymer interactions with column packing, the possibility of injecting large sample volumes (needed for samples that can be prepared only in low concentrations), the rapid change of mobile phase, the control of resolution by cross flow and other separation conditions, and efficient separation of branched polymers. It is also worth mentioning that in the case of SEC, the expensive columns often are damaged by deposition of samples in the columns. This does not happen with FFF, in which the separation takes place in an empty channel. If the channel membrane is contaminated, its replacement is very easy.
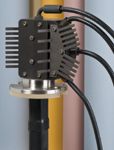
The goal of this article is to present asymmetric FFF as a mature analytical separation technique, capable of providing separation efficiency comparable to SEC, and in addition, solving several traditional SEC drawbacks. The focus of the article is not on aqueous applications, in which asymmetric flow FFF–multiple angle light scattering (MALS) has been used successfully (5–7), but mainly on the characterization of synthetic polymers in tetrahydrofuran, an area in which the applications have so far been sporadic (8).
Basic Principles of Asymmetric Flow FFF Separation and the Determination of Molar Mass and Size
Asymmetric flow FFF is a separation analytical technique similar to LC. Unlike LC, the asymmetric flow FFF method has no stationary phase and the separation is achieved solely by a flow in an empty channel, where a perpendicular flow force is applied. The channel consists of two plates bolted together that are separated by a spacer foil with a typical thickness of 350 μm. The upper plate is impermeable, while the bottom plate is permeable, made of porous frit covered by a semipermeable membrane with a typical cutoff of 5–10 kDa. The membrane is permeable to the molecules of mobile phase but not permeable to the polymer molecules and colloidal particles, and therefore, it keeps the sample in the channel and directs the sample by flow to the channel outlet. The laminar flow of the mobile phase creates a parabolic flow profile within the channel; that is, the stream moves slower close to the channel walls than it does in the channel center.
The analyzed molecules and particles are driven by the cross flow toward the bottom wall of the channel. Diffusion creates a counteracting motion, causing smaller particles, which have a higher diffusion coefficient, to move closer to the channel center, where the longitudinal flow is faster. The velocity gradient inside the channel separates the molecules and particles according to their hydrodynamic size, so that smaller molecules are eluted before the larger ones. This means that the asymmetric flow FFF separation is opposite to SEC separation, in which the large molecules are eluted first. Note: Steric separation, which can occur for large molecules and particles and where the elution order is reversed, is not discussed here and the information can be found elsewhere (9).
The separation process requires three steps: During the first two steps (injection and focusing), the main flow is split, enters the channel from the inlet, and the outlet and is balanced to meet under the injection port. At this step, the flow moves only in a vertical direction and permeates the membrane. When the sample is injected, it is focused in a thin band and concentrated toward the membrane. After complete injection of the sample solution, the injection flow is stopped and typically, another minute of focusing is allowed before the flow is switched to elution mode, when the solvent flows from the inlet to the outlet that is connected to the detectors. Unlike symmetric flow FFF instruments that require a separate pump to generate the injection flow and cross flow, in asymmetric flow FFF instruments, splitting the main flow delivered by a single chromatographic pump produces the injection flow and cross flow. The splitting of the flow is achieved by a software-controlled valve in combination with a measuring device (LiquiFlow). An asymmetric flow FFF instrumental set-up is similar to that used in SEC, except the SEC columns are replaced by a channel connected to a chassis that controls the hydrodynamic conditions in the channel. If a cross-flow gradient is applied, the main flow from the pump gradually decreases during the cross-flow gradient.
Originally, FFF was intended to be the method yielding the diffusion coefficient and consequently, the hydrodynamic radius calculated on the basis of retention data. That means it served as a separation and characterization method simultaneously. However, light-scattering detectors allow direct online measurement of not only hydrodynamic radius using dynamic light-scattering methodology, but also the direct determination of molar mass and the root mean square (RMS) radius (also called radius of gyration) using a MALS method (10,11). A MALS detector simultaneously measures the intensity of light scattered at different angles by polymer molecules eluting from a separation system. The molar mass and RMS radius of the polymer are calculated at regular intervals (every 1–2 s for the results presented in this article) across the chromatographic peak by means of a so-called Debye plot, which is used to extrapolate the intensities scattered at various angles to zero angle. The intercept and slope of such a plot at zero angle provide molar mass and RMS radius, respectively. The concentration of eluted molecules is measured by a concentration-sensitive detector, which is usually a refractive index (RI) detector.
Experimental
Our asymmetric flow FFF–MALS instrumental set-up consisted of an Eclipse FFF system (Wyatt Technology Corp., Santa Barbara, California), a DAWN EOS MALS photometer (Wyatt Technology) and a model 410 RI detector (Waters, Milford, Massachusetts). An SEC–MALS set-up was composed of an Alliance 2695 separations module (Waters), two 300 mm × 7.5 mm PLgel Mixed-C columns (Varian, Inc., Palo Alto, California), a miniDAWN MALS photometer (Wyatt Technology), and a model 2414 RI detector (Waters). Tetrahydrofuran was used as the mobile phase for both SEC and asymmetric flow FFF experiments at an SEC flow rate and asymmetric flow FFF channel flow rate of 1 mL/min. Samples were injected as solutions in tetrahydrofuran (for polymers typically 100 μL of about 0.2% [w/v]).
Results and Discussion
Figure 1 demonstrates the ability of asymmetric flow FFF to provide a polymer separation comparable to SEC. A typical broad polymer sample, namely poly(methyl methacrylate), was analyzed using both SEC and asymmetric flow FFF. The obtained chromatograms and molar mass versus elution time plots are depicted in Figure 1, together with the corresponding cumulative distribution curves. Note that the elution order of asymmetric flow FFF separation is opposite to that of SEC; that is, molar mass increases with increasing elution time. The cumulative molar mass distribution plots obtained by the two techniques almost overlay, which proves the identical separation efficiency of asymmetric flow FFF and SEC. Further evidence of the identical separation power of asymmetric flow FFF and SEC is shown in Figure 2, which compares RMS radius versus molar mass plots of broad polystyrene determined by SEC–MALS and asymmetric flow FFF–MALS. The relation between the RMS radius and molar mass (conformation plot) is very important for the characterization of polymer conformation and detection and characterization of branching. Efficient separation is essential for the determination of reliable conformation plots and, thus, identical conformation plots obtained by SEC–MALS and asymmetric flow FFF–MALS provide additional evidence of the identical separation power of the two techniques.
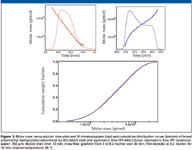
Figure 1
An important application of SEC–MALS is the characterization of branched polymers. The most fundamental characterization of branching can be achieved by the conformation plot, which can be used for the determination of distribution of branching ratio and the number of branch units with respect to molar mass. However, large branched molecules have a strong tendency to anchor in column packing, which results in their delayed elution together with smaller molecules separated by a regular SEC mechanism, and consequently, in an abnormal pattern of the conformation plot (12). The anchoring effect cannot occur in an empty asymmetric flow FFF channel and, thus, perfectly straight conformation plots with no abnormalities are obtained. An example is illustrated in Figure 3, which compares the conformation plots of randomly branched polystyrene determined by SEC–MALS and asymmetric flow FFF–MALS. The upswing at the region of lower molar masses on the plot determined by SEC–MALS is the consequence of the delayed elution of large highly branched molecules and increased polydispersity of fractions eluted from SEC columns at the region of higher elution volumes. This effect is completely missing in the case of the conformation plot determined by asymmetric flow FFF–MALS. The decreasing slope of the conformation plot obtained by asymmetric flow FFF–MALS indicates an increasing degree of branching with increasing molar mass, typical for randomly branched polymers.

Figure 2
One of the important features of asymmetric flow FFF is the ability to separate macromolecules over a very broad range of molar masses without the need to change separation conditions. This ability is demonstrated in Figure 4 by the analysis of acrylic copolymer prepared by emulsion polymerization whose molar mass distribution covers the range of 104–108 g/mol. In addition, the evenly decreasing slope of the conformation plot indicates the presence of branched molecules in the sample.
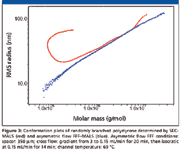
Figure 3
Various nanoparticles have achieved great popularity among material chemists as materials with great potential to enhance various polymer properties. The size distribution of nanoparticles, which is an important parameter related to their properties, can be determined by asymmetric flow FFF–MALS, as shown in Figure 5.
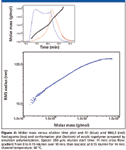
Figure 4
Conclusions
The asymmetric flow FFF–MALS combined technique can serve as a routine method of polymer analysis and characterization. Asymmetric flow FFF provides separation efficiency entirely comparable with SEC, which traditionally has been used and which has dominated to this point. In addition, it yields superior separation of branched polymers, polymers containing ultrahigh molar mass fractions up to at least 108 g/mol, and nanoparticles. While SEC will certainly continue to be the frequently employed method of polymer analysis, for many samples, the description of molecular structure is more detailed if both SEC and asymmetric flow FFF are used. The possibility to run both SEC and asymmetric flow FFF on the same experimental set-up — that is, to share a pump, an injector, and detectors and simply switch the separation mode directing the injector into either the columns or the channel — makes the asymmetric flow FFF method a powerful and versatile tool for the characterization of a variety of synthetic and natural polymers and related materials.
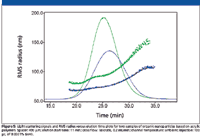
Figure 5
Stepan Podzimek*, Petr Lebeda†, and Christoph Johann§
*SYNPO, 532 07 Pardubice, Czech Republic
†University of Pardubice, Faculty of Chemical Technology, Institute of Polymeric Materials, 532 10 Pardubice, Czech Republic
§Wyatt Technology Europe, DE-56307 Dernbach, Germany
Please direct correspondence to stepan.podzimek@synpo.cz
References
(1) K.G. Wahlund and J.C. Giddings, Anal. Chem. 59, 1332–1339 (1987).
(2) J. Janca and J. Chmelik, Anal. Chem. 56, 2481–2484 (1984).
(3) P.S. Williams and J.C. Giddings, Anal. Chem. 66, 4215–4228 (1994).
(4) K.D. Caldwell, S.L. Brimhall, Y. Gao, and J.C. Giddings, J. Applied Polymer Sci. 36, 703–719 (1988).
(5) M. Leeman, M.T. Islam, and W.G. Haseltine, J. Chromatogr. A 1172, 194–203 (2007).
(6) M. Leeman, K.-G. Wahlund, and B. Wittgren,J. Chromatogr., A 1134, 236–245 (2006).
(7 M. Andersson, B. Wittgren, H. Schagerlof, D. Momcilovic and K.G. Wahlund, Biomacromolecules 5, 97–105 (2004).
(8) D.Y. Bang, D.Y. Shin, S. Lee, and M.H. Moon, J. Chromatogr., A 1147, 200–205 (2007).
(9) S.K. Ratanathanawongs and J. C. Giddings, Anal. Chem. 64, 6–15 (1992).
(10) P.J. Wyatt, Anal. Chim. Acta 272, 1–40 (1993).
(11) S. Podzimek, J. Applied Polymer Sci. 54, 91–103 (1994).
(12) S. Podzimek, T. Vlcek, and C. Johann, J. Applied Polymer Sci. 81, 1588–1594 (2001).

Understanding FDA Recommendations for N-Nitrosamine Impurity Levels
April 17th 2025We spoke with Josh Hoerner, general manager of Purisys, which specializes in a small volume custom synthesis and specialized controlled substance manufacturing, to gain his perspective on FDA’s recommendations for acceptable intake limits for N-nitrosamine impurities.


