Application of Liquid- and Supercritical Fluid Chromatography Coupled with High-Resolution Mass Spectrometry for the Analysis of Short-, Medium-, and Long-Chain Chlorinated Paraffins in Dietary Supplements
Chlorinated paraffins (CPs) are an emerging and ubiquitous group of environmental pollutants associated with adverse effects on human health, including endocrine disruption and possible carcinogenicity. In this study, supercritical fluid chromatography (SFC) and ultrahigh-performance liquid chromatography (UHPLC)—both coupled with high-resolution mass spectrometry (HRMS)—methods for the analysis of short-, medium-, and long-chain CPs in fish oil-based dietary supplements were developed and validated at concentration levels of 0.6 and 3.0 µg/g lipid weight (lw). The recoveries were in the range of 80–96% and repeatabilities, expressed as relative standard deviations, were <19%. The limits of detection for the UHPLC–HRMS method (from 0.03 to 0.05 µg/g lw) were 5 to 10 times lower than those obtained by SFC–HRMS (from 0.13 to 0.50 µg/lw).
High performance liquid chromatography (HPLC) is a technique in analytical chemistry used to separate, identify, and quantify each component in a mixture | Image Credit: © Love Employee - stock.adobe.com

Chlorinated paraffins (CPs) are widespread environmental pollutants used predominantly as additives (such as plasticizers and flame retardants) in plastic materials (1,2), high temperature and pressure resistant lubricants, metal‑working fluids, and flame retardants in adhesives and textiles (3). CPs are divided into three main groups by their carbon chain lengths: (i) short- (SCCPs; C10–C13); (ii) medium- (MCCPs; C14–C17); and (iii) long-chain chlorinated paraffins (LCCPs: C18–C30) (4).
SCCPs are endocrine disruptors (5) and possible carcinogens to humans (6); therefore, they were added to the Stockholm Conven‑ tion (Annex A) in 2017 as persistent organic pollutants (POPs) (7). The data on both MCCPs and LCCPs adverse effects on human health are very limited, and so they are not currently regulated (8). On the other hand, MCCPs are under evaluation for listing in the Stockholm Convention, and the risk assessment and risk profile are being performed (7).
The instrumental analysis of CPs in food and biological samples (usually at trace levels) (9,10) is a demanding task. In recent years, several gas chromatography (GC) or liquid chromatography (LC)-based methods have been published (9–12). Nevertheless, CPs cannot be completely separated to individual compounds, which has led (together with the lack of well‑characterized standard mixtures) to the need for unconventional quantification approaches (13–15). The LCCP standards have the least available options on the market.
The main goal of this study was to develop and validate super‑ critical fluid chromatography (SFC) and ultrahigh- performance liquid chromatography (UHPLC)—both coupled with high-resolution mass spectrometry (HRMS) with electrospray ionization operated in negative mode (ESI-)—methods for the determination of CPs (particularly LCCPs as those cannot be analyzed by GC–HRMS because of low vapor pressure). Fish oil dietary supplements were selected as the sample matrix, as an example of an adequately complex type of sample. The validated methods are necessary for future studies to assess the CPs levels in food and the environment, particularly for LCCPs, which are the least studied among the major CP groups.
Materials and Methods
Standard Solutions and Chemicals
LGC Standards provided 31 standard mixtures of SCCPs, MCCPs, and LCCPs of 10 µg/mL or 100 µg/ mL cyclohexane with various chlo‑ rine contents (from 36.0% to 65.3%) for this study. The detailed list is documented in our previous paper (16). Isotopically labeled internal standard of β-hexabromocyclododecane (13C12-β-HBCD; 50 µg/mL toluene) was purchased from Wellington Laboratories.
Acetonitrile, methanol, n-hexane, ethyl acetate, and isopropanol were obtained from Honeywell. Dichloromethane, isooctane, sul‑ furic acid, ammonium formate, and silica gel 60 (particle size 0.063– 0.200 mm) were purchased from Merck, whereas sodium sulfate (anhydrous) was bought from LachNer. Deionized water was made by a Milli-Q water purification system (Merck). Technical gases (carbon dioxide 4.8 and nitrogen 4.0) were supplied by SIAD.
Sample Preparation Procedure
In this study, a sample of fish oil‑based dietary supplements with no measurable CPs contamination found in a previous study (16) were chosen for method development and validation. Four other samples (with higher levels of CPs contamination previously determined by GC–HRMS) were analyzed to compare the new methods. A multilayer solid-phase extraction (SPE) was used in this study for the sample preparation. Briefly, the CPs were isolated from fish oil on an SPE column (78 × 12 mm with Luer tip) (LCTech GmbH) filled with (from bottom to top) silica gel (0.5 g; deactivated by 2% deionized water, w/w), sodium sulfate (1 g; anhydrous baked for 4 h at 600 °C), and sulfuric acid-modified silica gel (1 g; 40% of H2SO4, w/w). Each column was washed with 3:1 (v/v) n-hexane–dichloromethane and then conditioned with n-hexane. A 100-mg measure of the sample diluted in n-hexane was loaded onto the SPE column and the analytes were eluted with 3:1 v/v n-hexane–dichloromethane. The sample was subsequently concentrated by a rotary vacuum evaporator followed by drying in a gentle stream of nitrogen. It was then dissolved in 500 µL of n-hexane, and the residual lipids were subsequently mineralized by a few drops of concentrated sulfuric acid. After one hour, an aliquot of 250 µL was evaporated and redissolved in 250 µL of the syringe standard (50 ng/mL 13C12-β-HBCD) in acetonitrile.
Instrumental Analysis
UHPLC–ESI(-)–HRMS Analysis
The LC–ESI(-)–HRMS analysis of CPs was performed by Dionex UltiMate 3000 UHPLC system (Thermo Fisher Scientific) coupled with a TripleTOF 6600 HRMS system (Sciex) with ESI operated in a negative mode. The method was developed from initial conditions published elsewhere (17). In this study, the target analytes (injection volume 5 µL acetonitrile) were separated on a 100 × 2.1 mm, 1.7-µm Waters Acquity UPLC BEH C18 column maintained at 40 °C. Methanol (A) and a mixture of 65:30:5 (v/v/v) isopropanol–methanol–water (B) were used as the mobile phases. The initial conditions were 10% B for 1 min followed by a gradient with the following steps: to 30% B at 1.5 min; to 60% B at 2 min; to 80% at 3 min; to 90% B at 3.5 min; and to 100% B at 4 min (3.5 min isocratic hold). The total run time was 11 min, including the return to the initial state and equilibration. The mobile phase flow rate was 0.2 mL/min.
Regarding MS source conditions, the desolvation temperature was set to 450 °C, and the capillary voltage was -4.5 kV. The acquisition speed was 2 spectra/s and the mass range 100 to 1500 m/z. The [M+Cl]- ions were monitored.
SFC–ESI(-)–HRMS Analysis
A previously published SFC-based method (16) was used in this study with several modifications (gradient of mobile phases, composition of mobile phase B, and make‑up solvent were changed). The supercritical fluid chromatograph Acquity UPC2 coupled with a Synapt G2 Si high-resolution mass spectrometer (both Waters) with electrospray ionization operated in a negative mode was employed. The target analytes (injection volume 3 µL acetonitrile) were separated on a 100 × 3.0 mm, 1.8-µm Viridis HSS C18 SB (Waters) column maintained at 70 °C. Super‑ critical CO2 was used as mobile phase A and 5 mM ammonium formate in 99:1 (v/v) methanol–water was employed as mobile phase B. The initial conditions were 100% A for 0.5 min followed by a gradient to 35% B at 5 min (1 min isocratic hold; the total run time was 8 min including the return to the initial state and equilibration). The mobile phase flow rate was 1.8 mL/min. After the separation under supercritical conditions, the CO2 evaporated and had to be substituted by another mobile phase—a make-up solvent—which leads the analytes into the ion source. In this study, the make-up solvent was a mixture of 45:45:10 (v/v/v) methanol– ethyl acetate–dichloromethane (flow rate 0.5 mL/min).
In the MS system, the desolvation gas temperature was 250 °C and the capillary voltage was set to -3 kV. The acquisition speed was 2 spectra/s and the mass range 250 to 1500 m/z. The [M+Cl]- ions were monitored.
Method Validation
The analytical method for the determination of SCCPs, MCCPs, and LCCPs was validated by the analysis of artificially contaminated samples (at two different concentration levels, each level prepared in six parallels). The selected spike levels were 0.6 and 3 µg/g lw for each of the CP groups. The standard mixtures used were C10–C13 63.0% Cl; C14–C17 57.0% Cl; and C18–C20 49.0% Cl. The limits of detection (LODs) were determined as the lowest standard level at which any CP congener group was integrable (with S/N ≥ 10).
Evaluation of Matrix Effects
The matrix effects were evaluated by comparing matrix standards (prepared in duplicate) with solvent standards at a level of 0.6 µg/g lw. The equation used for the evaluation was described elsewhere (12). The sample preparation was performed as described in the “Methods and Materials” section. For a comparison, matrix effects of the extract with residual lipids (without sulfuric acid treatment) were evaluated as well.
Results and Discussion
Comparison of Method Performance Characteristics of SFC and UHPLC-Based Methods for the Analysis of CPs in Fish Oil-Based Dietary Supplements
The method performance characteristics of SFC–HRMS and UHPLC–HRMS methods for analysis of SCCPs, MCCPs, and LCCPs are shown in Table I. There are no officially recommended reference values for recovery and repeatability in the analysis of CPs; therefore, the acceptable values (recovery from 60 to 120% and repeatability <20%) were adopted from Commission Regulation (EU) 2017/644 (18) concerning the sampling and analysis of polychlorinated diben‑ zodioxins/furans and polychlorinated biphenyls (other chlorinated POPs) in foodstuffs. The recoveries varied from 84 to 95% (SFC‑based instrumental method) and from 80 to 96% (UHPLC-based instrumental method), respectively. The repeatabilities (expressed as relative stan‑ dard deviations, RSDs) were <19%. Therefore, both methods were successfully validated on levels of 0.6 and 3 µg/g lw, with no signifi‑ cant differences regarding recov‑ ery and repeatability. The UHPLC instrumentation proved to yield lower LODs (5 to 10 times lower, see Table I) than the SFC method (probably because of the presence of splitter on the interface of SFC and MS). On the other hand, the SFC proved to be a robust method regarding injection solvent; that is, the use of acetonitrile in this study and isooctane used elsewhere (16), where the samples prepared for GC–HRMS analysis (in isooctane) were also measured by SFC–HRMS (as a complementary method for screening of LCCPs).
Table I: Method performance characteristics of SFC–HRMS and UHPLC–HRMS-based methods.

Matrix Effects Evaluation
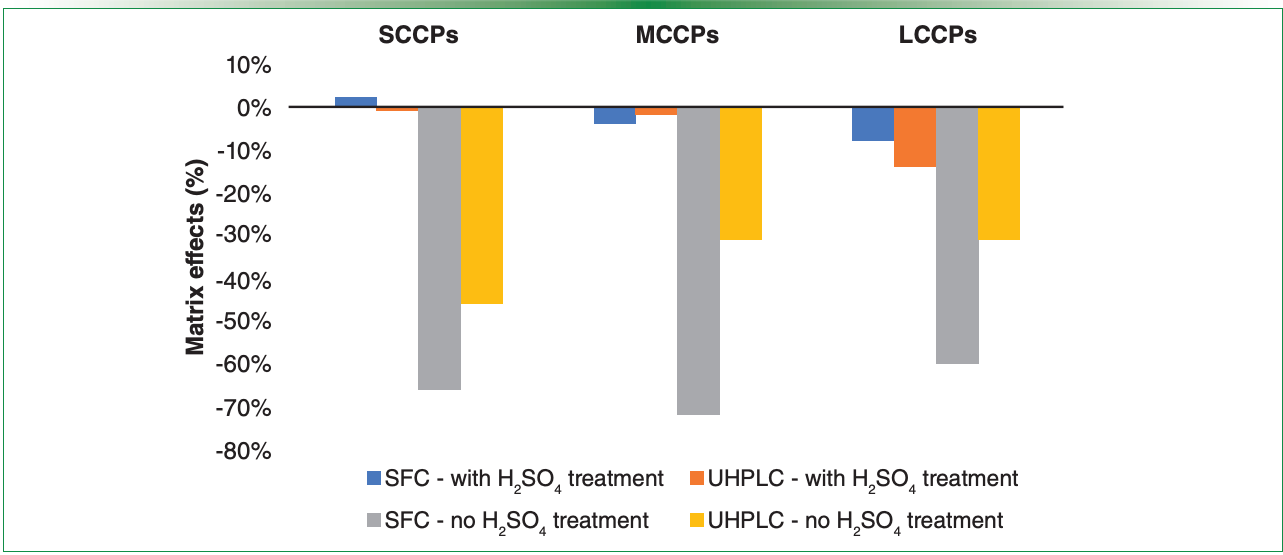
The matrix effects are illustrated in Figure 1. The positive effect of a sulfuric acid treatment is documented there. In samples without the sulfuric acid treatment, there can be seen a strong signal suppression, which was more significant in SFC (with a response decrease of up to 69% for the MCCPs). The signal suppression was presumably caused by methyl or ethyl esters of fatty acids, as these esters are sometimes a dominant form of fatty acids in concentrated fish oil-based dietary supplements (19). The free fatty acids released from ester bonds by sulfuric acid were then separated from CPs on the chromatographic column, decreasing effectively the matrix effects, which was verified by successful validation.
Figure 1: Matrix effects evaluation (at concentration level of 0.6 μg/g lw) with significant signal suppression in samples without sulfuric acid treatment.
SFC and UHPLC Method Comparison
The Determination of CPs in Fish Oil-Based Dietary Supplements
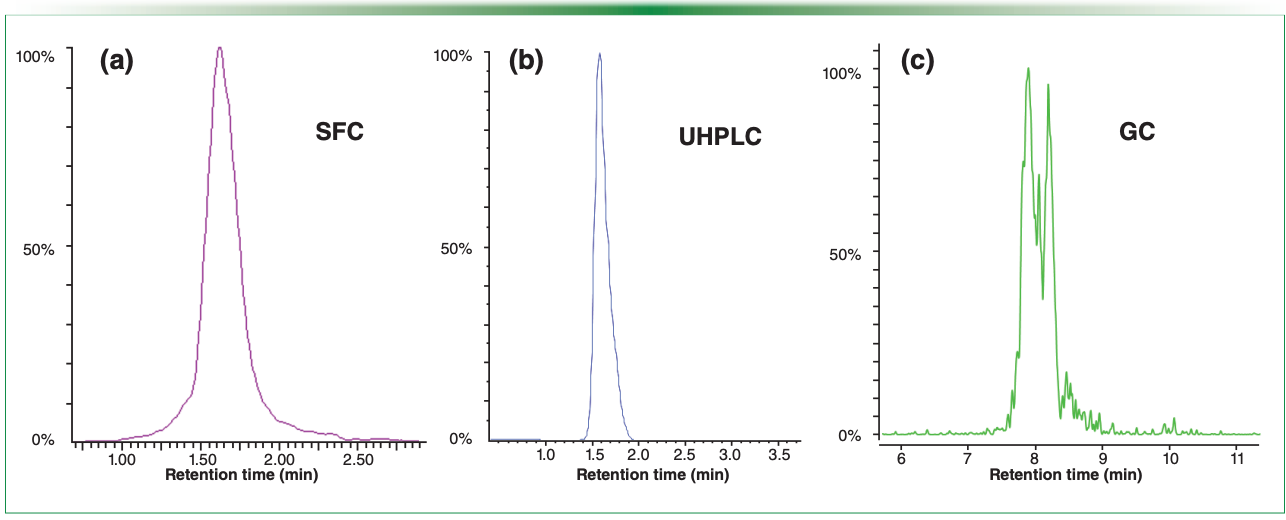
For the developed and validated methods final comparison, the methods were used for determination of CPs in four fish oil-based dietary supplements (Figure 2). Chromatograms illustrating the separation differences of several chromatographic systems are shown in Figure 3. The concentrations of SCCPs and MCCPs obtained employing SFC and UHPLC systems were comparable (considering 30% uncertainty). The concentrations were in the range of 1.01–37.22 µg/g lw (SCCPs) and 0.83–37.76 µg/g lw (MCCPs), respectively. These results were lower than concentrations obtained by GC–HRMS in our previously published study (16). The differences may have been caused by still remaining matrix effects, even after sulfuric acid treatment of the samples. Similarly, concentrations of LCCPs obtained by UHPLC–HRMS (0.10–0.36 µg/g lw) were in samples 3 and 4, both of which were lower than those obtained by SFC–HRMS (0.20–1.59 µg/g lw). The differences might have been caused by slightly higher matrix effects (Figure 1).
Figure 2: Comparison of SFC and UHPLC methods for the determination of CPs in dietary supplements. Although the levels of SCCPs and MCCPs were comparable, the differences of LCCP concentrations might have been caused by matrix effects.
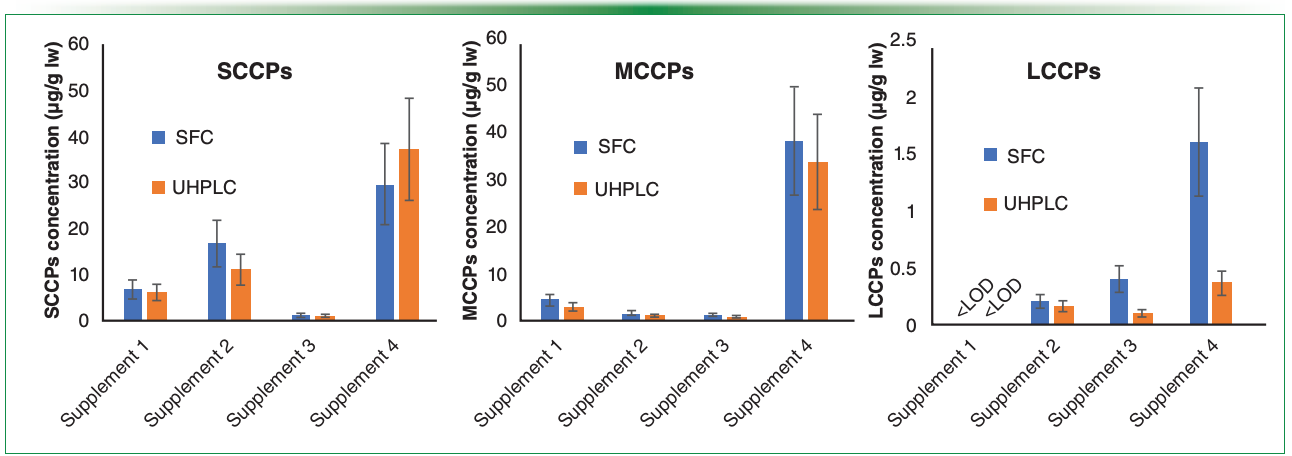
Figure 3: Comparison of extracted ion chromatograms of C13Cl6H22 ([M+Cl]- or [M-Cl]- ion formations) obtained using three instrumental systems: (a) SFC–HRMS (424.952 ± 0.025 m/z), (b) UHPLC–HRMS (424.952 ± 0.005 m/z), and (c) GC–HRMS (354.006 ± 0.007 m/z); the GC–HRMS conditions are described in our previous paper (16).
Conclusions
This article describes a validation of two analytical approaches (employing SFC- and UHPLC‑based methods) with a single sample preparation procedure for the analysis of SCCPs, MCCPs, and LCCPs in fish oil-based dietary supplements. The recoveries ranged from 80 to 96% (with RSDs <19%). The UHPLC instrumentation showed lower LODs than SFC, but SFC demonstrated a good robustness because acetonitrile or isooctane extracts could be analyzed under the same conditions.
The methods were then used to determine CPs contamination in four samples of dietary supplements. The SCCP and MCCP concentrations obtained by both systems were comparable, whereas the LCCP concentrations differed (with UHPLC yielding lower results). The SCCP and MCCP levels were also compared with results obtained employing GC–HRMS (which were previously published). The results obtained by SFC and UHPLC were slightly lower than those obtained by the GC-based method. This might have been caused by matrix effects in some samples, and in the following studies further research is needed (that is, selection of a 13C-labeled CP internal standard and/or use of a more complex clean-up procedure). Finally, the methods are planned to be verified in interlaboratory studies.
Acknowledgments
This work was financially supported by the Czech Science Foundation (21-19437S). The support from the grants of specific university research —grants No. A1_FPBT_2022_005 and A2_FPBT_2021_018—are also gratefully acknowledged.
References
(1) McGrath, T. J.; Poma, G.; Matsukami, H. et al. Short- and Medium-Chain Chlorinated Paraffins in Polyvinylchloride and Rubber Consumer Products and Toys Purchased on the Belgian Market. Int. J. Environ. Res. Public Health 2021, 18 (3), 1069. DOI: 10.3390/ijerph18031069
(2) Wang, C.; Gao, W.; Liang, Y.; et al. Migration of Chlorinated Paraffins from Plastic Food Packaging into Food Sim‑ ulants: Concentrations and Differences in Congener Profiles. Chemosphere 2019, 225, 557–564. DOI: 10.1016/j.chemosphere.2019.03.039
(3) UNEP, Risk Management Evaluation: Short-Chain Chlorinated Paraffins (2016).
(4) van Mourik, L. M.; Gaus, C.; Leonards, P. E.; et al. Chlorinated Paraffins in the Environment: A Review on Their Production, Fate, Levels, and Trends Between 2010 and 2015. Chemosphere 2016, 155, 415–428 (2016). DOI: 10.1016/j.chemosphere.2016.04.037
(5) Li, H.; Gao, S.; Yang, M.; et al. Dietary Exposure and Risk Assessment of Short-Chain Chlorinated Paraffins in Supermarket Fresh Products in Jinan, China. Chemosphere 2020, 244, 125393. DOI: 10.1016/j.chemosphere.2019.125393
(6) IARC: http://monographs.iarc.fr/ENG/Classification/index.php (accessed 11-02-2021)
(7) Stockholm Convention: http://chm.pops.int/Convention/POPsReview‑Committee/Chemicals/tabid/243/Default.aspx (accessed 9-30-2021).
(8) Glüge. J.; Schinkel, L.; Hungerbuhler, K. Environmental Risks of MediumChain Chlorinated Paraffins (MCCPs): A Review. Environ. Sci. Technol. 2018, 52 (12), 6743–6760. DOI: 10.1021/acs.est.7b06459
(9) Perkons, I.; Abdulajeva, E.; Bartkiene, E. et al., Short- and Medium-Chain Chlorinated Paraffins in Commercial Complementary Baby Food Produced in Different European Countries: Occurrence, Congener Group Profiles, Portion-Based Dietary Intake, and Risk Assessment. Sci. Total Environ. 2022, 814, 152733. DOI: 10.1016/j.scitotenv.2021.152733
(10) McGrath, T. J.; Limonier, F.; Poma, G. et al. Concentrations and Distribution of Chlorinated Paraffins in Belgian Foods. Environ. Pollut. 2021, 291, 118236. DOI: 10.1016/j.envpol.2021.118236
(11) Kratschmer, K.; Schachtele, A.; Vetter, W. et al. Short- and Medium-Chain Chlorinated Paraffin Exposure in South Germany: A Total Diet, Meal, and Market Basket Study. Environ. Pollut. 2021, 272, 116019. DOI: 10.1016/j.envpol.2020.116019
(12) Tomasko, J.; Stupak, M.; Hajslova, J.; et al. Application of the GC-HRMS Based Method for Monitoring of Short- and Medium-Chain Chlorinated Paraffins in Vegetable Oils and Fish. Food Chem. 2021, 355, 129640. DOI: 10.1016/j.foodchem.2021.129640
(13) Meziere, M.; Kratschmer, K.; Perkons, I. et al. Addressing Main Challenges Regarding Short- and Medium-Chain Chlorinated Paraffin Analysis Using GC/ECNI-MS and LC/ESI-MS Methods. J. Am. Soc. Mass Spectrom. 2020, 31 (9), 1885–1895. DOI: 10.1021/jasms.0c00155
(14) Bogdal, C.; Alsberg, T.; Diefen‑ bacher, P. S.; et al. Fast Quantification of Chlorinated Paraffins in Environmental Samples by Direct Injection High-Resolution Mass Spectrometry with Pattern Deconvolution. Anal. Chem. 2015, 87 (5), 2852–2860. DOI: 10.1021/ac504444d
(15) Reth, M.; Zencak, Z.; Oehme, M. J. New Quantification Procedure for the Analysis of Chlorinated Paraffins Using Electron Capture Negative Ionization Mass Spectrometry. J. Chromatogr. A 2005, 1081 (2), 225–231. DOI: 10.1016/j.chroma.2005.05.061
(16) Tomasko, J.; Hrbek, V.; Kourimsky, T.; et al. Are Fish Oil-Based Dietary Supplements a Significant Source of Exposure to Chlorinated Paraffins? Sci. Total Environ. 2022, 155137. DOI: 10.1016/j.scitotenv.2022.155137
(17) Li, T.; Wan, Y.; Gao, S.; et al. High-Throughput Determination and Characterization of Short-, Medium-, and Long-Chain Chlorinated Paraffins in Human Blood. Environ. Sci. Technol. 2017, 51 (6), 3346–3354. DOI: 10.1021/acs.est.6b05149
(18) Commision Regulation, Commission Regulation (EU) 2017/644 (2017).
(19) Pieck, C. A.; Crampon, C.; Charton, F. A. New Model for the Fractionation of Fish Oil FAEEs. J. Supercrit. Fluids 2017, 120, 258–265. DOI: 10.1016/j.supflu.2016.05.02
About the Authors
Jakub Tomasko, David Maxa, Klara Navratilova, Tomas Kourimsky, Vojtech Hrbek, Jana Hajšlová, and Jana Pulkrabová are with the Department of Food Analysis and Nutrition at the University of Chemistry and Technology Prague, in Prague, Czech Republic. Direct correspondence to: jana.pulkrabova@vscht.cz
Analytical Challenges in Measuring Migration from Food Contact Materials
November 2nd 2015Food contact materials contain low molecular weight additives and processing aids which can migrate into foods leading to trace levels of contamination. Food safety is ensured through regulations, comprising compositional controls and migration limits, which present a significant analytical challenge to the food industry to ensure compliance and demonstrate due diligence. Of the various analytical approaches, LC-MS/MS has proved to be an essential tool in monitoring migration of target compounds into foods, and more sophisticated approaches such as LC-high resolution MS (Orbitrap) are being increasingly used for untargeted analysis to monitor non-intentionally added substances. This podcast will provide an overview to this area, illustrated with various applications showing current approaches being employed.
New Method Explored for the Detection of CECs in Crops Irrigated with Contaminated Water
April 30th 2025This new study presents a validated QuEChERS–LC-MS/MS method for detecting eight persistent, mobile, and toxic substances in escarole, tomatoes, and tomato leaves irrigated with contaminated water.

.png&w=3840&q=75)

.png&w=3840&q=75)


.png&w=3840&q=75)


.png&w=3840&q=75)


