Analytical Tools for Enabling Process Analytical Technology: HPLC and Quantitative Polymerase Chain Reaction
LCGC North America
How to use these tools to develop an efficient and robust process
To understand the removal of impurities during biopharmaceutical manufacturing processes, analytical techniques such as high performance liquid chromatography (HPLC), enzyme-linked immunosorbent assay (ELISA), and real-time-polymerase chain reaction (PCR) are required. Typically, the product-related impurities are analyzed by HPLC and process-related impurities are analyzed by real time-PCR for host-cell DNA and ELISA for host-cell proteins content. Here, we present work done to enable HPLC and real time-PCR analysis for use as process analytical technology tools.
Manufacturing of a majority of biotech therapeutics involves using a host cell to produce the product of interest. However, the cell produces not only the product of interest, but also various product-related impurities (via deamidation, aggregation, and truncations) and host-cell-related impurities (endotoxins, nucleic acids, and host-cell proteins). This necessitates developing a multistep, robust purification process that is capable of providing adequate clearance to these impurities and yielding a product of purity that meets regulatory expectations. Chromatography often forms the core of the purification process because of its capability to provide high resolution separations, scalability, and robustness.
(GARY S CHAPMAN/GETTY IMAGES)
Process analytical technology (PAT) is a system used for designing, analyzing, and controlling manufacturing through timely measurement (that is, during processing) of critical quality and performance attributes of raw and in-process materials and processes, with the goal of ensuring consistent product quality (1–5). It is important to understand that the goal of PAT is not only the use of these analytical techniques for monitoring, but also to control the manufacturing process to consistently yield the desired product quality (2,3).
When performing process-scale chromatography, because of the high resolution separation being performed, it is often the case that baseline separation between the product and the impurities is not achieved. Typical industry practice in such cases involves fractionation of the product peak into multiple small fractions, analysis of the various fractions for purity, and pooling of the fractions as per preset purity-based pooling criteria (6–8). This practice, however, has its own share of deficiencies. Collection of fractions, sampling of fractions, holding the fractions until analysis is complete, and, finally, pooling of fractions may necessitate open operation and increases the vulnerability toward product contamination. Product degradation may occur while it is held in storage for the analysis of the fractions to be complete (often 10–20 h). High performance liquid chromatography (HPLC) and quantitative polymerase chain reaction (qPCR) are two of the most commonly used analytical methods for monitoring product-related impurities and host-cell nucleic acids, respectively. This article addresses how to use these tools in a manner that facilitates PAT implementation and results in an efficient and robust process.
Case Study
The application under consideration uses process-scale chromatography (cycle time 2 h) to separate the product from a product-related impurity. Presently, the eluate from the column is collected as fractions (every 5 min) and stored until the analytical results are declared. The analysis time is 45 min, and it takes ~10 h for analysis. This long analysis time decreases the productivity of the manufacturing plant. HPLC is used in this case for the measurement of product purity.
Host-cell nucleic acid (DNA) is a critical quality attribute for biotech therapeutics. Near complete removal of DNA is necessary for achieving product approval (9–11). For robust operations, DNA is measured at the various stages of the process: the harvested broth, clarified harvest, affinity chromatography, anion-exchange chromatography, cation-exchange chromatography, and tangential flow filtration. The currently available analytical methods such as the threshold method, slot-blot hybridization, and qPCR require high analysis times (~9 h). Furthermore, presently each sample type requires a different sample preparation protocol, which is often tedious to perform.
In the following sections, we discuss the development of these two methods to enable us to monitor these critical quality attributes (CQA) with the same accuracy and precision as the existing methods, but at a significantly smaller analysis time to facilitate PAT implementation.
Creation of an HPLC Method for PAT Implementation
A key requirement for process analyzers to be used as PAT tools is that the analysis time should be small enough to allow us to make real-time decisions (4,5). For the case of pooling in process chromatography, this would mean that the analysis needs to be done in a few minutes (8). The existing HPLC method had an analysis time of 45 min and therefore required significant reduction in analysis time to be useful as a PAT tool. The original method uses a 150 mm × 4.6 mm, 5-μm particle column with a mobile phase consisting of acetonitrile and water containing 0.01% trifluoroacetic acid. The elution is done in gradient mode wherein acetonitrile content increases from 40% to 54% (v/v) over the period of 40 min followed by column equilibration at 40% acetonitrile for an additional 5 min (referred to as method I). To reduce this time, analytical methods were tested on an Agilent 1290 HPLC system with an HPLC column containing 1.8-μm beads. The effect of chromatography parameters such as temperature, additive concentration, and gradients were tested. Change in the gradient program resulted in the reduction of the analytical time from 45 min to 8 min, 6 min, and finally 5 min. The gradient programs are shown in Figure 1.
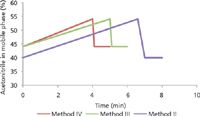
Figure 1: Acetonitrile gradient for different methods tested.
The product retention times as well as the purity and impurity levels when analyzed by the different methods for the same sample are given in Table I.

Table I: Comparison of the various HPLC methods. The same sample was analyzed in all the methods.
The results show that the difference between the percent of product purity obtained with the 45-min method and 5-min method is less than 0.01%. Method IV was the quickest and so it was chosen for PAT implementation, and multiple injections were performed to evaluate the reproducibility of results.
Figure 2 illustrates the performance of HPLC columns for method IV. More than 30 injections were performed on the HPLC instrument with duplicate injections for method II at regular intervals. The results show that retention time for the product peak is reproducible, thus indicating satisfactory column performance over repeated use.
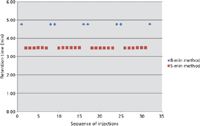
Figure 2: Retention time of the product over multiple injections using method IV. Method II was run intermittently.
In addition, to assess the impact of the different methods the same standards, load, and fractions were analyzed using method I (using an Agilent 1100 system) and method IV (using an Agilent 1290 system). It is evident from the results presented in Figure 3 that both methods provide very similar results.
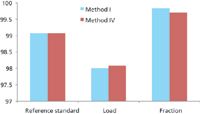
Figure 3: Comparison of methods I and IV for analysis of different samples.
Furthermore, several fractions from process scale chromatography were analyzed using methods I and IV and the results were plotted against each other. R2 was 0.9998, which indicates a very high degree of correlation between the two methods (Figure 4).
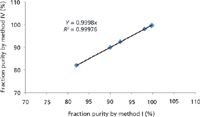
Figure 4: Comparison of results obtained from methods I and IV.
These results clearly suggest that method IV meets all of the required attributes of method I, but is remarkably faster. Therefore, this method could be used for implementation of PAT controls as has been suggested in our earlier publications (6–8).
Creation of a qPCR Method for PAT Implementation
The residual genomic DNA is one of the process-related contaminants in the production of recombinant therapeutic proteins and antibodies expressing in mammalian cells and microbe cultivation systems. Actual quantification of this residual genomic DNA from the protein or antibody samples is a real challenge because of differences in purification matrices at each stage of the manufacturing steps. Drug manufacturers typically perform quantification of residual DNA at each step of purification to evaluate how efficiently the DNA is being removed from the final bulk drug manufacturing process (9–11). Quantitative and consistent recovery of DNA from matrices that have high protein concentration, low pH, or high salt, presents a technical challenge for DNA quantification methods.
Several different methods can be used for detection and quantitation of residual host-cell DNA, including slot-blot, the threshold assay (molecular devices), and quantitative polymerase chain reaction (qPCR). Slot-blot and the threshold assays both measure total DNA and, because they are nonsequence specific, are not affected by the use of dissimilar samples and standards. In addition, they are time consuming (1 day or more) (11). On the contrary, qPCR has the advantage that it is sequence or species specific, is highly sensitive (able to detect picogram levels of DNA), has a high dynamic range of detection, is relatively fast (up to 4 h) to execute, is adaptable to high-throughput formats, and can be used to evaluate the levels of DNA clearance achieved during purification of the protein product (12). It involves detecting and amplifying genomic DNA sequences present in the test samples with the help of specific primers in case of a SYBR (Applied Biosystems) green assay. Wherever TaqMan (Applied Biosystems) chemistry is used, probe sequences are involved in addition to specific primers. The increase in fluorescence and accumulation of the PCR product during the polymerization step is continually monitored throughout the PCR reaction by the instrument. Within the linear range of amplification established for known quantities of DNA, the amount of the residual host-cell DNA in the sample is extrapolated on a standard curve generated from cycle threshold values.
The procedure for qPCR requires subjecting the test sample to DNA extraction followed by DNA quantification using qPCR amplification. Traditionally, the extraction procedure involves sample lysis by a phenol–chloroform method and alcohol-based DNA precipitation. Such a procedure takes close to 6 h for the sample preparation and 3–4 h for the qPCR run (for a total of 10 h). With the introduction of column-based extraction, the DNA recovery from test samples has helped to reduce the time to less than 1 h. In addition, by optimizing the qPCR reaction time for DNA amplification and analysis the run time has been reduced to <2 h, thus making the total turnaround time (from sample extraction to result analysis) 4 h without affecting the end results. This has significantly helped researchers include qPCR as a process analyzer as it is one of the more efficient and robust methods that can be implemented as a PAT tool. For example, it can be implemented for chromatography steps such as affinity, ion-exchange, or hydrophobic interaction chromatography, in which clearance of residual genomic DNA is a critical quality attribute.
A study was carried out using the extraction kit and qPCR reaction master mix from various manufacturers for analysis of various process intermediates. Table II lists the extraction kits and master mixes that were evaluated.

Table II: DNA extraction kits and qPCR master mix reagents used in this study
In this study, samples were analyzed in triplicate and the mean DNA values were reported. Table III lists the acceptance criteria that were set for the study. A Mastercycler ep realplex 2 silver PCR system (Eppendorf North America) was used for this study along with a Stratagene Mx 3000P real-time PCR system (with a computer system running MxPro – Mx3000P v3.20 Build 340, Schema 74, Stratagene) and an Applied Biosystems 7500HT qPCR system.

Table III: Acceptance criteria for the residual genomic DNA quantification assay used in this study
For the method to have adequate sensitivity, the extraction kit and master mix should be equally efficient to overcome the interference and support recovery of the low amount of DNA. Process parameters that affect the performance of the method include
- Buffers salts used during the purification steps (Tris, glycine, polysorbate, sodium phosphate, and sodium chloride)
- Salt concentration
- pH
- Conductivity
- Amount of protein used for sample processing (for column-based DNA extraction)
The interference with the assay was examined by using the sample spiked with a known amount of purified genomic DNA and quantitating the DNA recovery (extraction recovery control sample). The range set for the percentage recovery of the spiked sample was 50–150%. Recoveries out of the specified range were attributed to sample interference. Samples consisted of pools from affinity chromatography, anion-exchange chromatography, cation-exchange chromatography, and the final bulk sample obtained after viral filtration (henceforth mentioned as final bulk sample). The samples were extracted and quantified using combination of three extraction kits and four qPCR master mixes for DNA quantification as mentioned in Table II. The results were evaluated in the form of percent DNA recovery and are shown in Figure 5.
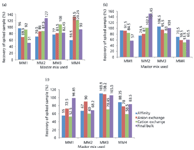
Figure 5: Performance of extraction kit and qPCR master mix based on percent recovery of residual DNA from different process intermediates. The performance was evaluated for four different master mix (MM1âMM4) combinations with the three extraction kits: (a) Kit 1, (b) Kit 2, (c) Kit 3.
Table IV summarizes the extraction kit and qPCR master mix compatibility with the different process intermediates from the protein A manufacturing step. Three extraction kits and the ABI qPCR master mix were found compatible for DNA recovery. Similarly, a combination of one extraction kit and the Abgene mastermix was found suitable.
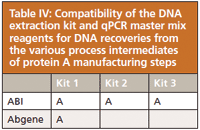
Table IV: Compatibility of the DNA extraction kit and qPCR master mix reagents for DNA recoveries from the various process intermediates of protein A manufacturing steps
Next, the quantitative PCR method was evaluated for robust performance by examining reproducibility. As is evident from Table V, the reproducibility is satisfactory.
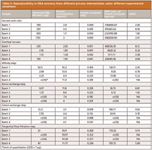
Table V: Reproducibility in DNA recovery from different process intermediates under different experimental conditions
Summary and Path Forward
Traditional methods can be modified to retain the robustness and performance but significantly reduce the time of analysis and thus make them amenable for implementation as a PAT control. In the first case, a 45-min HPLC method was modified to yield a 5-min HPLC method that was sufficient for use as part of a PAT-based control scheme for pooling of process chromatography columns. In the second case, a qPCR method was developed that can do the analysis in 4 h, which otherwise took 10 h. While this is not enough to qualify it for use as a pooling method, it can be used for real-time quality determination of the process intermediate before being loaded onto the next step. There is great potential to continue to make these methods faster and thus, more amenable for use as PAT enablers.
Acknowledgment
Priyadarshini M. is duly acknowledged for the technical assistance during the reagent screening work.
References
(1) PAT Guidance for Industry — A Framework for Innovative Pharmaceutical Development, Manufacturing and Quality Assurance, US Department of Health and Human Services, Food and Drug Administration (FDA), Center for Drug Evaluation and Research (CDER), Center for Veterinary Medicine (CVM), Office of Regulatory Affairs (ORA). September, (2004).
(2) E.K. Read, J.T. Park, R.B. Shah, B.S. Riley, K.A. Brorson, and A.S. Rathore, Biotech. Bioeng.105, 276–284 (2010).
(3) E.K. Read, J.T. Park, R.B. Shah, B.S. Riley, K.A. Brorson, and A.S. Rathore, Biotech. Bioeng.105, 285–295 (2010).
(4) A.S. Rathore, R. Bhambure, and V. Ghare, Anal. Bioanal. Chem.398, 137–154 (2010).
(5) R. Mendhe, I.S. Krull, and A.S. Rathore, LCGC North Amer.30(1), 52–62 (2012).
(6) A.S. Rathore, M. Yu, S. Yeboah, and A. Sharma, Biotech. Bioeng.100, 306–316 (2008).
(7) A.S. Rathore, R. Wood, A. Sharma, and S. Dermawan, Biotech. Bioeng.101, 1366–1374 (2008).
(8) A.S. Rathore, L. Parr, S. Dermawan, K. Lawson, and Y. Lu, Biotechnol. Prog.26, 448–457 (2010).
(9) EU, the European Agency for the Evaluation of medical products: Evaluation of medicinal products for human use, CPMP/BWP/1143/00, 2001.
(10) Food and Drug Administration (FDA), Centre for Biologics Evaluation and Research, February 28, 1997.
(11) Y. Ikeda, S. Iwakiri, and T. Yoshimori, J. Pharm. Biomed. Anal.49, 997–1002 (2009).
(12) D. Venable, G. Miro-Wuesada, J. Calley, E. Manson, and J. He, Bioprocess Int.5(6), 56–61 (2007).
Ira S. Krull is Professor Emeritus of Chemistry and Chemical Biology at Northeastern University, Boston, Massachusetts, and a member of LCGC's editorial advisory board.

Ira S. Krull
Anurag S. Rathore is a biotech CMC consultant and an associate professor with the Department of Chemical Engineering at the Indian Institute of Delhi, India.

Anurag S. Rathore
Rakesh Mendhe is with the Department of Chemical Engineering at the Indian Institute of Technology in Hauz Khas, New Delhi, India.

Rakesh Mendhe
Rahul Fadnis works in research and development at Biocon Limited in Bangalore, India.

Rahul Fadnis
University of Tasmania Researchers Explore Haloacetic Acid Determiniation in Water with capLC–MS
April 29th 2025Haloacetic acid detection has become important when analyzing drinking and swimming pool water. University of Tasmania researchers have begun applying capillary liquid chromatography as a means of detecting these substances.

.png&w=3840&q=75)

.png&w=3840&q=75)


.png&w=3840&q=75)


.png&w=3840&q=75)


