Analysis of Pharmaceutical Residual Solvents Using Comprehensive Two-Dimensional Gas Chromatograhy
LCGC North America
Comprehensive GCxGC was employed for the separation of ICH and USP 1, 2, and 3 pharmaceutical solvents. The significantly improved peak capacity in GCxGC allows a single method for any combination of solvents and mitigates interference due to impurities in the solvents, diluents, analyte matrices, and from column or septum bleed, through the increased separation space.
Analysis of the solvents involved in the manufacturing process is a longstanding regulatory requirement in the pharmaceutical industry. According to the initial guidelines proposed by the International Conference on Harmonization (ICH) and by the United States Pharmacopeia (USP, General Chapter <467>) and European Pharmacopeia (EP), manufacturing solvents must be carefully regulated because they have varying levels of toxicity or environmental hazard and they have no therapeutic benefit (1–3). The solvents are grouped into three classes:

Class 1: Solvents to be avoided because they are highly toxic or are especially hazardous to the environment. Required daily exposure limits are 2–1500 ppm.
Class 2: Solvents with moderate toxicity, including most common solvents used in synthetic processes. Required daily exposure limits are 20–4800 ppm.
Class 3: Solvents with little or no toxicity. Required daily exposure limit of 5000 ppm. If only class 3 solvents are present, they can be quantified by loss on drying, with quantitation by gas chromatography (GC) if the level exceeds 5000 ppm.
There is also a fourth class of solvents for which there is not sufficient toxicological data to establish a requirement. The class 1, 2, and 3 solvents and their maximum exposure limits are shown in Table I along with their comprehensive two-dimensional GC (GC×GC) retention times using the separation conditions described in this article. Maximum daily exposure (MDE) is used to determine the required concentration limit for an individual method. In United States Pharmacopeia (USP) method <467>, Residual Solvents, the required concentration limit is determined from the MDE based upon a daily dosage of 10 g of the final drug product (4). If the dosage is less than 10 g, the allowable detection limit in a method would be higher; if the dosage is more than 10 g, the allowable detection limit is lower.
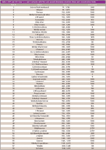
Table I: USP and ICH Class 1, 2, and 3 solvents with first and second dimension retention times and concentration limits
Table I demonstrates the two challenges in developing a single comprehensive GC method for pharmaceutical solvents: there are about 60 compounds in classes 1–3 and the allowable concentration limits can range over three orders of magnitude (2–5000 ppm for a 10-g dose of the drug) within the same sample. While there has been considerable work and there are numerous residual solvents methods reported in the literature, a single comprehensive method encompassing both challenges in one run does not currently exist (5–9). Most methods were designed for individual problems and involve the separation of 3–10 solvents with run times of 10–30 min or more. The large number of compounds coupled with their varying chemistry necessitates the use of separations run on multiple columns of differing selectivity methods if a single method to separate all of them in a reasonable amount of time, as described in USP <467>, is desired.
GC×GC involves two columns, coupled in series by a modulating device that focuses the effluent from the first column and injects it into a second column of differing selectivity. If the second column exhibits sufficient selectivity, overlapping peaks from the first column are separated rapidly. A photograph of the column oven within our GC×GC system is shown in Figure 1. The additional heated zones containing the hot and cold modulator jets and the second-dimension column are seen to the left side of the oven. On this system, the additional components are installed into a modified traditional gas chromatograph.

Figure 1
Effective modulation between the two columns that injects a rapid band onto the second column is the heart of GC×GC. The GC×GC system employs a two-stage modulator, depicted schematically in Figure 2. Modulator timing is critical for effective second-dimension separations. With this system, the first dimension effluent is focused at the head of the second column with a jet of cryogenically cooled nitrogen gas. This band is then heated with a jet of hot nitrogen while a second band is simultaneously focused with a cryogenically cooled liquid nitrogen pulse. This cycle is repeated, allowing the injection of successive focused bands onto the second column. The second-dimension peaks are narrow, often less than 100 ms wide, so the detector is typically set to a rapid acquisition rate. Specialized software separates the continuous data into a multidimensional chromatogram with a longer time first dimension, a rapid second dimension and detector response as the third dimension. Data can be viewed as either a contour plot or a three-dimensional plot.
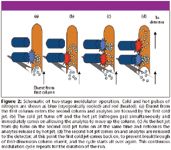
Figure 2
GC×GC has been applied to numerous problems involving separations of complex mixtures in areas including food, flavor, fragrance, petroleum, environmental, and forensic analyses (10,11). In this article, we demonstrate the use of GC×GC for comprehensive separation of the class 1, 2, and 3 pharmaceutical solvents. While USP <467> generally calls for single-dimension GC-FID, other techniques, such as GC×GC or GC–mass spectrometry (MS) can be used with appropriate validation and if equivalency to GC–flame ionization detection (FID) is demonstrated. We discuss the significant additional selectivity and separation advantages from using the second column and demonstrate that GC×GC can perform the identification, confirmation and quantitation steps required by ICH and described in USP <467> in a single experiment.
Experimental
Chemicals and Reagents: Class 1, 2, and 3 solvents and diluents were purchased from Sigma-Aldrich (St. Louis, Missouri) and were used without further purification. They were prepared at concentrations described in the discussion using electronic pipets and Class A volumetric glassware. All solutions were prepared freshly immediately prior to use.
Instrumental: All analyses were performed on a GC×GC FID system (LECO Corporation, St. Joseph, Michigan) using Chroma-TOF FID software for both instrument control and data analysis (LECO). The modulator, secondary oven and associated pneumatics and electronics were installed into a 6890 gas chromatograph (Agilent Technologies, Wilmington, Delaware), retaining the original split–splitless inlet and flame ionization detector. The inlet was split 100:1 with helium as carrier gas in constant pressure mode with a head pressure of 28 psi. The flame ionization detector was operated at 250 °C with air at 450 mL/min and hydrogen at 40 mL/min and with a data acquisition rate of 100/s to accommodate the rapid second-dimension data.
Columns and Temperature Programs
For all analyses, the first-dimension column was a 30 m × 0.25 mm, 1-μm df Rtx-5 column (5% phenyl polydimethylsiloxane, Restek, Bellfonte, Pennsylvania). The second-dimension column was either a 1.1 m × 0.18 mm, 0.1-mm df DB-624 (Agilent Technologies) or a 1.1 m × 0.25 mm, 0.5-μm df Rtx-WAX column (polyethylene glycol, Restek). The second-dimension column is indicated with each chromatogram. The first-dimension column was temperature programmed with a 35 °C hold for 10 min and ramped at 10 °C/min to 220 °C. The modulator oven and secondary column oven were programmed at 40 °C hotter than the first-dimension column, providing a total run time of about 30 min.
Modulation
The modulator was operated to provide a 4-s modulation period and programmed to maintain a temperature 40 °C higher than the main oven. The modulator gave a 0.4-s hot pulse and a 1.6-s cooling time between stages. For the experiment shown in Figure 3, the conditions were the same, except for a 3-s modulation period.
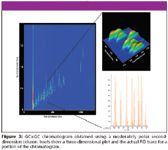
Figure 3
Results and Discussion
Additional separation power in a single analysis is the most important advantage of GC×GC. If the second-dimension column exhibits significantly different chemistry than the first dimension column, an additional separation channel is provided. Figure 3 shows a separation of 57 of the class 1, 2, and 3 solvents dissolved at 1000 ppm in methanol using the DB-624 second-dimension column. This combination can be described roughly as a nonpolar first dimension and a moderately polar second dimension, and it illustrates the basic characteristics of a comprehensive two-dimensional gas chromatogram. This view is a contour plot, looking down onto the separation surface. The lighter colored spots indicate peaks. The first dimension retention time (in seconds) is indicated along the bottom (x axis) while the much shorter second-dimension time (also in seconds) is indicated along the side (y axis). The inset shows a three-dimensional view and the corresponding actual FID trace of a portion of this chromatogram. The data system reconstructs the multiple peaks for each analyte seen in the FID trace into the contour and three-dimensional views.
It is clear that most of the analytes are separated in the first dimension, requiring additional selectivity in a few cases, one of which is highlighted on the chromatogram and shown in the inset. The moderately polar second-dimension column provided some of the needed separation power but not all. There remain a few significant coelutions, shown by the inset, a portion of the overall chromatogram showing the separation of several compounds. This second-dimension separation is, however, highly efficient, with overall peak widths about 100 ms.
To obtain the additional selectivity needed to more fully separate all of the analytes, the second-dimension column was changed to a polyethylene glycol–based stationary phase, Rtx-WAX. This provided significantly different chemistry between the two dimensions, giving a more truly orthogonal separation. A chromatogram showing the especially important Class 2 solvents, again dissolved at 1000 ppm in methanol, is shown in Figure 4. Note the dramatic difference in the peak locations in the second dimension. The polyethylene glycol–based second-dimension stationary phase is much more strongly retaining the more polar analytes and weakly retaining the less polar and nonpolar analytes.
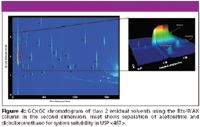
Figure 4
Several characteristics of this chromatogram demonstrate the unique separating power of GC×GC. First, the solvent peak, methanol is seen in the upper left corner of the chromatogram, fully separated from other analytes. The slight tail seen in the first dimension as a shadow extending to the right of the main peak does not interfere with other peaks. This allows the potential use of more common (such as traditional high performance liquid chromatography [HPLC]) solvents such as methanol as the diluent for residual solvent analysis, rather than the currently recommended higher-boiling dimethyl sulfoxide (DMSO) and others, which often contain impurities or decompose, causing interferences in the traditional methods. Second, the selectivity criterion for system suitability in USP <467>, resolution of acetonitrile and methylene chloride (dicholoromethane) not less than 1.0 is more than amply met in the two-dimensional separation. These two are well separated in both dimensions, with Rs about 3 in the first dimension and about 12 in the second, as shown in the highlighted inset. Finally, at the later retention times, the column bleed commonly associated with most capillary columns is clearly separated in the second dimension from several analyte peaks. In a traditional one-dimensional separation, the analyte peaks would have been coeluted with the column bleed, causing potential problems with quantitation.
Figure 5 shows a chromatogram of 57 Class 1, 2, and 3 solvents using the polar second-dimension column with the conditions described previously. The analytes are clearly separated. A few compounds, most notably acetic acid, formic acid, ethylene glycol, and formamide, which are known to often present difficulties in routine GC analysis were not included as these peaks tailed across the entire second dimension. The added selectivity obtained using the two-dimensional separation is critical at the early retention times. Especially in Class 3, many of the compounds are polar small molecules that are not strongly retained on the nonpolar first-dimension column; the polar second-dimension column greatly facilitates their resolution, as seen in the inset. It is clear that GC×GC has the resolving power to separate the pharmaceutical solvents in a single injection, allowing generic method development in most cases. GC×GC can also potentially perform all three steps, identification, confirmation and quantitation, required in the newest release of USP <467> in a single analysis. Depending upon the circumstances of the analysis, these three steps could require three separate injections on two columns with orthogonal chemistry; GC×GC includes both columns in a single analysis. Further, GC×GC can perform many of the additional GC analyses required within individual USP or EP monographs.

Figure 5
Conclusions
GC×GC was used to resolve solvents commonly found in pharmaceuticals and listed in the three solvent classes by the International Conference on Harmonization and the United States Pharmacopeia. A total of 57 class 1, 2, and 3 compounds was fully resolved in a 30-min run time using a 5% phenyl polydimethyl siloxane first-dimension column and a polyethylene glycol second-dimension column with methanol as diluent. GC×GC opens several interesting possibilities including alternative and more convenient diluents, improved direct injection methods and improved analysis time for generic comprehensive methods. The improved resolving power and combined orthogonal analyses on two columns into a single run make GC×GC an ideal choice for generic method development in residual solvents analysis.
Acknowledgments
The authors gratefully acknowledge LECO Corporation for loan of the GC×GC–FID system used in this work, especially Eric Nemec and Pete Stevens for technical assistance. NHS also gratefully acknowledges financial support from the Sanofi-aventis foundation. Restek Corporation provided columns for this work. Mandelle Danser is acknowledged for assisting with sample preparation. This work was presented in-part at the Pittsburgh Conference on Analytical Chemistry and Applied Spectroscopy, Chicago, Illinois, February 2007, paper 103-1.
Christina M. Crimi and Nicholas H. Snow
Department of Chemistry and Biochemistry, Seton Hall University, South Orange, NJ 07079
Please direct correspondence to Nicholas Snow at snownich@shu.edu
References
(1) ICH, Harmonised Tripartite Guideline on Impurities in New Drug Substances. (Q3A), International Conference on Harmonisation of Technical Requirements for Registration of Pharmaceuticals for Human Use (ICH), Geneva, Switzerland, 1997.
(2) USP, Pharmacopeial Forum, 33(3), 1–4 (2007).
(3) The proposed revisions to General chapter <467> have been delayed to July 2008. See http://www.usp.org/uspnf/notices. (accessed on 3 August 2007).
(4) United States Pharmacopeia Thirtieth Revision (USP 30), General Chapter <467> Residual Solvents, 2007.
(5) M. Michulec and W. Wardencki, Chromatographia 64(3-4), 191–197 (2006).
(6) X. Wang, T. Jiang, J. Yuan, C. Cheng, J. Liu, J. Shi, and R. Zhao, Analytical and Bioanal. Chem. 386(2), 399 (2006).
(7) M. Buchanan, LCGC (Suppl.), 57 (2006).
(8) J. Perez Pavon, M. del Nogal Sanchez, P. Garcia, L. Fernandez, M. Esther, and B. Moreno Cordero, Anal. Chem. 78(14), 4901–4908 (2006).
(9) C. Camarasu, C. Madichie, and R. Williams, TRAC Trends in Anal. Chem. 25(8), 768–777 (2006).
(10) J. Dalluge, M. van Rijn, J. VenEDs, R.J.J. Vreuls, and U.A.Th. Brinkman, J. Chromatogr., A, 965, 207–217 (2002).
(11) N. Snow, "Comprehensive Two-Dimensional Gas Chromatography" in Advances in Chromatography, N. Grinberg and E. Grushka, Eds. (CRC Press, Boca Raton, Florida, 2006).

New Study Reviews Chromatography Methods for Flavonoid Analysis
April 21st 2025Flavonoids are widely used metabolites that carry out various functions in different industries, such as food and cosmetics. Detecting, separating, and quantifying them in fruit species can be a complicated process.
University of Rouen-Normandy Scientists Explore Eco-Friendly Sampling Approach for GC-HRMS
April 17th 2025Root exudates—substances secreted by living plant roots—are challenging to sample, as they are typically extracted using artificial devices and can vary widely in both quantity and composition across plant species.
Sorbonne Researchers Develop Miniaturized GC Detector for VOC Analysis
April 16th 2025A team of scientists from the Paris university developed and optimized MAVERIC, a miniaturized and autonomous gas chromatography (GC) system coupled to a nano-gravimetric detector (NGD) based on a NEMS (nano-electromechanical-system) resonator.

.png&w=3840&q=75)

.png&w=3840&q=75)


.png&w=3840&q=75)


.png&w=3840&q=75)


