Analysis of Peptide Mixtures for Proteomics Research Using LC–ESI-MS with a Simple Microgradient Device
LCGC North America
This work presents an on-line combination of a simple microgradient device for reversed-phase liquid chromatography (LC) and electrospray ionization (ESI) tandem mass spectrometry (MS-MS).
This work presents an on-line combination of a simple microgradient device for reversed-phase liquid chromatography (LC) and electrospray ionization (ESI) tandem mass spectrometry (MS-MS). The formation of an S-shaped gradient of the strong mobile phase (based on acetonitrile) inside a microsyringe is described under the conditions applied for capillary separation of proteomic samples and their analysis using ESI-MS-MS on a hybrid instrument. The system was successfully tested for a complex peptide mixture originating from the digestion of the whole-cell lysate from Francisella tularensis subsp. Schu S4 and it represents a cheap alternative for the separation of both simple and complex peptide mixtures before MS analysis.
There are many methods available for studying biological systems that are commonly applied with the aim to describe their structure and function. Biological samples are usually very complex (for example, in the case of analyzing proteomes) and thus the only possibility to obtain valuable results often resides in an efficient sample separation. So far, various separation techniques have been introduced in proteomics (1). Protein separation by one-dimensional (1D) or two-dimensional (2D) gel electrophoresis (2) is usually followed by an enzymatic or chemical protein digestion. The obtained peptide mixtures can be directly analyzed or further separated depending on the researcher's choice, needs, and experimental design. During the last few years, liquid chromatography (LC) has had widespread use as a separation technique for proteins and peptides (3,4). In the shotgun proteomics strategy, which involves the initial digestion of the whole protein sample, an efficient chromatographic separation of peptides is required before recording tens of thousands of tandem mass spectra (5). This is in contrast with matrix-assisted laser desorption–ionization time-of-flight (MALDI-TOF) peptide mass fingerprinting, where intact proteins are separated by 1D or 2D gel electrophoresis before digestion and analysis (6). LC techniques hyphenated with mass spectrometry (MS) are already well-established in the pharmaceutical, biotechnological, nutrition and health care, and chemical industries (7).
Peptides are separated either by LC or nanoflow LC (nanoLC) connected on-line or off-line to electrospray ionization (ESI) MS or off-line to MALDI MS (4,8,9). This is applicable for complex peptide mixtures in shotgun proteomics as well as for digested protein fractions from 1D electrophoresis gel slices or less complex peptide mixtures coming from 2D gel electrophoresis spots. Various commercial 2D LC systems are available for separating peptides (10,11), which couple two mutually orthogonal LC separation techniques. In a typical arrangement, the first dimension is based on a strong cation exchanger whereas the second dimension is run on a reversed-phase column. The separations may be run on sophisticated and expensive commercial LC systems or on specialized 1D LC systems designated for proteomics (such as for the particular separation of peptides). Although LC peptide separation is useful, it is also costly and time consuming. The relatively low sensitivity of conventional LC hampers its applicability for the analysis of biological samples, such as peptides from protein digests in proteomic research. This low sensitivity in LC is because of the low levels of endogenous proteins and the large dynamic range of proteomes (12). Moreover, samples to be analyzed are also frequently available in tiny amounts (at the microliter level). For that reason, LC systems have already been miniaturized to achieve higher sensitivity namely in coupling with electrospray mass spectrometers as detectors. Currently, nanoLC separations are performed using flow rates in the range of several hundreds of nanoliters per minute (13).
A simple microgradient-generating device has been introduced (14), where an S-shaped acetonitrile gradient was easily formed in a microsyringe with a 250-μm i.d stainless steel needle. The gradient emerged in the region where the needle spreads into the interior of the syringe. Such a way of preparation provided a high reproducibility of retention times (relative standard deviation [RSD] of about 0.1%) and stability of the gradient inside the syringe for several hours. This was verified using electrochromatography on a monolithic polyacrylic column and seven alkylphenones as a model mixture (14).
An off-line device for both preconcentration and separation of peptides (with elution using a linear gradient of acetonitrile formed in a microsyringe followed by MALDI-TOF MS-MS analysis) was also reported (15). The peptide mixture was separated using a reversed-phase monolithic capillary column and the elution was performed by a gradient of acetonitrile from 0% to 60% (v/v) in water containing 0.1% (v/v) trifluoroacetic acid. The main part of this system was represented by a gastight 50-μL microsyringe, where the acetonitrile gradient was formed because of a turbulent mixing of the strong and weak mobile phases in the high-dispersion region of the syringe. This region is formed by a steep extension of the tube diameter between the needle end and glass syringe barrel. Fractions of the separated mixture were then directly spotted onto a MALDI target that had been covered with α-cyano-4-hydroxycinnamic acid as a matrix. Consequently, MALDI-TOF-TOF-MS measurements were done. The results obtained after preconcentration and separation were significantly better than those measured after a direct sample deposition (15). Despite its obvious simplicity, the system was sophisticated enough and efficient in the separation of peptide mixtures from protein digests, which resulted in an increased identification rate and higher sensitivity of analyses. Recent studies have also demonstrated the applicability of the system for an elegant analysis of protein post-translational modifications such as N- and O-glycosylations (16–18).
The aim of this work was to introduce a simple gradient device coupled on-line to ESI-MS with the purpose to present an alternative and cheap gradient LC separation system for MS analysis of moderately complex mixtures that can be used especially in the case when no suitable LC system is available. The gradient was generated in a microsyringe before the separation of peptides on a capillary column. A syringe infusion pump was used to deliver the mobile phase. The system was first optimized for a tryptic digest of bovine serum albumin (BSA) and then run with a Francisella tularensis lysate. Its applicability for survey analyses in proteomics was confirmed.
Experimental
Chemicals and Consumables
Acetonitrile, formic acid, and water were of LC–MS-grade quality, and acetone was of LC-grade quality (Sigma-Aldrich Chemie). A standard tryptic digest of BSA was from Bruker Daltonik. Reprosil-Pur C18-AQ 5-μm particles were obtained from Dr. Maisch. PEEK microtight unions (5/16–24, 360-μm o.d.) were obtained from Upchurch Scientific and polyimide-coated fused-silica capillaries (360-μm o.d., 200-μm or 100-μm i.d.) were obtained from Agilent Technologies.
Preparation of Samples from Francisella tularensis subsp. tularensis Strain Schu S4
Ready-to-analyze protein digests were provided by Professor Lenka Hernychová of the University of Defence in Hradec Králové, Czech Republic. In brief, they were prepared as follows: The whole cell lysate was obtained by disruption of harvested bacterial cells using a French press (19); proteins were then isolated from the lysate by a trichloroacetic acid–acetone precipitation procedure (20) and finally subjected to reduction, alkylation, and in-solution digestion by bovine trypsin at 37 °C overnight (21).
Setup of the Microgradient Device
The chromatographic separation device used in this work consisted of a KDS100 syringe infusion pump (KD Scientific, Holliston), a gastight 50-μL syringe (ILS Innovative Labor Systeme GmbH or SGE Analytical Science) and a capillary-based flow system (Figure 1a). When mounted into the infusion pump, the microsyringe was connected to a capillary (250-mm long, 360-μm o.d., 200-μm i.d.; loading volume of 7.85 μL) through a microtight union. Another microtight union was used for connecting the loading capillary to a capillary column (100-mm long, 360-μm o.d., 100-μm i.d.; containing C18 5-μm particles). At this particular place, the system was only disconnected when introducing mobile phases into the syringe and individual samples into the 250-mm-long capillary serving thus as a sampling loop. At the opposite end, the capillary column was tightly connected to the nanospray needle of the ESI-MS instrument (Figure 1b). The capillary separation column was packed with the C18 sorbent resuspended in methanol using a capillary loader tool (The Loader Kits, Proxeon). The packed column was washed with acetonitrile before use.
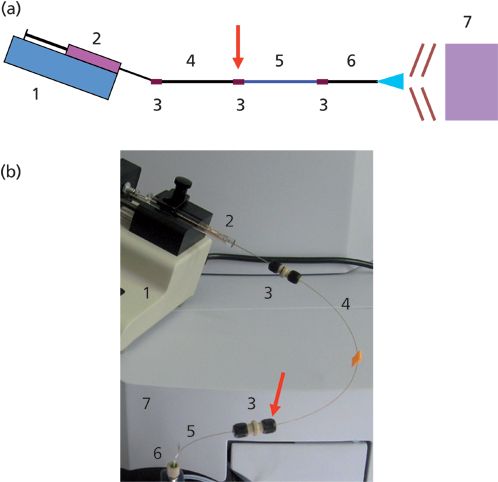
Figure 1: The microgradient device coupled to an ESI mass spectrometer: (a) a scheme of the whole setup and (b) a photograph showing implementation of the device for nanoLC–MS. 1 = syringe infusion pump, 2 = microsyringe, 3 = microtight union, 4 = injection capillary for sample loading, 5 = capillary column, 6 = nanospray needle, 7 = ESI-QTOF instrument. An arrow denotes the microtight union, which is disconnected for sample loading.
Chromatographic Separations
Mobile-phase A consisted of 0.1% (v/v) formic acid in water, and mobile-phase B was 0.1% (v/v) formic acid in acetonitrile. The following mobile phases were used to form the microgradient: 2%, 20%, 40%, and 60% (v/v) B. Before the analyses, peptide samples were dissolved in 2% (v/v) B in A. To introduce sample and prepare the microgradient, the flow system was disconnected between the capillary column and loading capillary. The column was wetted with 80% (v/v) B and equilibrated with 2% (v/v) B, and the microsyringe was then washed out with 60% (v/v) B. The microgradient was formed by spontaneous mixing of mobile phases after a consecutive aspiration of their aliquots through the loading capillary in the following order: 60% (v/v) B, 40% (v/v) B, 20% (v/v) B, and 2% (v/v) B (see Results and Discussion section). Finally, the sample in 2% (v/v) B was aspirated into the loading capillary. After that, the microsyringe became filled up with the microgradient and the sample was ready for separation initiated after repeated assembling of the whole flow system. During separation, the flow rate was set at 250 nL/min.
Modeling of the Gradient Profile
For visualization of the gradient profile in microsyringe during modeled separation runs omitting ESI-MS, mobile-phase B was composed of 0.1% (v/v) formic acid in acetonitrile containing 1% acetone. The addition of acetone allowed monitoring the increasing content of acetonitrile in the mobile phase by UV spectrophotometry at a detection wavelength of 275 nm (14). Sample loading was simulated by aspirating a blank of 2% (v/v) B.
MS and Data Processing for Identification of Proteins
The instrument used was a maXis ultra-high-resolution QTOF tandem mass spectrometer equipped with a nanoelectrospray ion source (Bruker Daltonik). Measurements were run in a data-dependent manner. From each survey scan, four precursors were selected automatically for collision-induced dissociation (CID) fragmentation and MS-MS spectra acquisition. The whole system was controlled by QTofControl 3.2 software (Bruker Daltonik) at the following settings: Source settings: capillary voltage: 4000 V; dry gas: 6 L/min, dry temperature: 160 °C. Tune page settings: ion funnel RF: 400 Vpp; multipole RF: 400 Vpp; quadrupole ion energy: 5 eV; collision energy: 8 eV; collision RF: 1200 Vpp; ion cooler RF: 350 Vpp; transfer time: 85 μs; pre-pulse storage: 7 μs. MS-MS settings: auto MS-MS: on; 4 precursor ions; threshold for switching from MS to MS-MS mode: 5000 cts; active exclusion after 5 spectra for next 18 s; excluded mass range of precursors: 50–350 amu and 1500–2200 amu. All data were collected over the mass range of 50–2200 amu with an acquisition time of 500 ms for MS and 250–750 ms for MS-MS according to precursor intensity.
Raw data were processed by DataAnalysis v.4.2 SP4 (Bruker Daltonik) and saved as mgf files. Searches for protein identification were done using the Mascot 2.4.1 search engine (in-house server; Matrix Science) either against SwissProt 3.9.2014 or a custom sequence database consisting of Francisella tularensis subsp. tularensis strain Schu S4 proteins (downloaded from the UniProtKB database; 1528 entries). Each search was performed with a mass tolerance for precursors and corresponding fragment ions of ±50 ppm and ±0.05 Da, respectively. Search parameters were as follows: Trypsin was set as a protease with one missed cleavage allowed; carbamidomethylation of cysteine was set as a fixed modification and oxidation (M), acetyl (protein N-term), Gln->pyroGlu (N-term Q), Glu->pyroGlu (N-term E), Pyro-carbamidomethyl (N-term C), variable modification; +2 and +3 was set as a peptide charge; other settings - expectation value for peptides: 0.01, significance threshold: p < 0.05, false discovery rate: <1%.
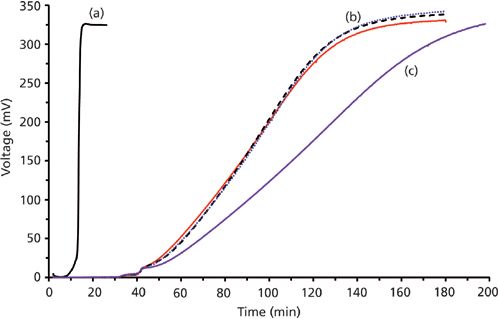
Figure 2: UV detection records of the gradient shape formed in the microsyringe of the microgradient system. The mobile phases used were 0.1% (v/v) formic acid in water (A), and 0.1% (v/v) formic acid in acetonitrile with the addition of 1% (v/v) acetone allowing UV detection of the gradient shape at 275 nm (B). Three elution arrangements were used (the respective solutions are described in the order of their consecutive aspiration into the microsyringe through the loading capillary (the order of elution was thus reverse): (a) 3 μL of 60% (v/v) B and 3 μL of 2% (v/v) B were loaded only into the sample loading capillary-in fact, this represents an isocratic elution; (b) three repetitions (represented by solid, dotted, and dashed lines) of a two-step gradient elution consisting of 12 μL of 60% (v/v) B, 22 μL of 2% (v/v) B, and 1 μL of blank (the same 2% [v/v] B solution mimicking a sample) showing the reproducibility of gradient formation; (c) a four-step gradient elution consisting of 12 μL of 60% (v/v) B, 8 μL of 40% (v/v) B, 8 μL of 20% (v/v) B, 20 μL of 2% (v/v) B, and 1 μL of blank.
Results and Discussion
This work describes a microgradient LC device for proteomic analyses, which can simply be used when coupled to a nanoelectrospray ion source on those occasions where no nanoLC system is available. The present system can be run at flow rates of a few microliters down to several hundred nanoliters per minute and thus it fits the nanoESI setups commonly used in proteomic analyses.
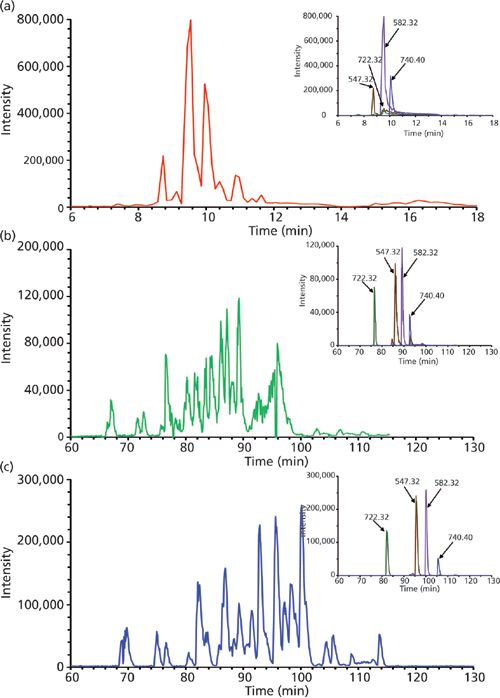
Figure 3: Nanoflow microgradient LC separation of tryptic digest of BSA (100 fmol). Column: 100 mm × 100 μm, 5-μm Reprosil-Pur C18-AQ (Dr. Maisch); mobile-phase A: 0.1% formic acid in water; mobile-phase B: 0.1% formic acid in acetonitrile. (a) Isocratic elution-the gradient was aspirated as 25 μL of 60% (v/v) B plus 1 μL of sample; (b) two-step gradient elution-the gradient was aspirated as 12 μL of 60% (v/v) B, 22 μL of 2% (v/v) B plus 1 μL of sample; (c) four-step gradient elution-the gradient was aspirated as 12 μL of 60% (v/v) B, 8 μL of 40% (v/v) B, 8 μL of 20% (v/v) B, 20 μL of 2% (v/v) B plus 1 μL of sample. The main panels show base peak chromatograms (m/z range of 460–1200), and the insets show the corresponding extracted ion chromatograms of four selected precursors with m/z values of 722.32, 547.32, 582.32, and 740.40 demonstrating the efficiency of peptide separation under various modes.
Before chromatographic experiments, the gradient shape in the microsyringe was assessed by recording UV spectra of the eluate. Figure 2 shows a comparison of data acquired from three arrangements and resulting in isocratic, two-step, and four-step gradient elution modes. The isocratic arrangement was set to aspirate the strong and weak mobile phases only into the capillary. Almost no mixing of the mobile phases appeared in this case, which comes out from a sharp increase in the concentration of acetonitrile-containing strong mobile phase as monitored by ultraviolet (UV) absorption (Figure 2, chromatogram 1). On the other hand, the aspiration of the strong and weak mobile phases into the microsyringe through the capillary resulted in a mixing of both mobile phases and the UV trace of eluent showed a gradual increase in acetonitrile concentration (Figure 2; chromatograms 2 and 3 depict a two-step and four-step gradient, respectively). This result shows that the turbulent mixing, which appears inside the microsyringe, is important for the acetonitrile gradient formation. As can be seen in the case of the two-step gradient (Figure 2, chromatogram 2), the gradient shape was reasonably reproducible for all three repetitions of manual loading and the use of four-step elution (Figure 2, chromatogram 3) provided a less steep gradient curve according to expectations.
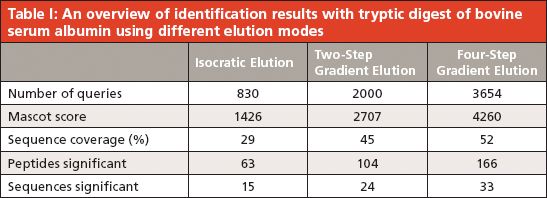
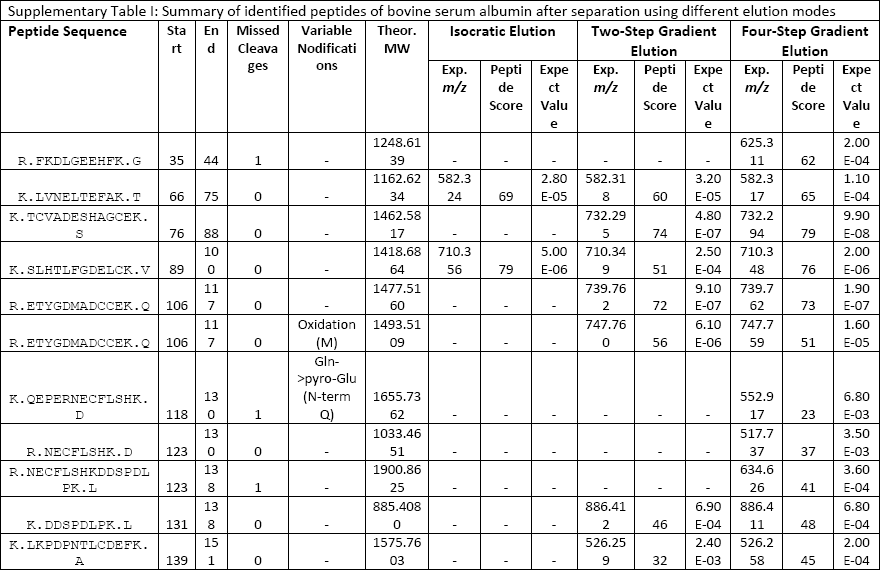
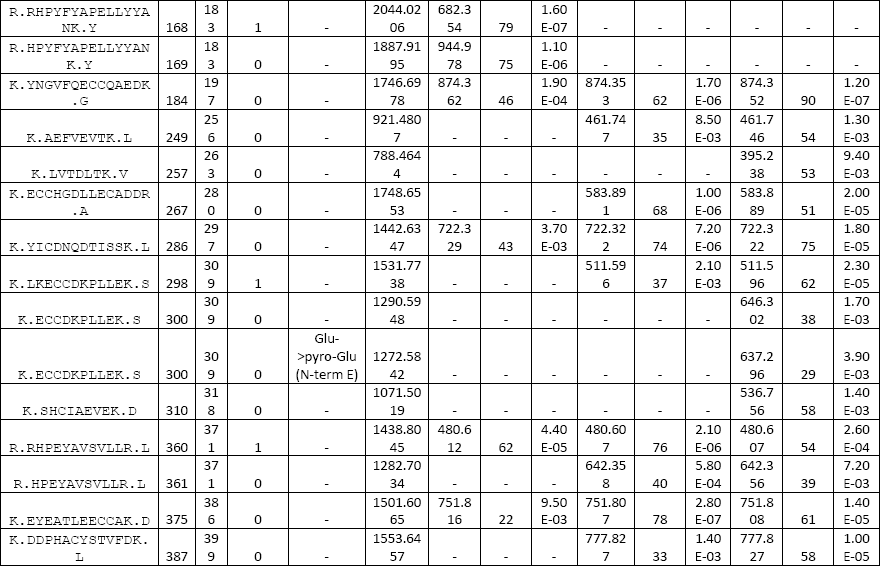
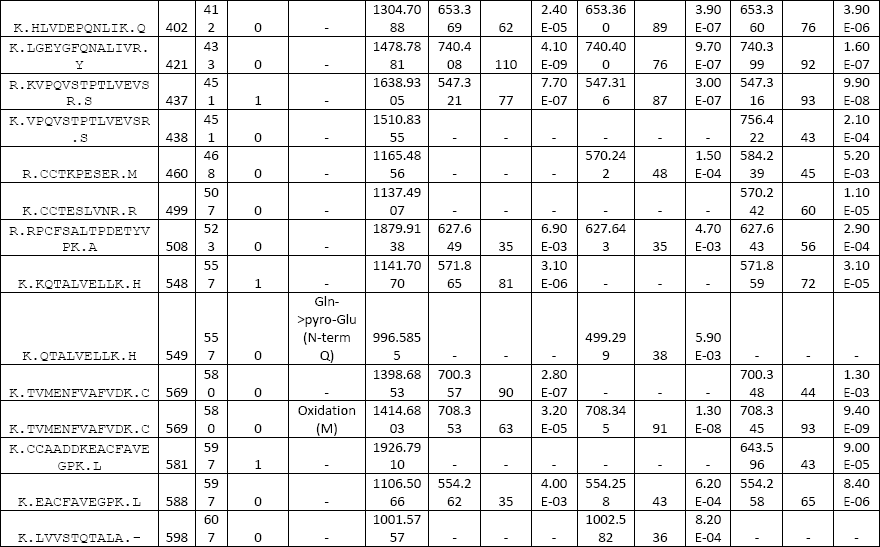
All three elution modes were also examined in experiments performed to separate peptides from a tryptic digest of BSA. The reason was to optimize the whole instrumental setup for more-complex samples. A comparison of the obtained results is presented in Figure 3. The simple isocratic elution with 60% (v/v) acetonitrile led to a fast elution of BSA tryptic peptides (a duration of about 4 min since the time when the first BSA peptide appeared in the eluate). A low separation efficiency was observed in this case, as it is presented in the inset of Figure 3a, where extracted ion chromatograms (XICs) of four selected peptide precursors of BSA are shown. The elution of these precursors occurred during a short time window (within 2.5 min) and a significant overlapping of signals (for example, those for the precursors at m/z 722.32 and 582.32) appeared. The two-step gradient (2% and 60% [v/v] acetonitrile) prolonged the duration up to 35 min. Selected monitored precursors were eluted within about 19 min and were separated successfully (Figure 3b, inset) in this arrangement. Finally, the four-step gradient (2–20–40–60% [v/v] acetonitrile) achieved much better separation: peptides were eluted in a time window of about 50 min and selected monitored precursors were nicely separated within about 26 min (Figure 3c, inset). Compared to isocratic elution, the results of MS analysis were improved in several parameters: number of acquired MS-MS scans, number of significant peptide hits and sequences in the Mascot search, overall protein sequence coverage, and Mascot probability-based score as a confidence measure of identification results. Thus, a significant improvement was observed not only when comparing the isocratic and two-step gradient arrangements, but namely when upgrading to the four-step gradient setup. Table I summarizes data from the above separations and demonstrates the highest identification rate in that case when the four-step gradient was used (Mascot score = 4260, sequence coverage = 52%, number of sequences = 33). In addition, a complete list of peptides confirmed from ESI MS-MS sequencing and database search can be found in supplementary tables (available at chromatographyonline.com/Rehulka-supplementary). These results clearly confirm the advantages of application of the given microgradient setup for proteomic experiments.
A tryptic digest made from the whole cell lysate of Francisella tularensis subsp. tularensis strain Schu S4 was chosen for evaluation of the performance of the microgradient separation with a complex peptide sample. F. tularensis is a pathogenic Gram-negative bacterium that is the causal agent of the serious infectious disease called tularemia (22). F. tularensis subsp. tularensis is the most virulent form of the microbe (23). The molecular mechanisms responsible for the pathogenicity are not completely understood (24). So far, no safe and efficient vaccine that would protect against multiple strains has been developed (25). In this context, identifying immunogenic proteins in proteomic studies may represent a step forward.
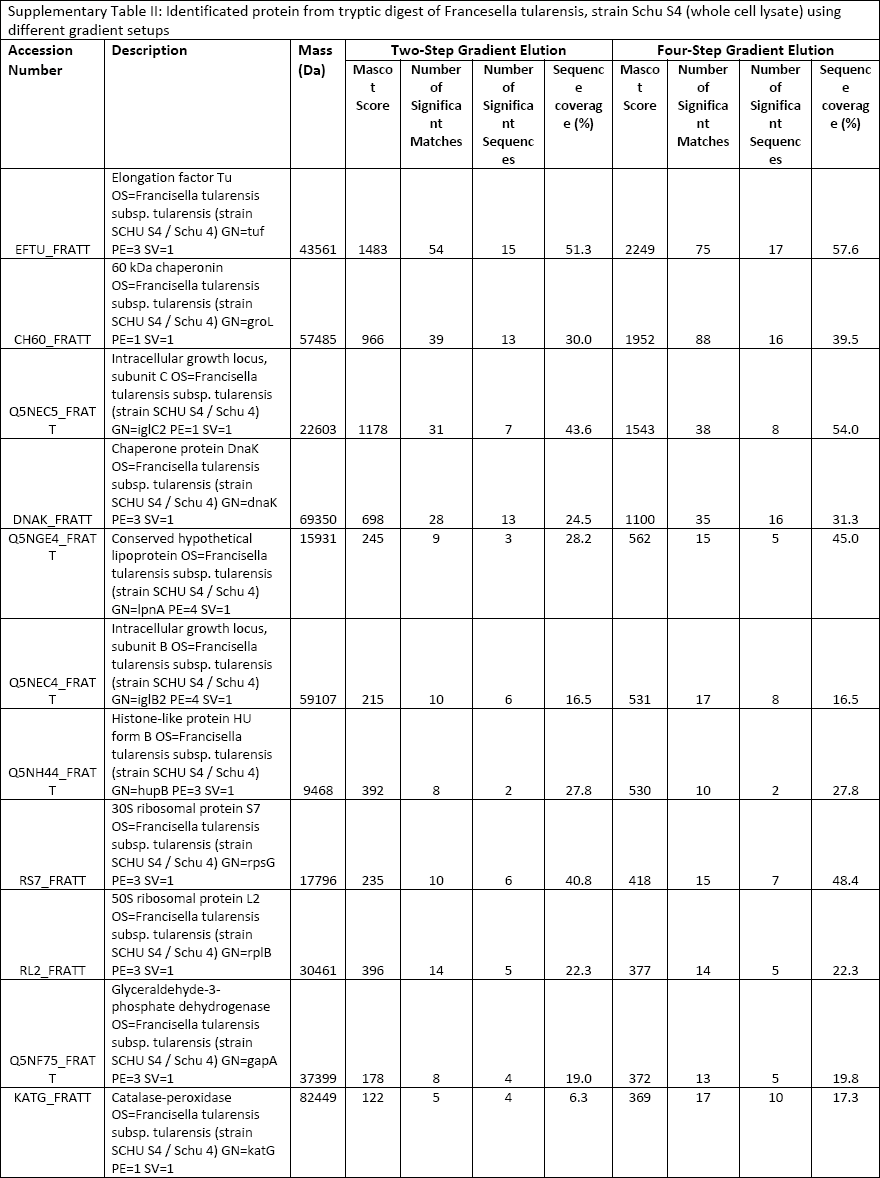
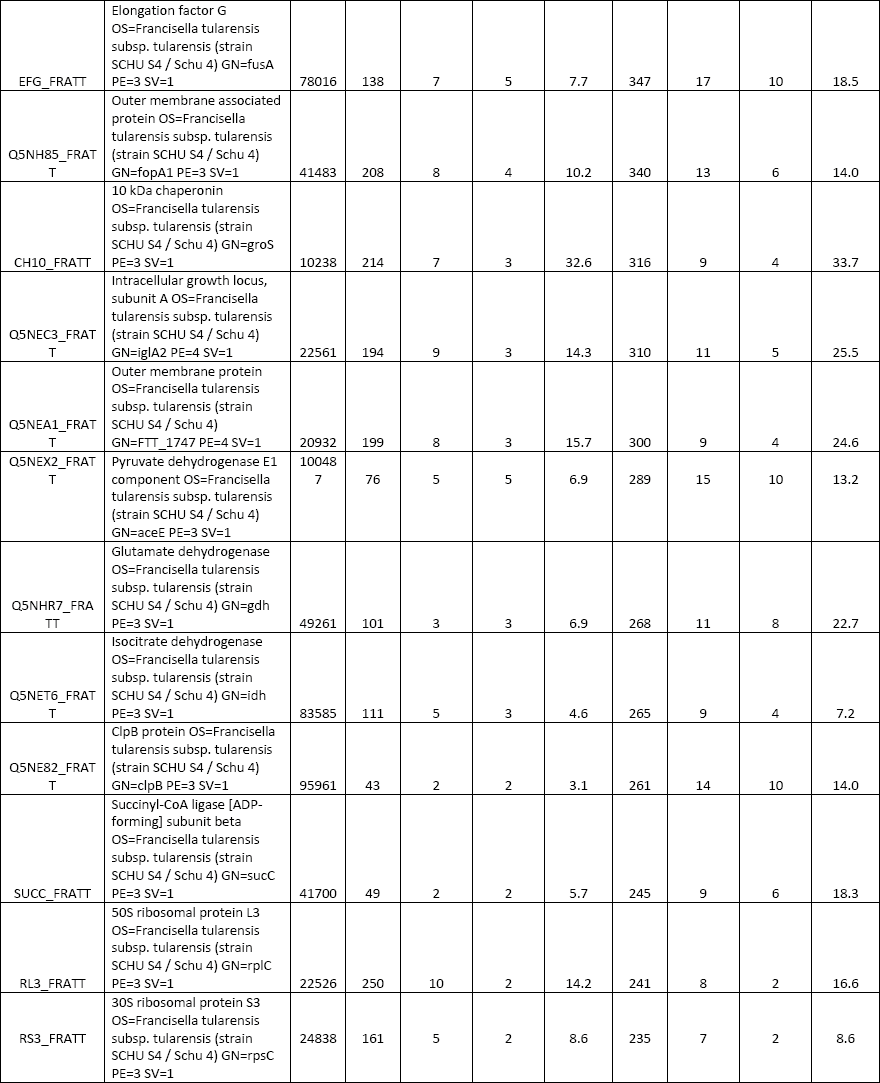
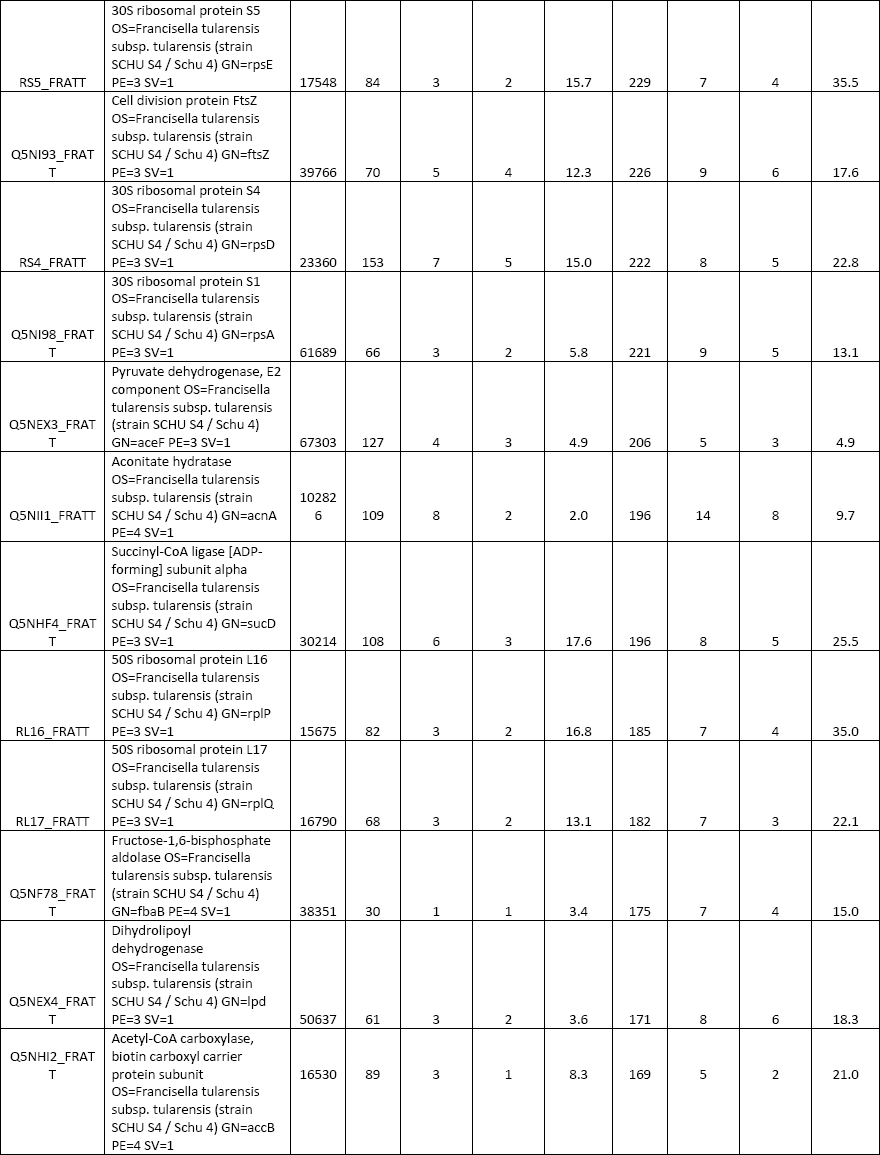
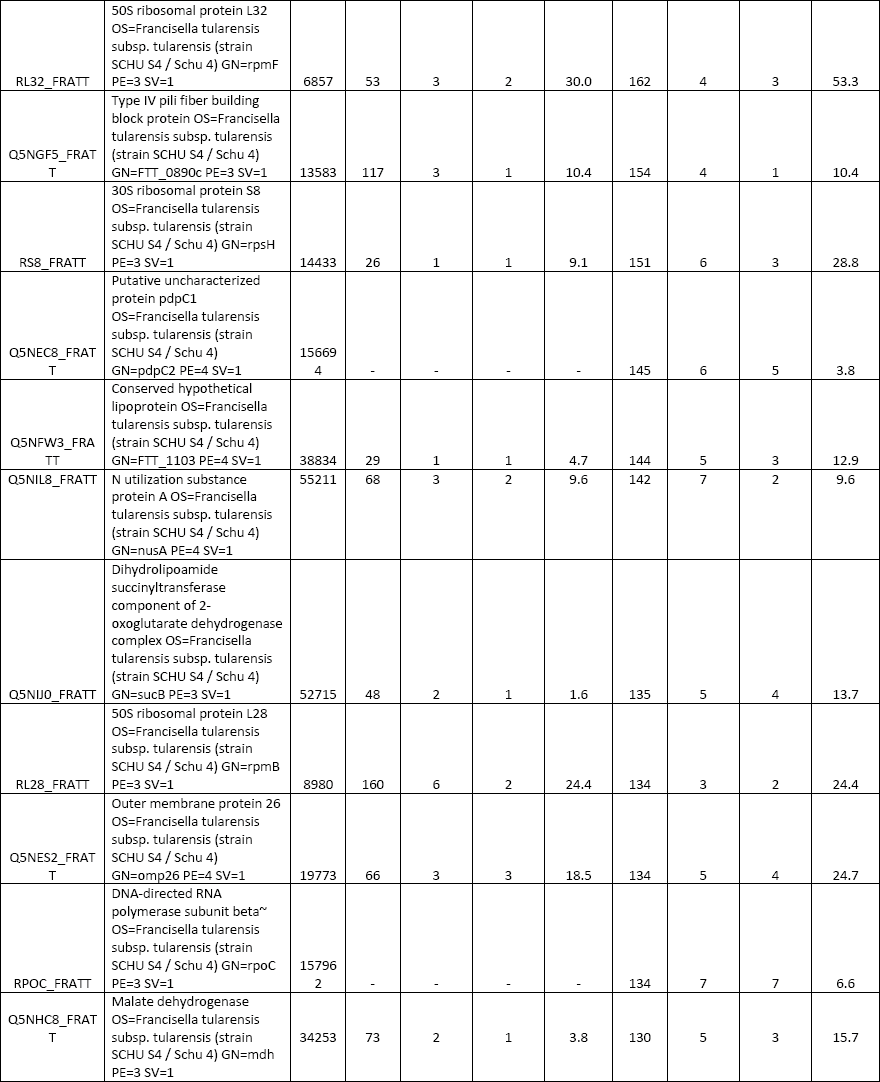
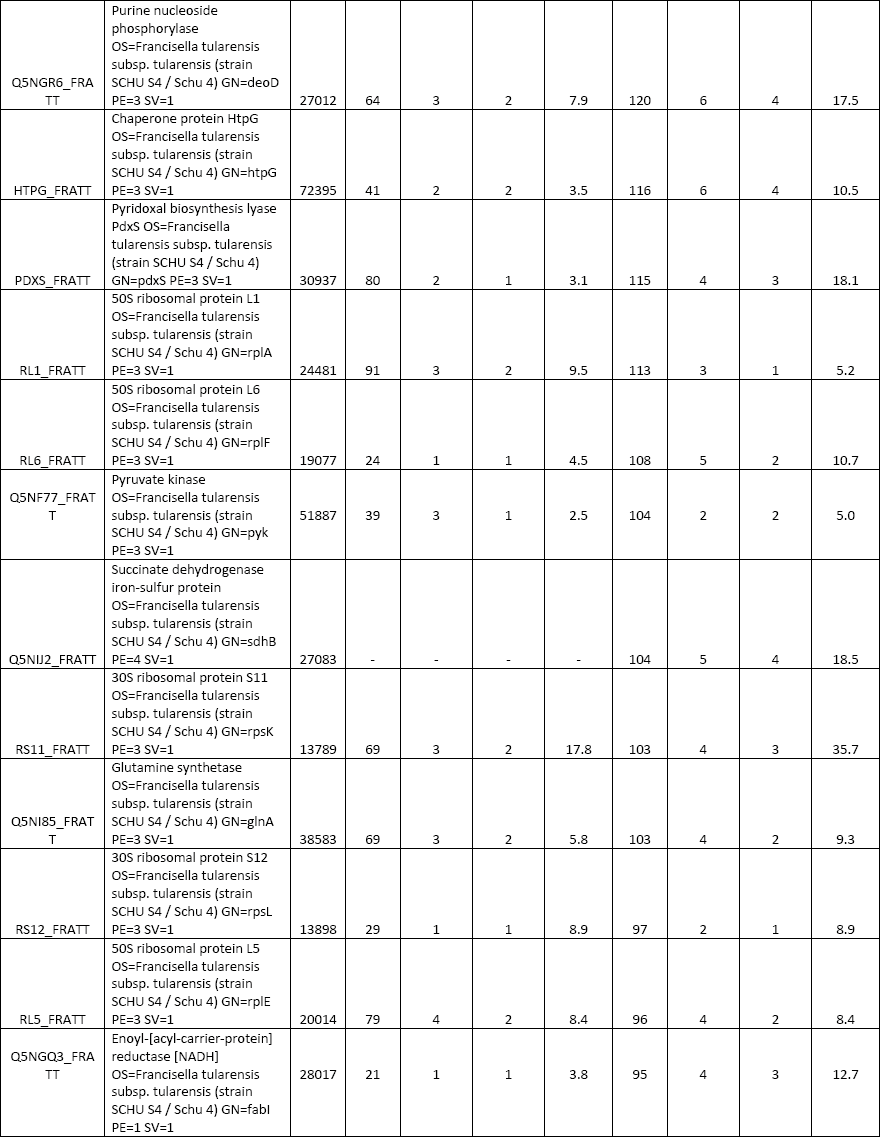
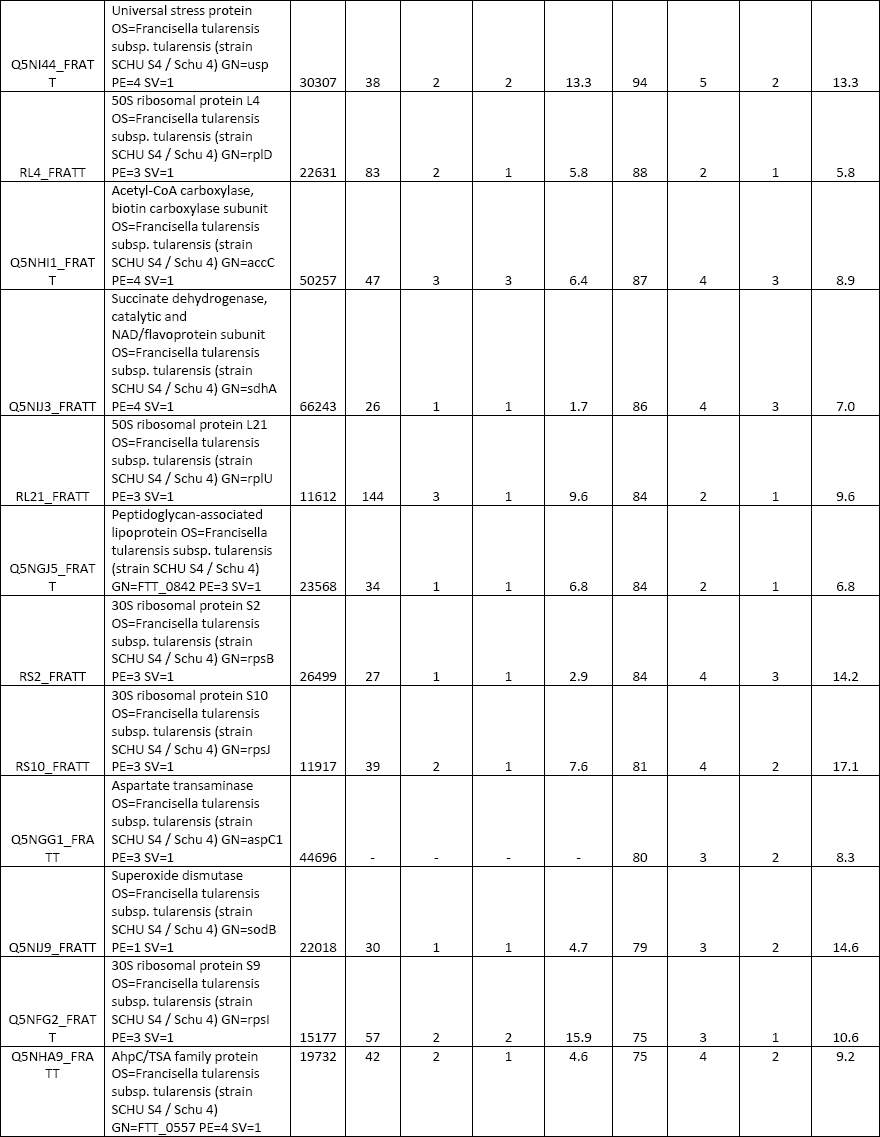
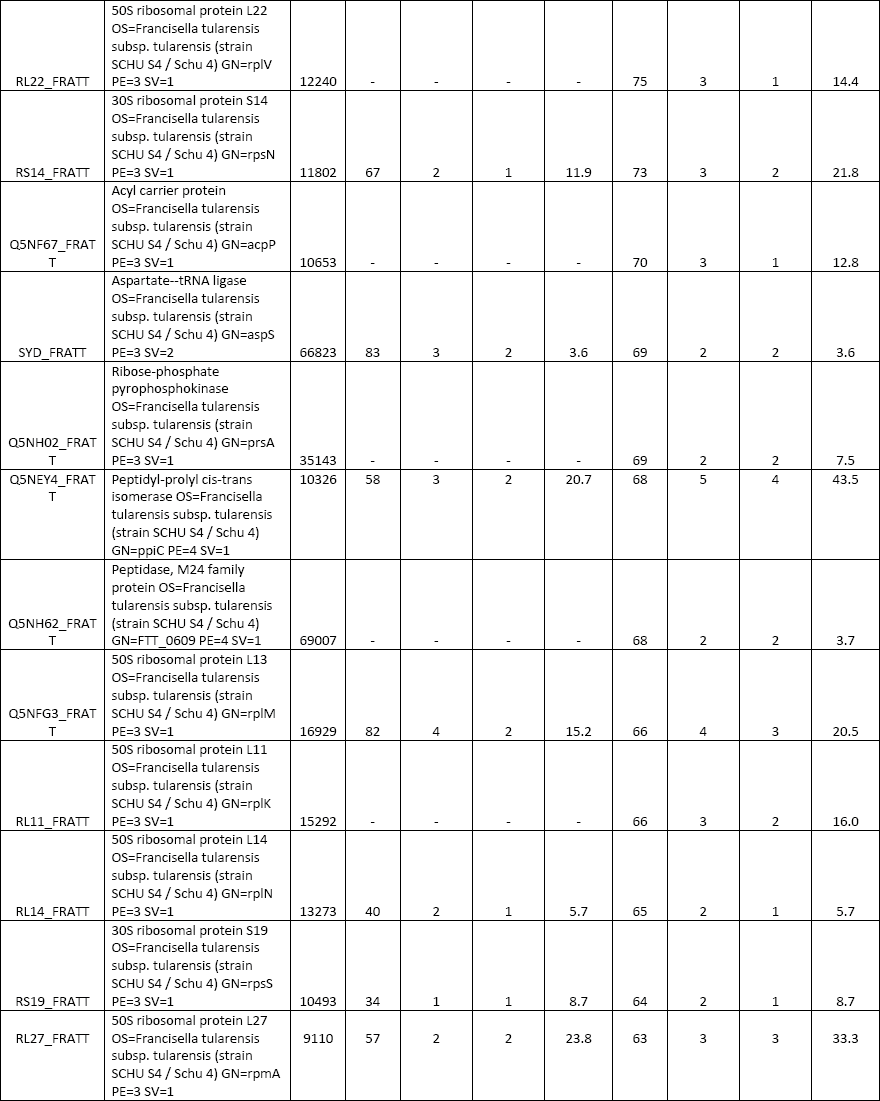
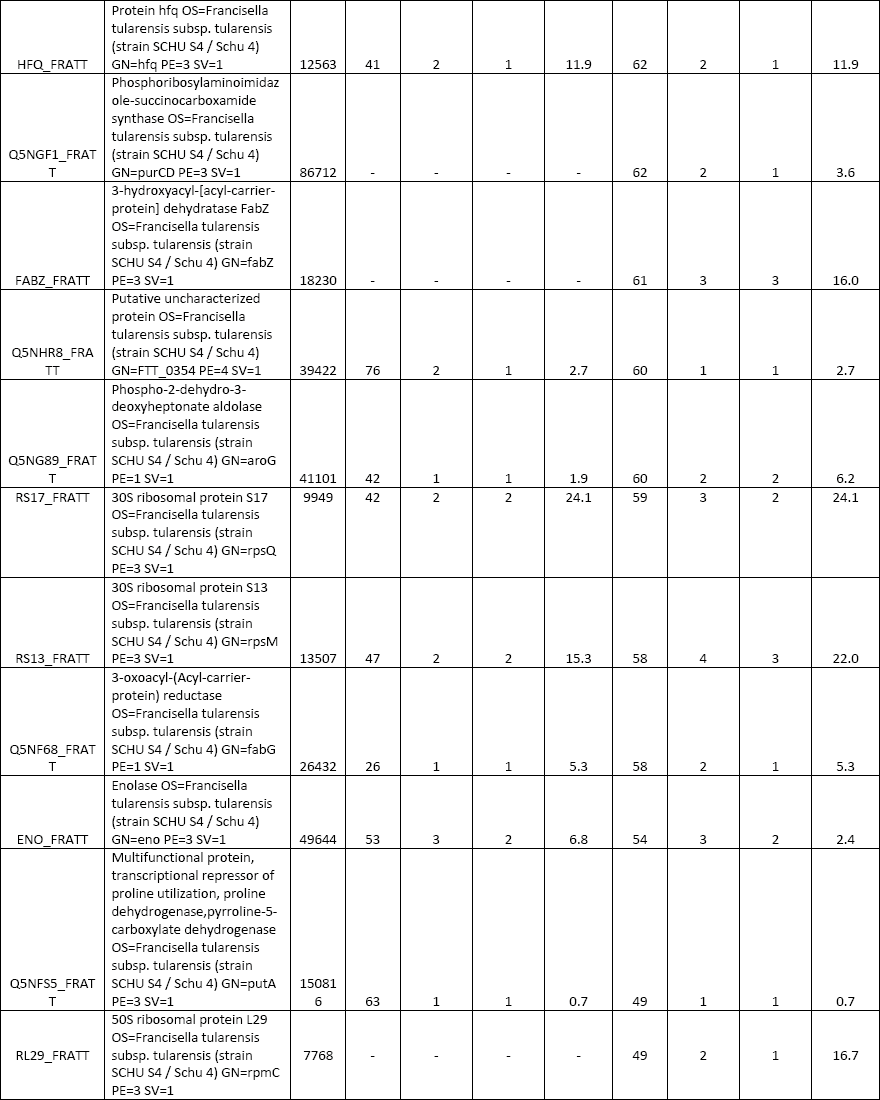
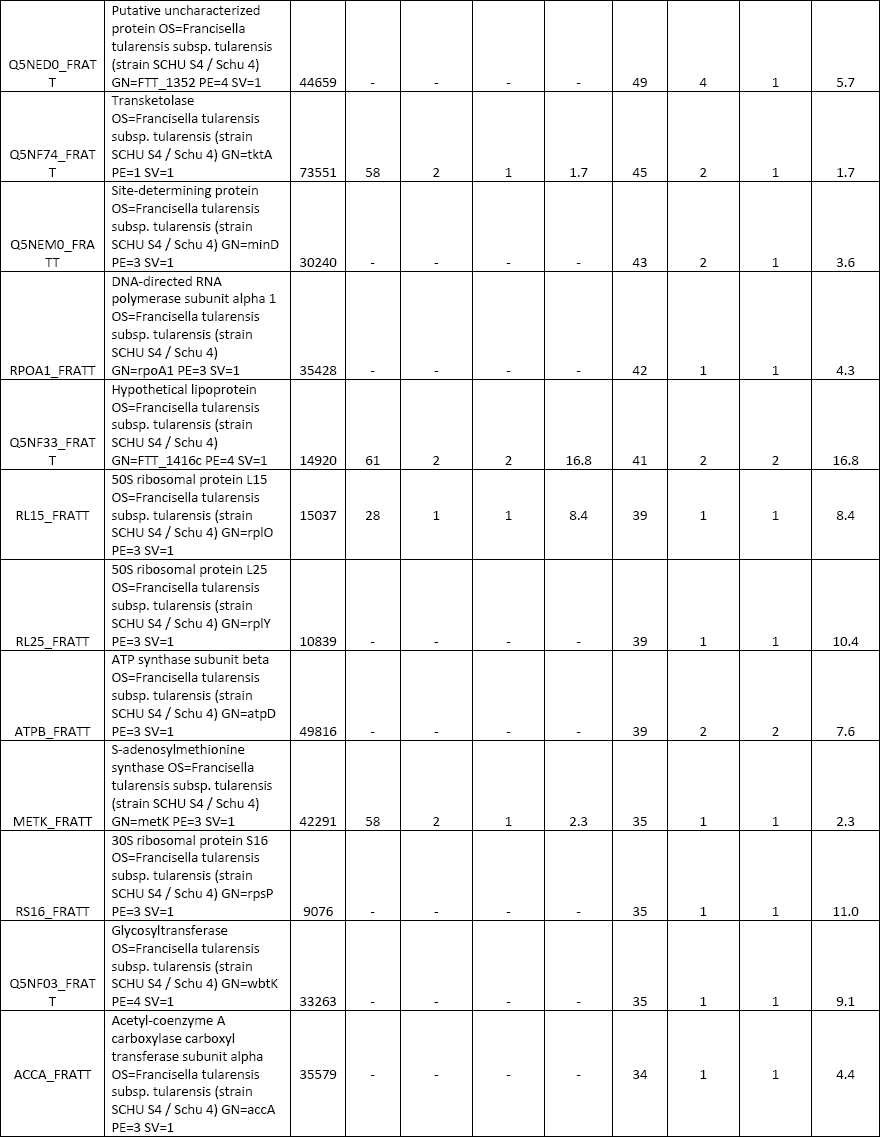
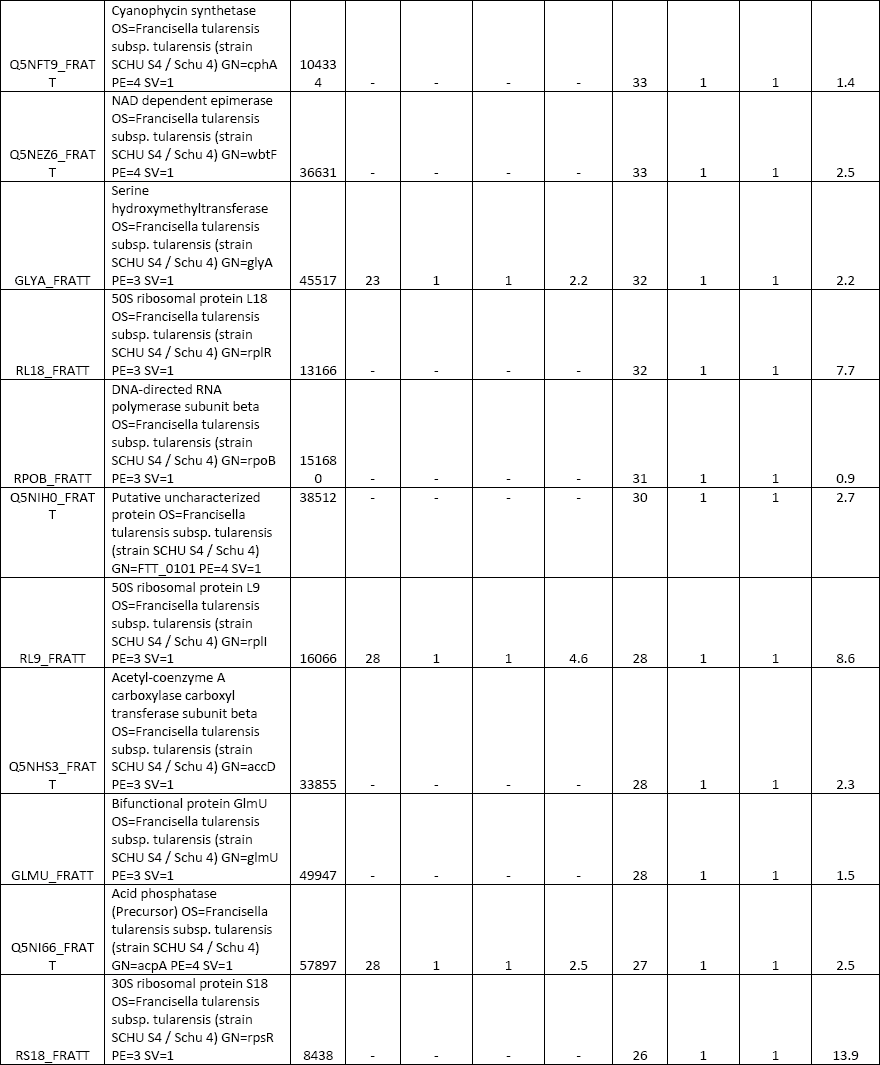
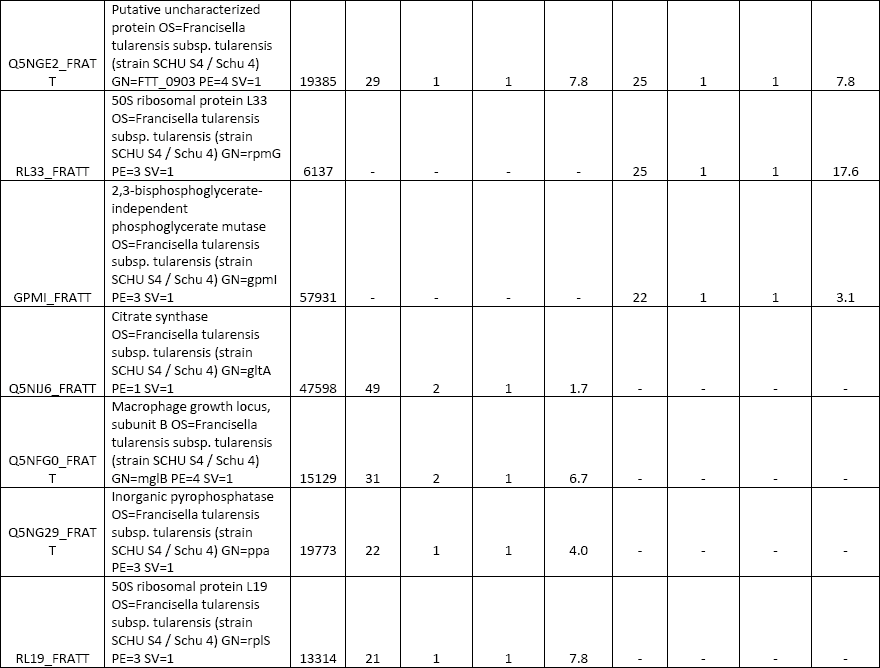
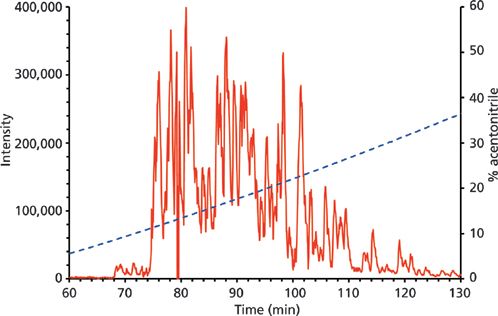
An aliquot (2 μg) of the Francisella protein digest was subjected to separation in the microgradient chromatographic system using both two-step and four-step gradient options (Figure 4). The time periods of separation at the flow rate of 250 nL/min were predetermined by the total volume of the aspirated microgradient-forming solutions: 140 and 196 min, respectively. According to expectations, the four-step gradient proved to be more efficient, which resulted in a higher number of identified proteins when compared to the other elution mode. In total, there were 119 and 93 proteins, respectively, assigned to F. tularensis subsp. tularensis strain Schu S4 entries in the SwissProt protein database under the given search conditions (see supplementary tables). A majority of the identified proteins were found associated with ribosomes and ribosomal components (for example, rRNA), p-values of 9.3E-54 to 2.7E-17, by gene ontology enrichment analysis using the Database for Annotation, Visualization and Integrated Discovery (DAVID) (26). This is not surprising as ribosomal proteins represent the most abundant proteins in bacterial cytosol (27). The number of identifications achieved in this study is not comparable with those available from current state-of-art nanoLC–MS and MS-MS experiments with digested cell lysate protein extracts, which appear at the level of thousands. The reason resides in the maximum pressure limit of about 70 bar produced by the gastight microsyringe when pushing the mobile phase down through the capillary column. This precludes the possible use of longer columns with a narrower diameter and stationary phases made of smaller particles. Both of these column characteristics significantly influence the separation efficiency for very complex peptide mixtures. Nevertheless, quite long analysis times may be required for the instrumental approach (28). Survey 2D gel electrophoresis–based studies, which do not use a sensitive fluorescent labeling, provide "only" hundreds of protein spots. However, much higher sample loads such as 200 μg are necessary in this case (29). To some extent, the use of the microgradient system for protein identification could be competitive to minigel 2D electrophoresis experiments because of the low sample consumption, easy applicability, and time-saving advantage.
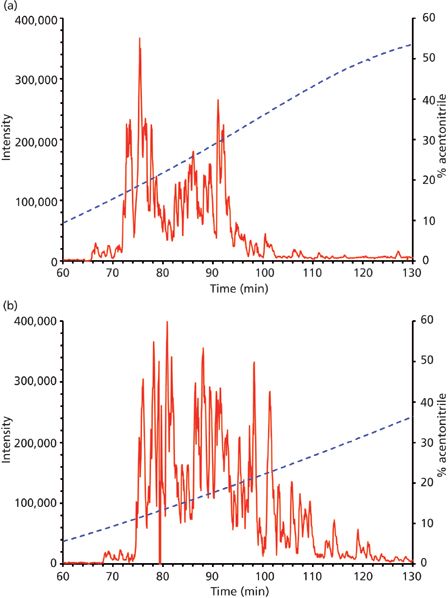
Figure 4: Nanoflow microgradient LC separation of Francisella tularensis subsp. tularensis Schu S4 tryptic digest (2 μg). Column: 100 mm × 100 μm, 5-μm Reprosil-Pur C18-AQ (Dr. Maisch); mobile-phase A: 0.1% formic acid in water; mobile-phase B: 0.1% formic acid in acetonitrile. (a) Two-step gradient elution-the gradient was aspirated as 12 μL of 60% (v/v) B, 21 μL of 2% (v/v) B plus 2 μL of sample; (b) four-step gradient elution-the gradient was aspirated as 12 μL of 60% (v/v) B, 8 μL of 40% (v/v) B, 8 μL of 20% (v/v) B, 19 μL of 2% (v/v) B plus 2 μL of sample. The main panels show base peak chromatograms (m/z range of 460–1200). The gradient profile is illustrated as a dashed line over the chromatograms with percentage of B shown on the secondary y-axis.
Concluding Remarks
This work shows a simple and inexpensive alternative setup for nanoLC separation coupled with ESI-MS and MS-MS analysis of peptide samples in proteomics studies. The applicability of the microgradient chromatographic system was demonstrated with a complex peptide mixture originating from digested whole-cell lysate protein extract of the bacterium Francisella tularensis. When summarizing advantages of the optimized microgradient system, we could point out the following:
- It is simple to construct by connecting a gastight microsyringe, capillary, and capillary column to a nanoESI ion source of an MS instrument and it is much cheaper for purchase compared to commercial separation systems.
- No splitting of the mobile phase flow is required and thus the solvent consumption is very low as a consequence.
- It is small in size and can be placed somewhere in the laboratory.
- The reproducibility of the system is high-four selected peptide precursor ions from a BSA digest showed an RSD of total elution volumes of less than 0.6% in four LC–MS separation runs (in the case of an automated loading of gradient, the retention times are even more reproducible with an RSD of 0.1% [14]).
- If contaminated, the system can be cleaned easily by simply washing the capillary and microsyringe. If necessary, the microsyringe or capillary can be replaced by cheap spare parts after dismantling the system.
Of course, there are also disadvantages. For example, it requires a manual handling for sample injection and column washing; there is no software control; the shape of the gradient is not perfectly linear; there is a pressure limitation given by the syringe use (~70 bar in our case); and shorter columns with a lower back pressure have to be used, which influences the separation efficiency.
Acknowledgments
The financial support of grant No. NT13721-4/2012 of Ministry of Health, Czech Republic, and a long-term organization development plan no. 1011 from the Faculty of Military Health Sciences, University of Defence, Czech Republic, are gratefully acknowledged. This project was also supported by the Ministry of the Interior of the Czech Republic (Project No. VG20112015021) and by the Academy of Sciences of the Czech Republic (Institutional support RVO: 68081715). M.S. was supported by the Education for Competitiveness Operational Programme project CZ.1.07/2.3.00/30.0004 (POSTUP: Encouraging the creation of excellent research teams and intersectoral mobility at Palacký University in Olomouc) from the Ministry of Education, Youth and Sports of the Czech Republic. Professor Lenka Hernychová from Masaryk Memorial Cancer Institute in Brno, Czech Republic, is thanked for providing us with Francisella tularensis subsp. tullarensis strain Schu S4 protein digest.
References
(1) J.R. Yates, C.I. Ruse, and A. Nakorchevsky, Annu. Rev. Biomed. Eng.11, 49–79 (2009).
(2) F. Chevalier, Proteome Sci.8, 23 (2010).
(3) D.R. Mueller, H. Voshol, A. Waldt, B. Wiedmann, and J. Van Oostrum, Subcell. Biochem.43, 355–380 (2007).
(4) G. Chen and B.N. Pramanik, Expert Rev. Proteomics5, 435–444 (2008).
(5) Y. Zhang, B.R. Fonslow, B. Shan, M.-C. Baek, and J.R. Yates III, Chem. Rev.113, 2343–2394 (2013).
(6) B. Thiede, W. Höhenwarter, A. Krah, J. Mattow, M. Schmid, F. Schmidt, and P.R. Jungblut, Methods 35, 237–247 (2005).
(7) P. Schoenmakers, Annu. Rev. Anal. Chem. 2, 333–357 (2009).
(8) Y. Ishihama, J. Chromatogr. A1067, 73–83 (2005).
(9) J.Z. Bereszczak and F.L. Brancia, Comb. Chem. High Throughput Screen. 12, 185–193 (2009).
(10) E. Nägele, M. Vollmer, P. Hörth, and C. Vad, Expert Rev. Proteomics1, 37–46 (2004).
(11) D.R. Stoll, X. Li, X. Wang, P.W. Carr, S.E.G. Porter, and S.C. Rutan, J. Chromatogr A1168, 3–43 (2007).
(12) P.R. Cutillas, Curr. Nanosci. 1, 65-71 (2005).
(13) L. Rieux, E.-J. Sneekes, and R. Swart, LCGC North Am.29, 926–935 (2011).
(14) V. Kahle, M. Vázlerová, and T. Welsch, J. Chromatogr. A990, 3–9 (2003).
(15) D. Moravcová, V. Kahle, H. Åehulková, J. Chmelík, and P. Åehulka, J. Chromatogr. A1216, 3629–3636 (2009).
(16) V. Franc, M. Šebela, P. Åehulka, R. KonÄitíková, R. Lenobel, C. Madzak, and D. KopeÄný, J. Proteomics75, 4027–4037 (2012).
(17) V. Franc, P. Åehulka, A. Padiglia, R. Medda, G. Floris, and M. Šebela, Electrophoresis 34, 2357–2367 (2013).
(18) V. Franc, P. Åehulka, M. Raus, J. Stulík, J. Novak, M.B. Renfrow, and M. Šebela, J. Proteomics92, 299–312 (2013).
(19) L. Balonová, L. Hernychová, B.F. Mann, M. Link, Z. Bílková, M.V. Novotný, and J. Stulík, J. Proteome Res.9, 1995–2005 (2010).
(20) M. Hubálek, L. Hernychová, M. Brychta, J. LenÄo, J. Zechovská, and J. Stulík, Proteomics4, 3048–3060 (2004).
(21) H.K. Hustoft, L. Reubsaet, T. Greibrokk, E. Lundanes, and H. Malerod, J. Pharm. Biomed. Anal.56, 1069–1078 (2011).
(22) A. Tärnvik and L. Berglund, Eur. Respir. J. 21, 361–373 (2003).
(23) J. Ellis, P.C.F. Oyston, M. Green, and R.W. Titball, Clin. Microbiol. Rev.15, 631–646 (2002).
(24) K. Konecna, L. Hernychova, M. Reichelova, J. Lenco, J. Klimentova, J. Stulik, A. Macela, T. Alefantis, and V.G. DelVecchio, Proteomics10, 4501–4511 (2010).
(25) D. Rockx-Brouwer, A. Chong, T.D. Wehrly, R. Child, D.D. Crane, J. Celli, and C.M. Bosio, PLOS One7, e37752 (2012).
(26) D.W. Huang, B.T. Sherman, and R.A. Lempicki, Nature Protoc. 4, 44–57 (2009).
(27) Y. Ishihama, T. Schmidt, J. Rappsilber, M. Mann, F.U. Hartl, M.J. Kerner, and D. Frishman, BMC Genomics9, 102 (2008).
(28) T. Köcher, P. Pichler, R. Swart, and K. Mechtler, Nat. Protoc.7, 882–890 (2012).
(29) S.L. Hanna, N.E. Sherman, M.T. Kinter, and J.B. Goldberg, Microbiology146, 2495–2508 (2000).
René Lenobel, Marek Šebela, and Vojtêch Franc are with the Department of Protein Biochemistry and Proteomics at the Centre of the Region Haná for Biotechnological and Agricultural Research, Faculty of Science at Palacký University in Olomouc, Czech Republic. Helena Åehulková and Pavel Åehulka are with the Department of Molecular Pathology and Biology, Faculty of Military Health Sciences at the University of Defence in Hradec Králové, Czech Republic. Vladislav Kahle and Dana Moravcová are with the Institute of Analytical Chemistry of the ASCR, v. v. i. in Brno, Czech Republic. Direct correspondence to: pavel.rehulka@unob.cz
Common Challenges in Nitrosamine Analysis: An LCGC International Peer Exchange
April 15th 2025A recent roundtable discussion featuring Aloka Srinivasan of Raaha, Mayank Bhanti of the United States Pharmacopeia (USP), and Amber Burch of Purisys discussed the challenges surrounding nitrosamine analysis in pharmaceuticals.
Extracting Estrogenic Hormones Using Rotating Disk and Modified Clays
April 14th 2025University of Caldas and University of Chile researchers extracted estrogenic hormones from wastewater samples using rotating disk sorption extraction. After extraction, the concentrated analytes were measured using liquid chromatography coupled with photodiode array detection (HPLC-PDA).


