Analysis of 12 Regulated Mycotoxins in 8 Food Matrices by Single Immunoaffinity Cleanup and Isotope Dilution LC–MS/MS
A sensitive, selective, and accurate method for analyzing 12 regulated mycotoxins was developed using ultrahigh-pressure liquid chromatography–tandem mass spectrometry (UHPLC–MS/MS). Sample cleanup was performed by specific antibody–antigen interactions using a multianalyte immunoaffinity column containing antibodies for all the regulated mycotoxins. Chromatographic separation was done using a C18 column with simple LC–MS mobile phases. Stable isotope-labeled internal standards for each analyte were added to all samples before extraction to minimize sample matrix effects and reduce variations in analytical procedures. Two MS/MS ion pairs were used for each analyte for compound confirmation and quantification, further enhancing method selectivity and accuracy. The method was validated for eight food matrices (corn, wheat, soybean, almond, oat cereal, peanut butter, red chili, and black pepper) that represent food types most often contaminated by mycotoxins. Recoveries of most mycotoxins from the eight food matrices spiked at two concentration levels: 80–120% with the RSD less than 15%. The method limits of quantitation (LOQs) for all analytes are below the most stringent regulatory limits, making the method suitable for routine mycotoxin analysis.
Mycotoxins are secondary metabolites produced by various fungal species in agricultural products. Because of their occurrence and toxicity, the most important classes of mycotoxins are aflatoxins (AFB1, AFB2, AFG1, AFG2), ochratoxin A (OTA), fumonisins (FB1, FB2 and FB3), deoxynivalenol (DON), HT-2 and T-2 toxins, and zearalenone (ZEN). Aflatoxins have been classified as carcinogenic to humans, and ochratoxin A and fumonisins are classified as possible carcinogens by the International Agency for Research on Cancer (1). Because of the adverse health effects of mycotoxins on humans, mycotoxin levels in foods are regulated by many countries to protect consumers (2–7). For example, maximum levels (MLs) for these mycotoxins in foods have been established by the European Union and the U.S. Food and Drug Administration (FDA) (3–7).
To meet regulatory requirements, various analytical methods have been developed for analysis of mycotoxins in foods (8,9). Recently, liquid chromatography–tandem mass spectrometry (LC–MS/MS) has become the method of choice for quantification and confirmation of mycotoxins in samples because of its high sensitivity, selectivity, and capability of analyzing many analytes in complex sample matrices (8–20). Currently, mycotoxin analysis is being used to develop multianalyte methods that can analyze all the regulated mycotoxins in foods in a single run. However, it has been challenging to develop such a multimycotoxin method because of the diverse physicochemical properties of these compounds, which makes it difficult to effectively extract and purify all analytes by a single method. In addition, the wide range of food matrices makes the extensively used matrix-matched calibration method less efficient because multiple sets of matrix-matched calibrations need to be prepared for different food matrices. As a compromise, simple sample preparation procedures using an acetonitrile:water mixture as the extraction solvent have been widely used in developing multimycotoxin LC–MS/MS methods without sample cleanup (12–18). However, direct injection of crude food extracts into an LC–MS/MS system can cause matrix effects, which can significantly affect the data quality and method selectivity, sensitivity, and accuracy.
Although matrix-matched calibration and stable isotope dilution assay (SIDA) have been used to compensate for matrix effects in the analysis of mycotoxins in food samples, these methods are only calibration methods, and cannot remove sample matrix effects (suppression or enhancement) and matrix-interfering components from samples, and thus, cannot improve method sensitivity or selectivity. To increase the sensitivity of a method and meet the stringent regulatory requirements for determining low levels of mycotoxins, such as AFB1 (0.1 μg/kg) and OTA (0.5 μg/kg) in baby food samples, sample cleanup, and analyte concentration techniques are required, such as solid- phase extraction (19) and immunoaffinity sample cleanup methods (20,21). However, in the past, most of these sample cleanup methods were for single analyte or single-class mycotoxin analyses. Nowadays, several immunoaffinity columns (IAC) containing multimycotoxin antibodies are available commercially, making it possible to selectively purify multiple mycotoxins from complex food matrices.
In this study, 12 regulated mycotoxins from six major toxin classes were selected using IAC for sample cleanup. A reliable, sensitive, and selective method was developed for simultaneous determination of these mycotoxins in various food matrices. Stable isotope dilution assay was performed before sample extraction, which minimized variations during sample preparation and instrument analysis and further compensated for matrix effects. Two MS/MS ion pairs were used for each analyte for compound confirmation and quantification. The results demonstrated that cleaner sample matrices and higher sensitivity of the method could be achieved by coupling IAC sample clean-up with LC–MS/MS. This method was validated using eight different food matrices spiked at two analyte concentration levels and could be applied for multimycotoxin analyses to meet the most stringent regulatory limits.
Experimental
Chemicals and Materials
Mycotoxin standard stock solutions and their 13C uniformly labeled internal standard (13C-IS) stock solutions were obtained from Romer Laboratories. The aflatoxin mix solution consisted of aflatoxins B1, B2, G1 and G2 (1.0 μg/mL each in acetonitrile); the fusarium toxins mixture consisted of deoxynivalenol (100 μg/mL), HT-2 toxin (100 μg/mL), T-2 toxin (10 μg/mL), and zearalenone (30 μg/mL) in acetonitrile; the fumonisin mixture consisted of fumonisin B1 (50 μg/mL), fumonisin B2 (50 μg/mL), and fumonisin B3 (50 μg/mL) in acetonitrile:water (50:50, v/v); ochratoxin A (10 μg/mL) in acetonitrile; 13C-aflatoxin mixture consisted of U-[13C17]-aflatoxin B1, B2, G1, and G2 (0.5 μg/mL each in acetonitrile); U-[13C20]-ochratoxin A (10 μg/mL); U-[13C34]-fumonisin B1 (25 μg/mL); U-[13C34]-fumonisin B2 (10 μg/mL); U-[13C34]-fumonisin B3 (10 μg/mL); U-[13C15]-deoxynivalenol (25 μg/mL); U-[13C22]-HT-2 toxin (25 μg/mL); U-[13C24]-T-2 toxin (25 μg/mL); and U-[13C18]-zearalenone (25 μg/mL). LC grade solvents (methanol, acetonitrile, water) and other chemicals, such as formic acid, ammonium formate, and phosphate buffered saline (PBS, pH 7.4) were obtained from Sigma-Aldrich. IACs (MaxSignal IAC 6-in-1 Combo), disposable polypropylene syringe (10 mL, 20 mL), syringe filter (0.45 and 0.22 μm), polypropylene centrifuge tube (50 mL), and amber autosampler vials and caps were obtained from PerkinElmer. Test samples (yellow corn, white corn, wheat, soybean, almond, oat breakfast cereal, peanut butter, chili powder, black pepper powder) were purchased from local stores in Toronto.
Standard Preparation
To prepare calibration standards and quality control samples, three working standard (WS) mixture solutions (WS- Mix1, WS-Mix2, and WS-Mix3) and an internal standard spiking solution (IS-Spike) were prepared from the corre- sponding stock solutions by appropriate dilutions with a diluent of acetonitrile:water (50:50, v/v). WS-Mix1 contained aflatoxins B1, B2, G1, G2 (each 100 ng/mL) and ochratoxin A (200 ng/mL). WS-Mix2 consisted of the three fumonisins (FB1, FB2 and FB3, each 2000 ng/mL). WS-Mix3 included deoxynivalenol (2000 ng/mL), HT-2 toxin (2000 ng/mL), T-2 toxin (200 ng/mL), and zearalenone (600 ng/mL). IS-Spike consisted of 13C17 aflatoxins B1, B2, G1, G2 (each 50 ng/ mL); 13C20-ochratoxin A (200 ng/mL); 13C34-fumonisin B1 (2000 ng/mL); 13C34-fumonisin B2 (1000 ng/mL); 13C34-fumonisin B3 (1000 ng/mL); 13C15-deoxynivalenol (2000 ng/mL); 13C22-HT-2 toxin (2000 ng/mL); 13C24-T-2 toxin (1000 ng/mL); and 13C18-zearalenone (1000 ng/mL). Seven levels of calibration standard solutions (each 1 mL) were prepared by a series of dilutions of the appropriate amount of WS-mixes 1, 2, and 3 using the same acetonitrile:water diluent, respectively; and then IS-spike solution (10 μL) was fortified into each calibration standard. The analyte concentrations (ng/mL) in the standards are as follows: 0.05, 0.1, 0.5, 1, 5, 10, 25 for aflatoxins (B1, B2, G1, G2); 0.1, 0.2, 1, 2, 10, 20, and 50 for T-2 toxin and ochratoxin A, respectively; 1, 2, 10, 20, 100, 200, 500 for HT-2 toxin, DON and fumonisins (FB1, FB2, FB3), respectively; and 0.3, 0.6, 3, 6, 30, 60, and 150 for zearalenone. Each standard solution contains IS (ng/mL) at 0.5 for each C13-aflatoxin (B1, B2, G1, G2); 2 for C13-ochratoxin; 10 for C13-T-2, and 20 for C13-zearalenone, C13-fumonisins (FB1, FB2, FB3) and C13-DON, respectively.
Sample Preparation
All food samples were prepared by the method described in IAC (6-in-1 combo) user manual (22) with minor modifications. Briefly, 5 g of the ground and homogenized sample were weighed and put into a 50 mL centrifuge tube. Next, 100 μL of IS-spike were added and vortexed for 2 min. Third, 20 mL of extraction solution 1 containing acetonitrile:water:acetic acid (80:19:1 in v/v) was added and shaken on a shaker for 20 min. Then, the solution was put in a centrifuge at 4000 rpm for 5 min before being transferred to a collection bottle. At this point, 20 mL of extraction solution 2 (80% of methanol in water) were added to the centrifuged residue and shaken on a shaker for 20 min. The solution was then put in a centrifuge at 4000 rpm for 5 min and transferred the supernatant to the same collection bottle before the solution was mixed well. Then, 5 mL of the combined supernatant was diluted with 35 mL of PBS solution and mixed well. Afterward, 32 mL of the diluted sample were loaded onto an IAC for sample cleanup. When the sample solution was slowly passed through the IAC by gravity, the mycotoxins were bound to the corresponding antibodies in the column. The IAC was then washed with washing solution (0.1% v/v Tween-20 in water) and water to remove any unrelated substances (including matrix interfering components) that were not bound to the column. Finally, the mycotoxins were eluted from the column by methanol containing 2% acetic acid. The eluate was evaporated to dryness and reconstituted with 1 mL of the acetonitrile:water (50:50) diluent and then filtered through a 0.22 μm syringe filter directly into an amber autosampler vial for LC–MS/MS analysis.
For method validation, a laboratory reagent blank (LRB) was prepared and tested first to ensure that there was no interference or contamination from reagents or materials used or from the sample preparation processes. Then, all food blank samples were examined for any mycotoxin peaks and any interfering components. Finally, to evaluate sample matrix effects and analyte recovery from sample matrix, laboratory fortified matrix samples (LFM) were prepared by following the same sample preparation procedures as described above, using each of the eight blank samples (corn, wheat, soybean, almond, oat cereal, red chili, black pepper, and peanut butter) as a sample matrix, respectively, and spiked with analyte at two concentration levels. At each spiking level, LFM samples were prepared in triplicate. Because some mycotoxins were detected in blank samples used for recovery studies, the recovered mycotoxin results were corrected by subtracting those values from the blank samples.
Analytical Conditions
Analyte separation was performed using a UHPLC system (PerkinElmer LX-50) with a Quasar SPP C18 column (100 x 2.1 mm, 2.6 μm) and a simple mobile phase composition of water and methanol (both contain 0.1% formic acid and 5 mM ammonium formate) with a flow rate of 0.3 mL/min. A 5 μL of sample was injected and the total LC running time is 11 min. Analyte detection was achieved using a triple quadrupole mass detector (PerkinElmer QSight 220) in positive ESI mode. Multiple multiple reaction mode (MRM) transition ion pairs were monitored for each compound and the IS to evaluate potential interfering components for any transitions in the sample matrices. The ion source conditions are: ESI voltage, 4500 V; drying gas, 120; nebulizer gas, 300; source temperature, 350 oC, and HSID temperature, 220 oC.
Results and Discussion
LC–MS/MS Method Optimization
To optimize mass detection conditions, both positive and negative electrospray ionization (ESI) modes were evaluated initially for all analytes. The results showed that higher signal intensity and better signal-to-noise (S/N) ratio were observed for all mycotoxins under positive mode except for ZEN, which showed slightly higher signal intensity in negative mode. Although DON and OTA were determined in negative mode in a previous work (23), the best results were obtained using positive ionization in this study. Thus, to simplify the method, we used positive ESI mode for all analytes. For most mycotoxins, the highest abundant precursor ions were protonated [M+H]+ species. But for HT-2 and T-2 toxins, their ammonium adducts [M+NH4]+ showed higher abundance than their [M+H]+ ions, and therefore, their ammonium adducts [M+NH4]+ were used as precursors in the method. Multiple MS/MS transitions for each analyte and each 13C-IS were evaluated and finally two MS/MS transitions for each analyte were employed to improve analyte confirmation and method accuracy. The analyte retention time and optimized MS/MS parameters were listed in Table I.
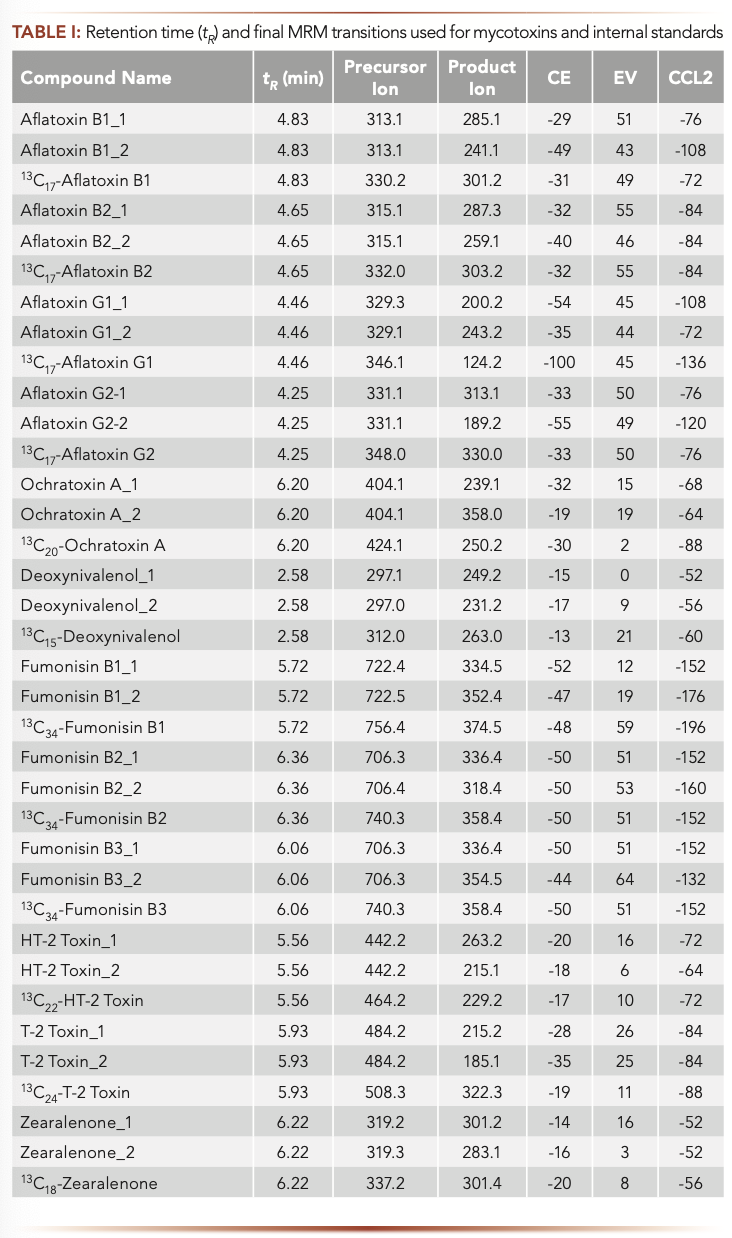
Because of the diverse physicochemical properties of the 12 studied analytes, a compromise was made between mobile phase composition (keeping good analyte retention) and MS response for the target mycotoxins. It was shown that signal intensities were increased for aflatoxins and DON when a small amount of ammonium formate was added to the mobile phase. In addition, small amounts of ammonium ions in the mobile phases could help inhibit the formation of sodium adducts, especially in the case of HT-2 and T-2 toxin, and favored the formation of [M+NH4]+. However, higher content of ammonium formate could lead to ion suppression. Thus, the optimized concentration of ammonium formate was 5 mM in both mobile phases. It was found that the addition of 0.1% formic acid in the mobile phases not only enhanced the signals of fumonisins (FB1, FB2 and FB3), but also improved their peak shapes. The peak areas of aflatoxins were also increased. However, the signal intensities for OTA, DON, HT-2, and T-2 toxins were decreased slightly with the addition of acid in mobile phases. Thus, as a compromise for the determination of all mycotoxins, 0.1% of formic acid was added to the mobile phases. Because FB2 and FB3 have the same MS/MS transitions, baseline separation of the two peaks is required to avoid interference from each other. In this study, these two peaks of FB3 (at 6.06 min) and FB2 (at 6.36 min) were well separated.
Sample Matrix Effects and Method Selectivity
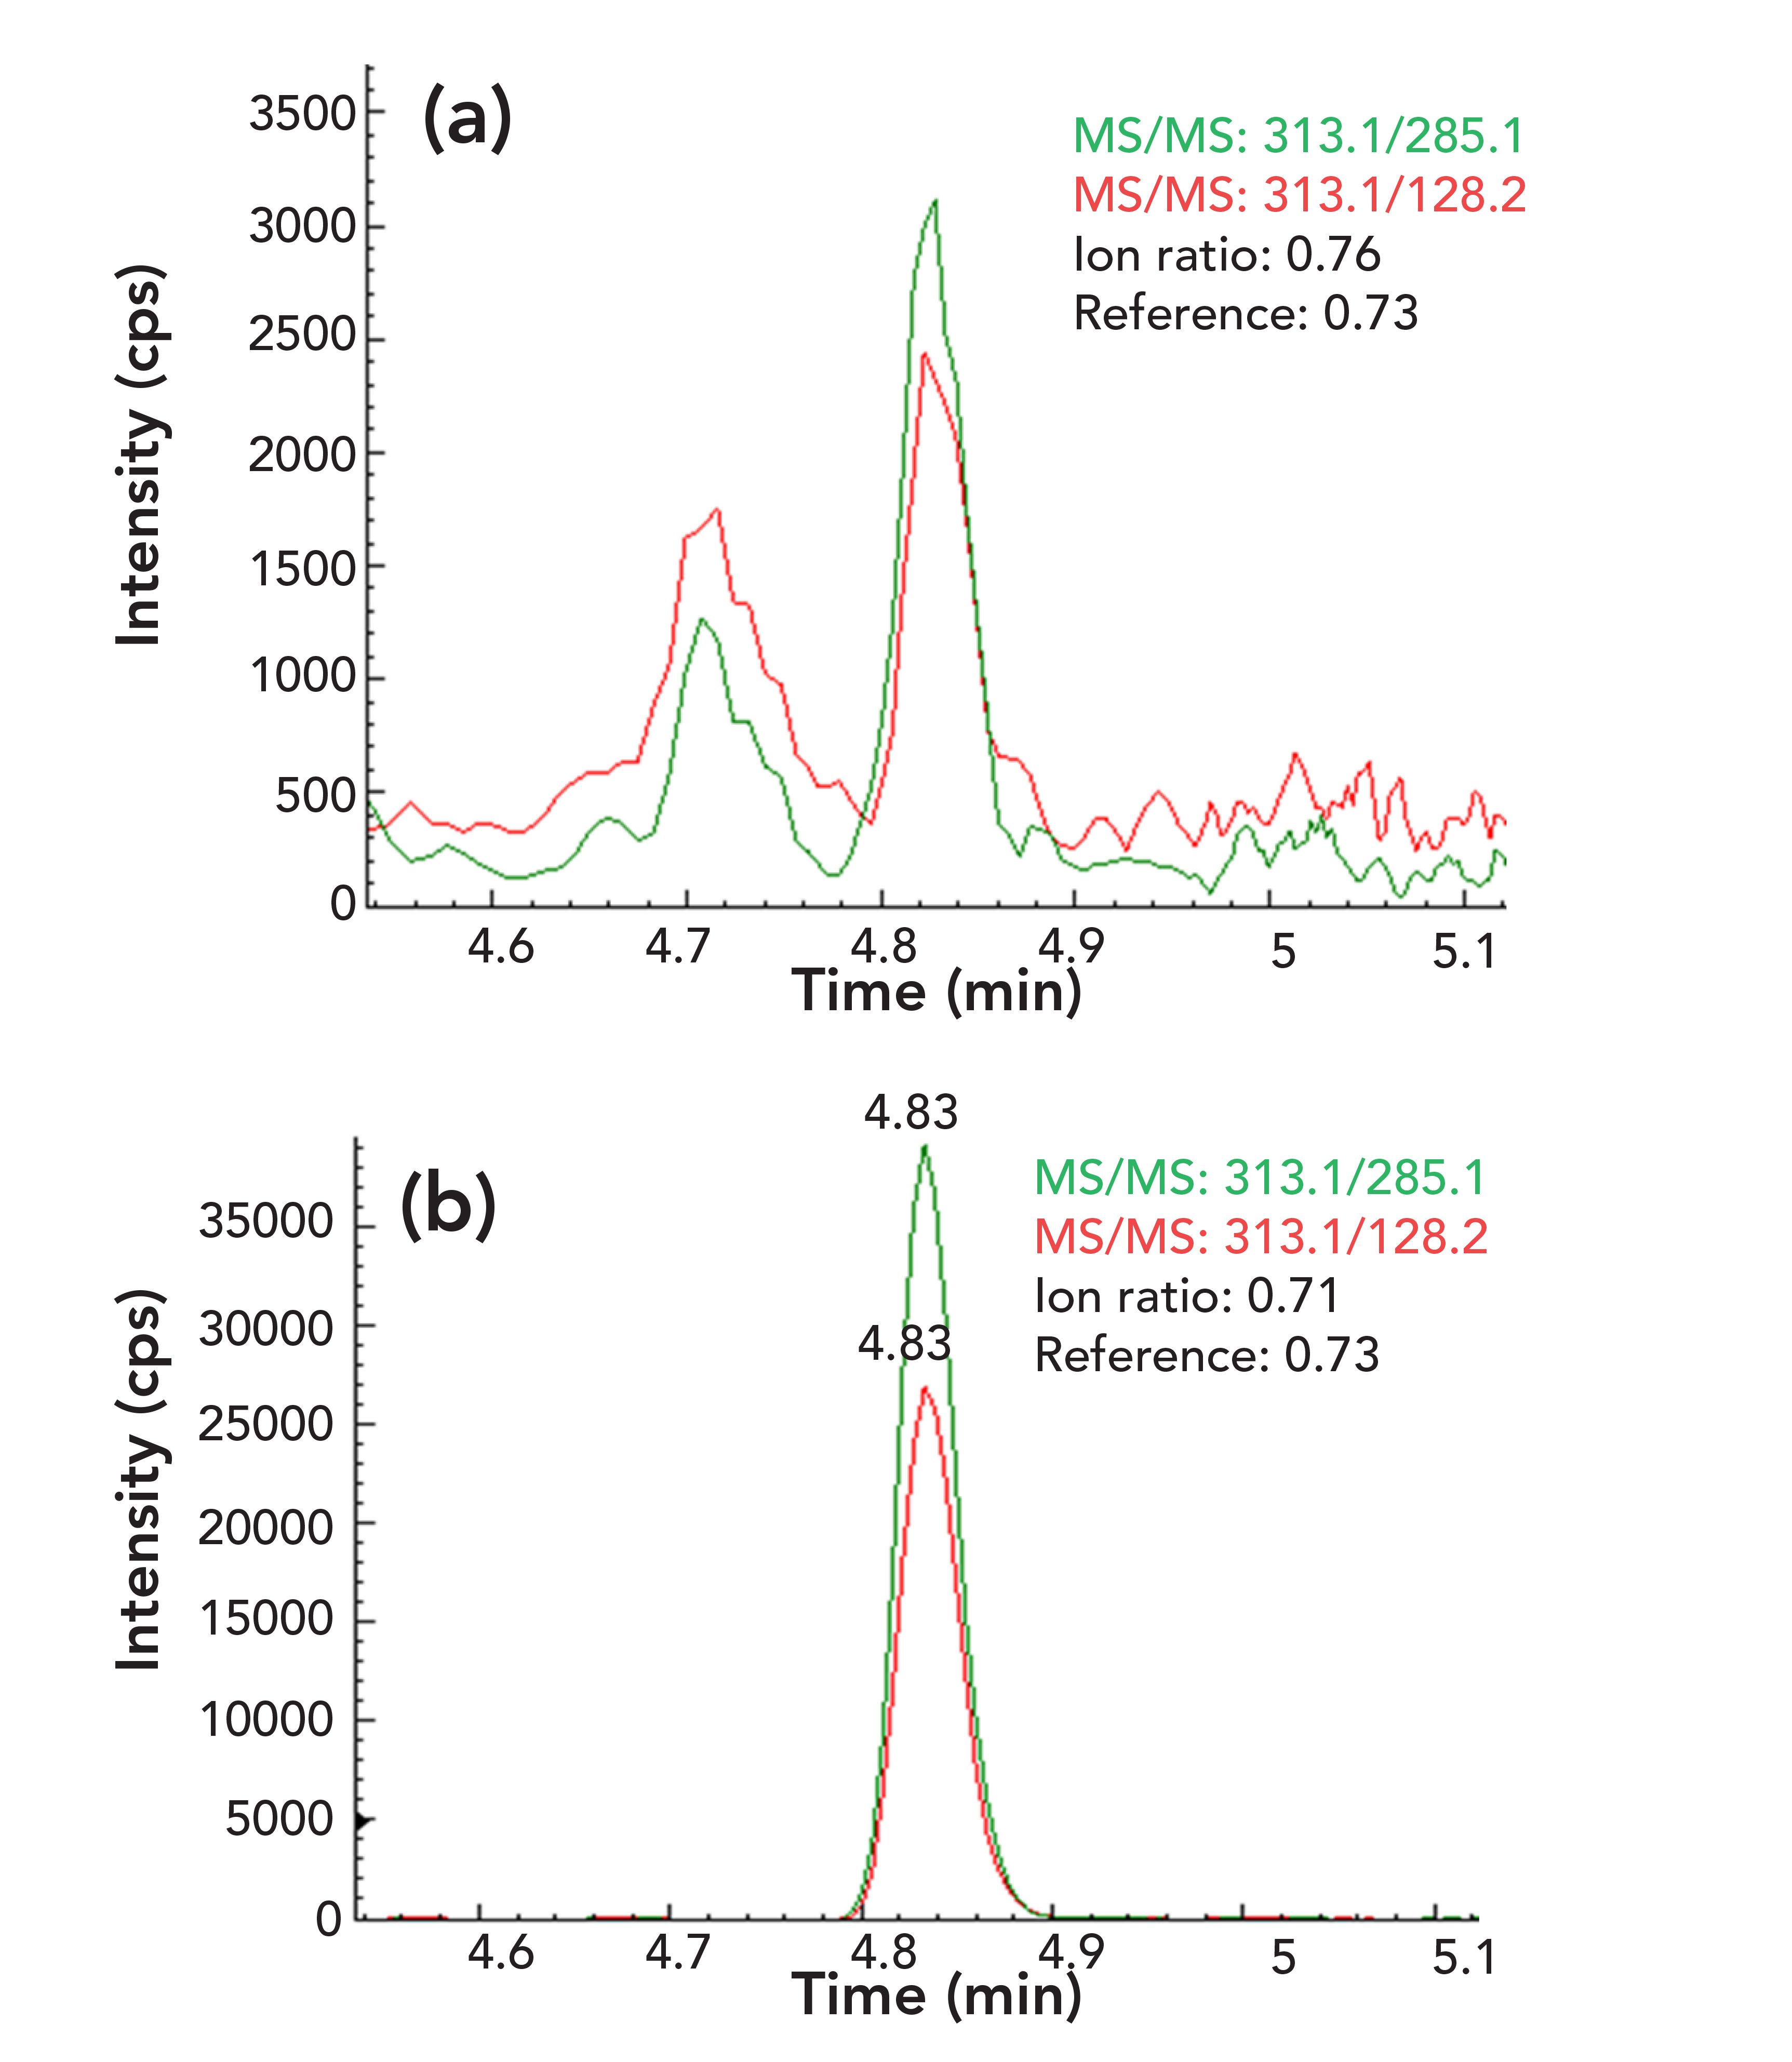
Sample matrix effects (MEs) have received great attention in LC–MS/MS method development and validation because they can affect data quality and method selectivity, sensitivity, and accuracy, especially for complex sample matrices, such as various food commodities (24). Although various approaches have been used to compensate for MEs, such as isotope dilution and matrix-matched calibration, these methods cannot remove matrix-interfering components from samples and thus cannot improve method sensitivity and selectivity. It has been demonstrated that sample cleanup techniques are the most effective tools for ME reduction and analyte concentration, which can lead to better selectivity and sensitivity of a method. In this study, sample cleanup was performed based on specific antibody–antigen interactions using a multianalyte IAC containing antibodies for all the regulated mycotoxins. As shown in Figure 1 for a peanut butter sample, the IAC sample cleanup technique significantly reduced matrix components from the sample matrix (Figure 1b) compared to the results obtained by a method (18) without using IAC sample treatment (Figure 1a). In addition, as shown clearly in Figure 1, the sensitivity of the method, in terms of signal intensity and S/N ratio, was improved dramatically because of less matrix suppressions on analyte signal and the analyte concentrations during IAC sample preparation procedures. Similar results were also obtained for other mycotoxins in this sample and in all the food matrices studied, especially for the early eluted analytes such as aflatoxins (AFB1, AFB2, AFG1 and AFG2, data not shown, but available upon request).
FIGURE 1: Two overlapped MRM chromatograms of AFB1 in a peanut butter sample: (a) sample prepared by reference method (18) without IAC clean-up; (b) sample prepared by IAC clean-up.
In this study, MEs were reduced significantly by IAC sample cleanup. However, there were still some MEs that were evaluated by comparing the responses of the same amount of IS spiked in solvent (solvent-only calibration standards) and in different food sample matrices. The results showed that MEs were both analyte-dependent and sample matrix-dependent. To further compensate for these MEs, stable isotope dilution assay (SIDA) with 13C-labeled IS for each analyte was applied to all sample matrices before sample extraction. Meanwhile, this SIDA also minimized any variations in analytical procedures (including variations in sample preparation and instrument analysis) and thus improved method reproducibility, accuracy, and robustness.
The method selectivity and analyte confirmation from food samples were evaluated by comparing the analyte retention time and mass spectrum information (such as the peak area ratios of qualifier to quantifier ions of each analyte) between reference standard and samples. In this study, multiple MS/MS ion pairs were studied initially for each mycotoxin and two structurally specific MS/MS ion pairs were used for each analyte in the final LC–MS/MS method to meet the regulatory requirements for confident identification and accurate quantification of analytes in the studied samples (25–27). For example, ideally, the blank samples used for a recovery study should not contain any analyte. However, the blank samples obtained do contain some analytes at low concentrations because mycotoxins are prevalent in many grain products even when they are still in the field (28). Therefore, to achieve accurate results and obtain correct analyte recoveries, it is important to unambiguously identify the peaks of interest in blank sample matrices.
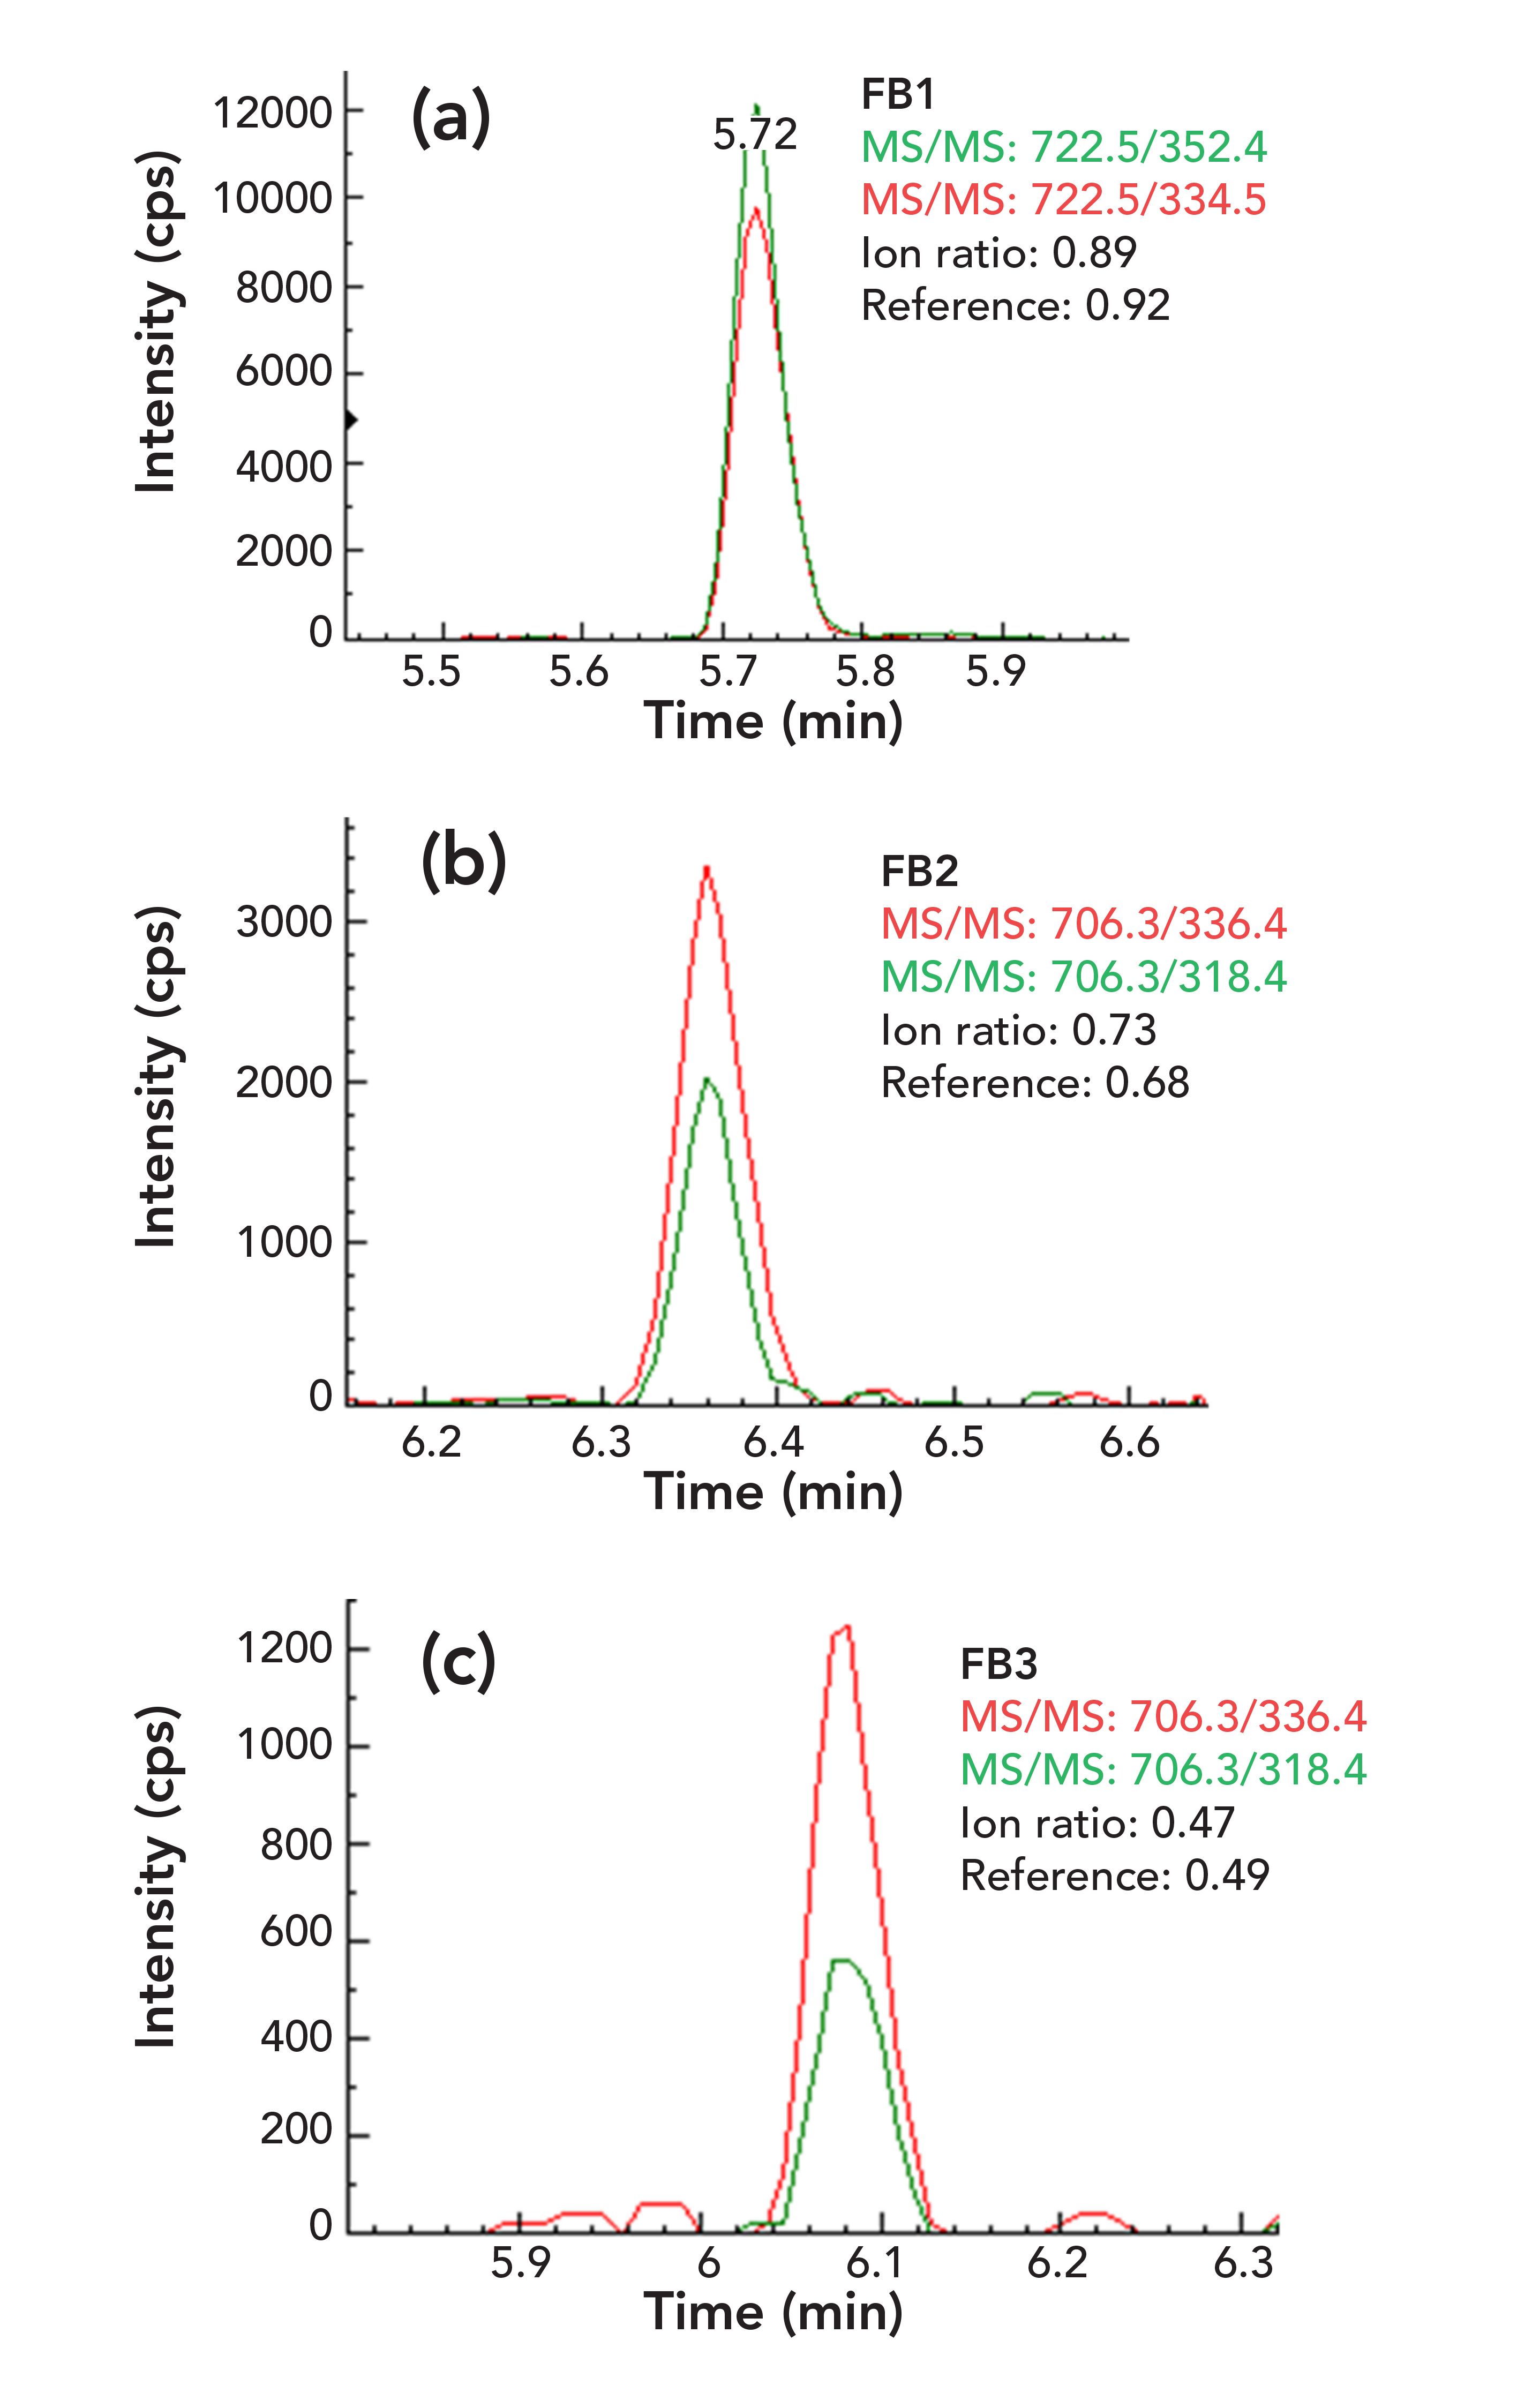
Eight food blank samples were evaluated during method validation. As shown in Figure 2 for a chili powder sample, OTA (3.92 μg/kg) was determined and confirmed by comparing its retention time and ion ratios of qualifier ions to quantifier ion with those in a reference standard. The retention time of OTA in the sample matches with that in the standard perfectly and the deviations for ion ratios are less than 10%. Again, as shown in Figure 3 for a yellow corn sample, the analytes of FB1 (88.6 μg/kg), FB2 (16.7 μg/kg), and FB3 (11.1 μg/kg) were confirmed by their retention times and ion ratios of qualifier–quantifier ions, which are consistent with those of reference standard. Similar results were also obtained for AFB1 (6.26 μg/kg) in a peanut butter sample (Figure 1), ZEN (125 μg/kg) in a black pepper sample, HT-2 toxin (15.9 μg/kg), and T-2 toxin (7.1 μg/kg) in an oat cereal sample (figures not shown, but available upon request), demonstrating good selectivity of the method for mycotoxin analysis.
FIGURE 2: Two overlapped MS/MS chromatograms: the ion ratio of qualifier-quantifier ions of (a) OTA in a reference standard, and (b) in a chili powder sample blank.
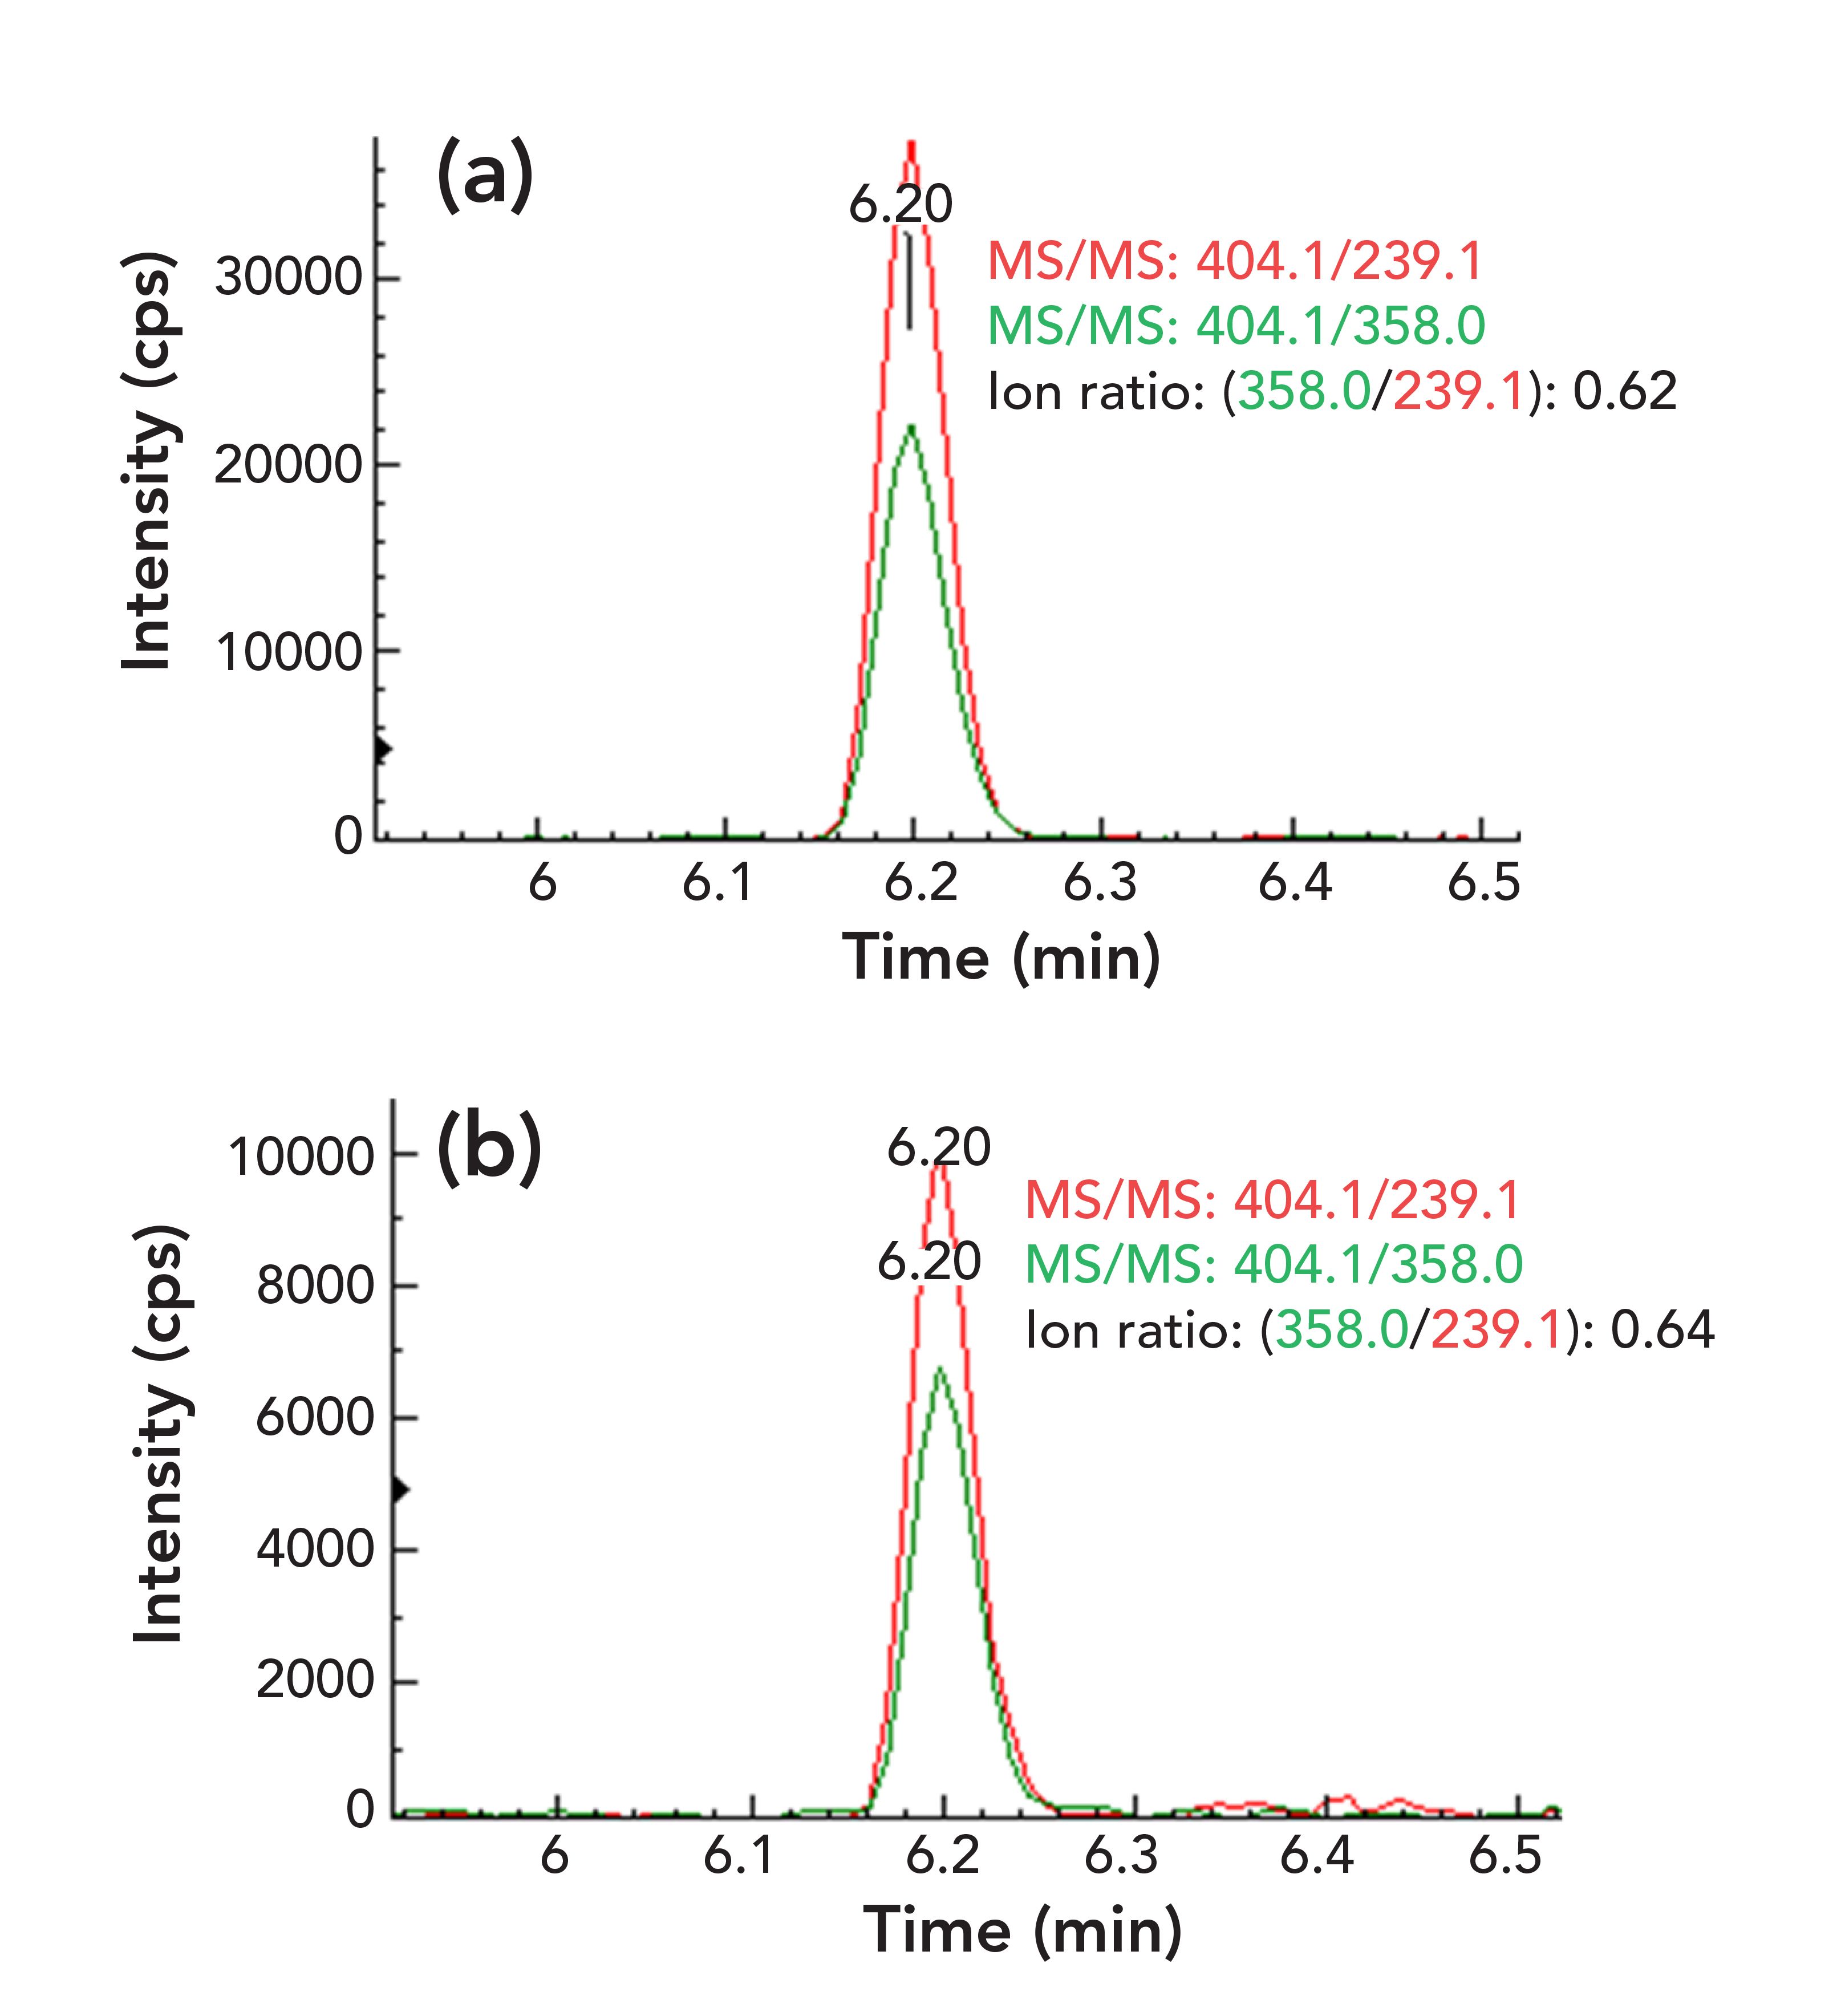
FIGURE 3: Two overlapped MS/MS chromatograms: the ion ratio of qualifier–quantifier ions of (a) FB1, (b) FB2, and (c) FB3 in a yellow corn sample blank.
Method Validation
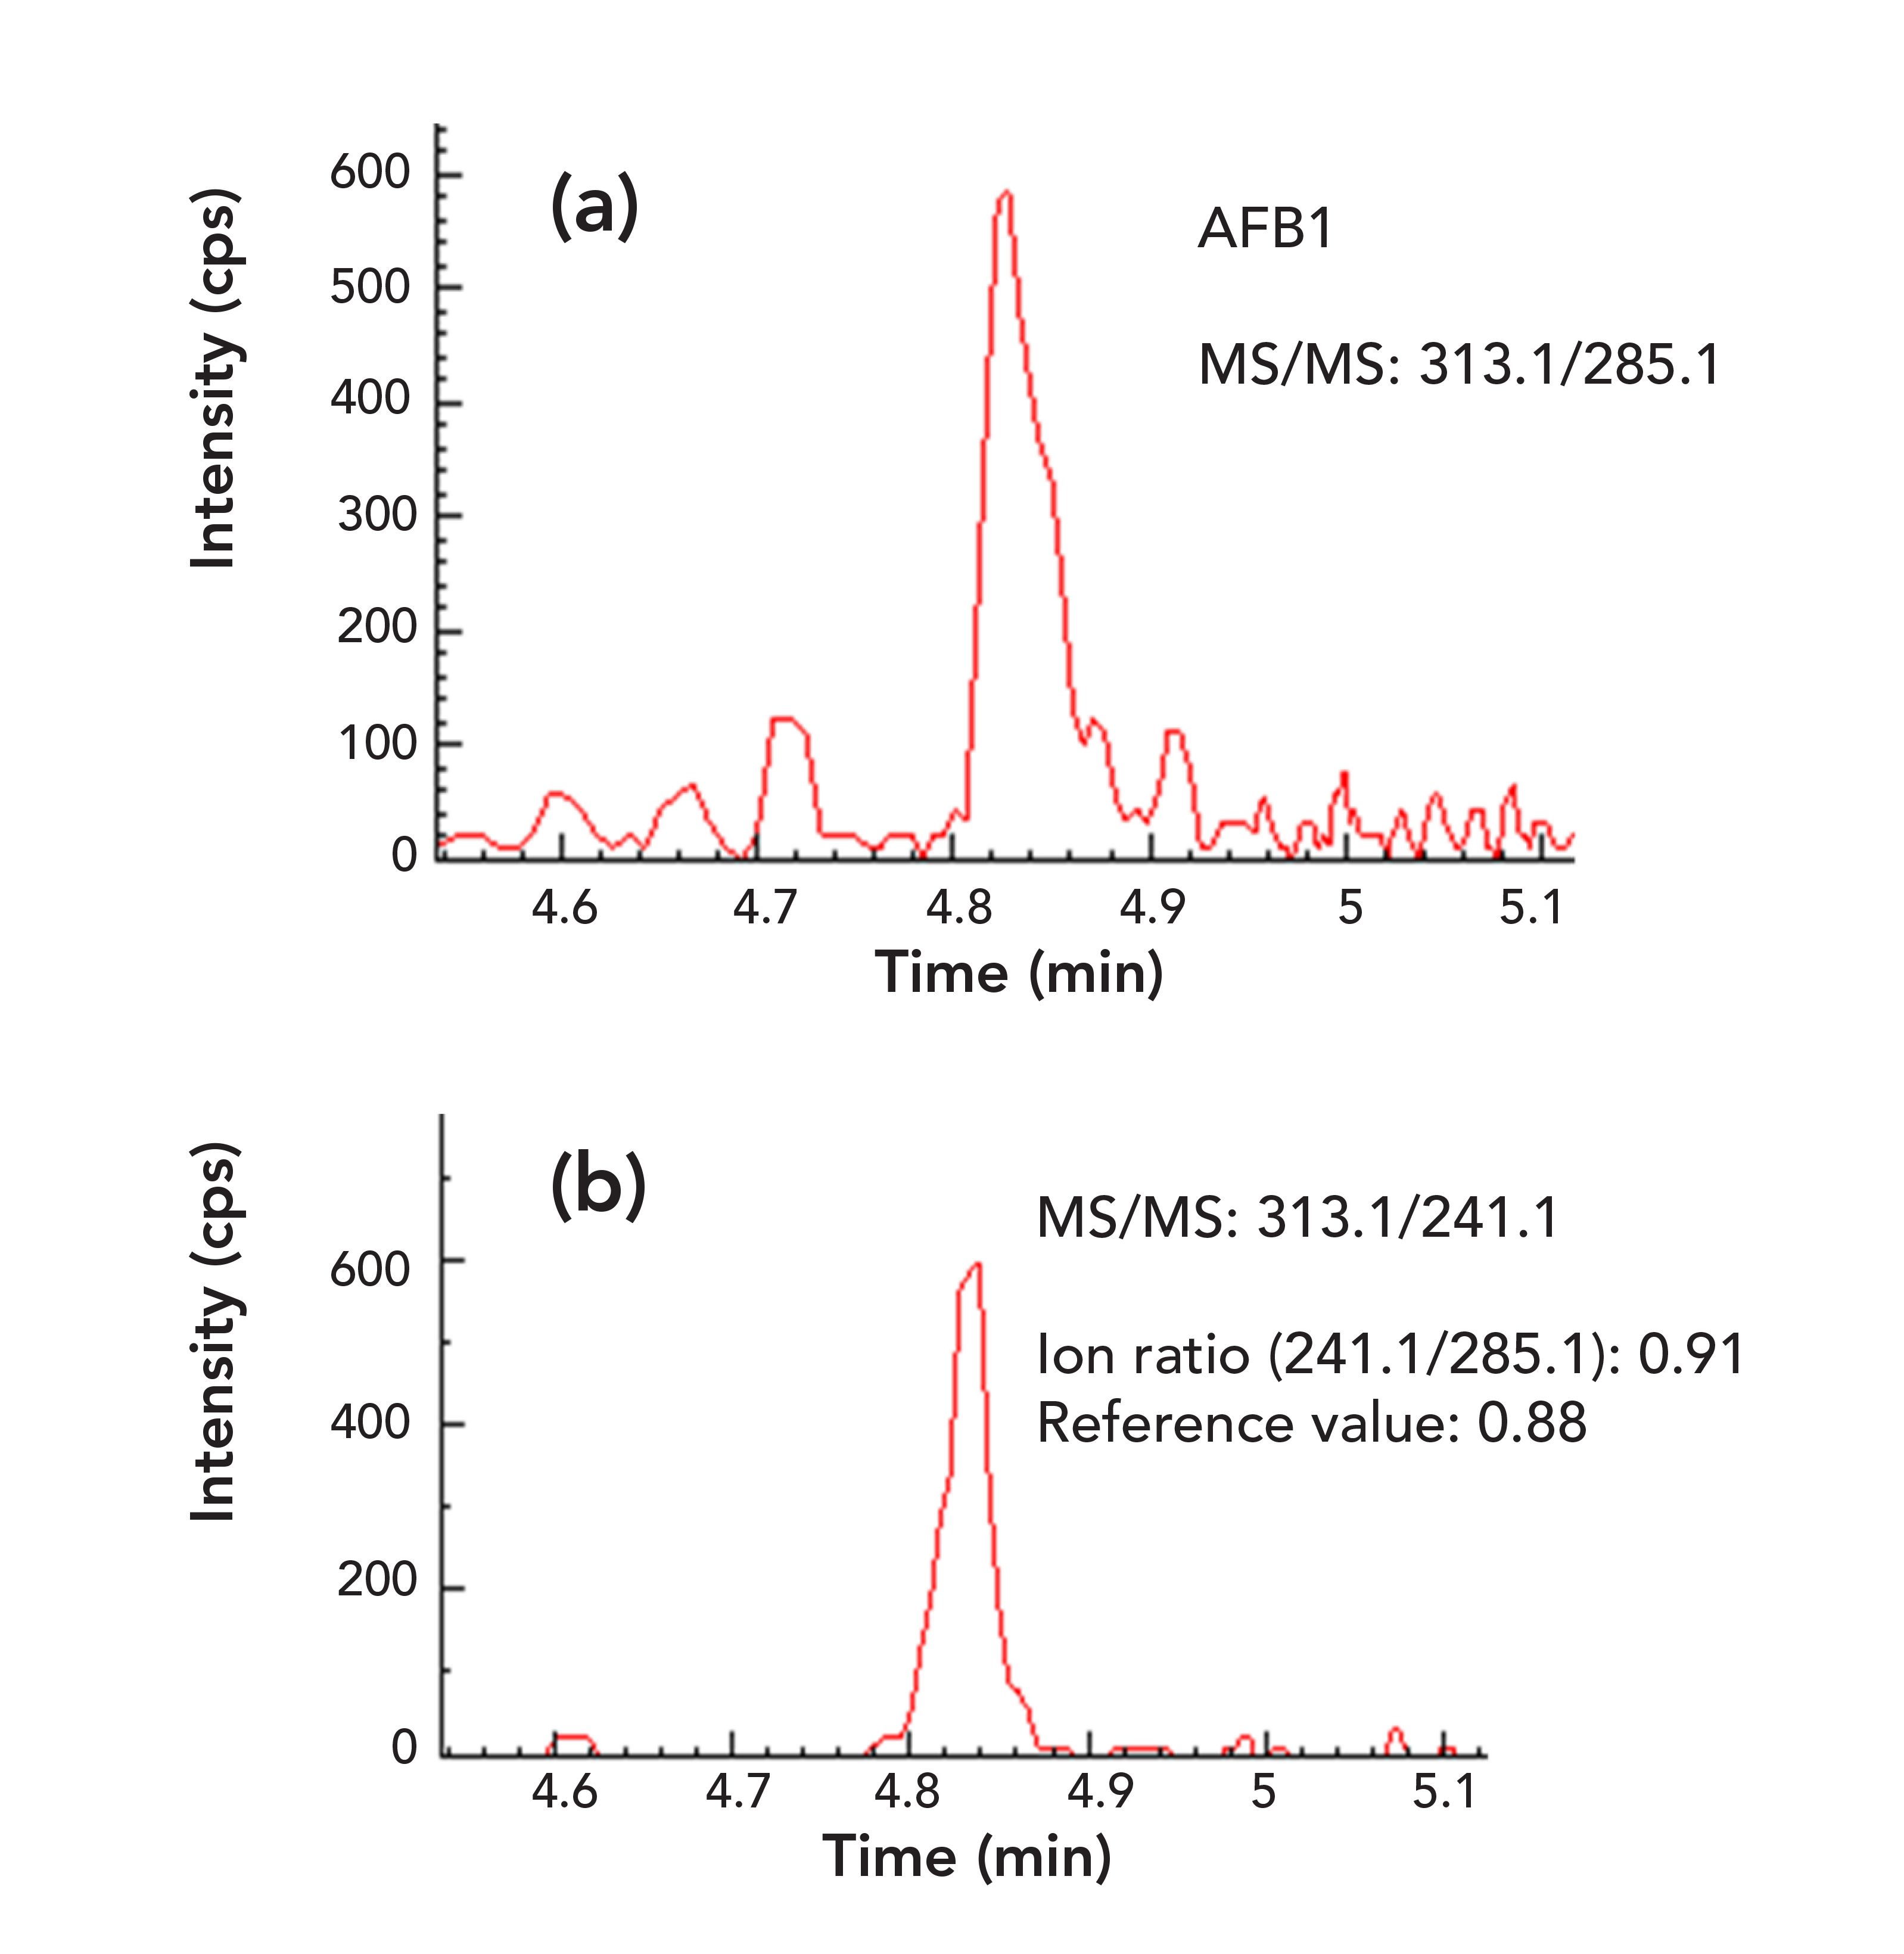
All calibration curves showed good linearity with correlation coefficients (R2) greater than 0.99. The method limit of detection (LOD) and limit of quantification (LOQ) were determined based on signal to noise ratio (S/N = 3 for LOD and S/N = 10 for LOQ) of the quantifier ion peaks in sample matrices. Because MEs on each analyte are slightly different in different sample matrices, the LOD and LOQ values are slightly different for difference matrices (thus, a range of values were reported for some analytes in this study as shown in Table II). Overall, the LOQ values of the method for all analytes are below the regulated maximum limits (MLs) for the studied food matrices, demonstrating superior sensitivity of the method for the 12 mycotoxins in all food matrices including baby foods for low level of AFB1 (0.1 μg/kg) and OTA (0.5 μg/kg). Figure 4 demonstrates an example of highly sensitive determination of AFB1 (0.056 μg/kg) in a complex chili powder sample matrix using this IAC-LC–MS/ MS method.
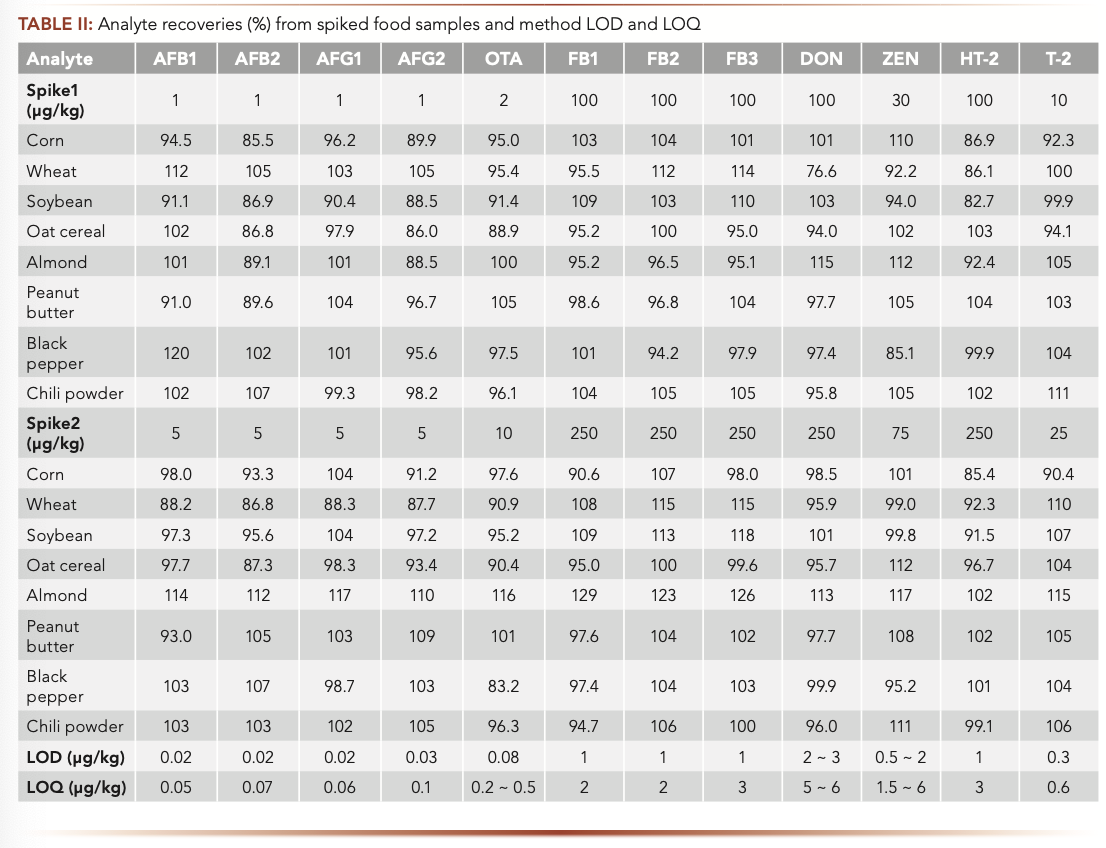
FIGURE 4: (a and b) The two MS/MS chromatograms of AFB1 (0.056 μg/kg) in a chili powder sample.
No interference or contamination from reagents, glassware, and sample tubes was observed in this study (no analyte was detected in all LRB samples). Method precision was assessed based on replicate analyses of the spiked food samples (3 replicates for each food matrix). The precision was then calculated based on the coefficient of variation (RSD%) of the collected data. The RSDs were 2.8 ~ 14.3% for the mycotoxins studied. Method accuracy assesses how close the experimental value is to the expected value. Method accuracy was evaluated by the recovery of a known amount of analyte spiked to a food sample (LFM samples). As shown in Table II, the recoveries for most analytes from the spiked LFM samples were between 80–120%, demonstrating good accuracy of the methods.
Method robustness was studied by slightly changing the experimental parameters such as the ratio of organic:water in extraction solution (60:40, 70:30, and 80:20, respectively), mobile phase gradients and LC columns from a different batch. No significant differences in method performance and analyte results were observed and thus confirmed the robustness of the method.
Determination of Mycotoxins in Selected Food Samples
The method was applied to the analysis of the targeted mycotoxins in nine different food products including soybean, wheat, almond, oat breakfast cereal, peanut butter, white corn, yellow corn, black pepper, and chili powder samples. All the mycotoxins determined in this study are below the regulated maximum levels (MLs) except for AFB1 in a peanut butter sample. A high amount of AFB1 (6.26 μg/kg) and a small amount of AFB2 (0.834 μg/kg) were determined in this peanut butter sample. Trace amount of AFB1 were also determined in a black pepper sample (0.186 μg/kg) and in a chili powder sample (0.056 μg/kg). Although different amounts of DON were determined in all the nine studied samples, they are all below the regulatory MLs. ZEN was also found in all the samples at low concentrations (ranging from 2 to 6 μg/kg) except for a black pep- per sample, which contained a high amount of ZEN at about 125 μg/kg. FB1, FB2, and FB3 were found only in corn samples because they are mainly produced by Fusarium verticillioides, a fungus predominant on maize and maize-based products (28). The yellow corn sample contained FB1 (88.6 μg/kg), FB2 (16.7 μg/kg), and FB3 (11.1 μg/kg), respectively, and the white corn sample contained FB1 (15.2 μg/kg), and FB2 (3.94 μg/kg). The HT-2 toxin (15.9 μg/kg) and T-2 toxin (7.1 μg/kg) were determined only in an oat cereal sample. OTA (3.92 μg/kg) was found only in a chili powder sample. The confirmation of the mycotoxins in these food samples were carried out by comparing the retention time and peak area ratio of qualifier to quantifier ion peaks of the analyte between samples and refer- ence standard (refer to Figures 1~4) and all the deviations from reference standards (deviations of retention time <2%, and deviation of ion ratio <15%) are within limits established by the European Union guidance (26,27).
Conclusions
A multianalyte LC–MS/MS method has been developed and validated for the reliable confirmation and quantification of 12 mycotoxins in various food matrices. All the mycotoxins with different physicochemical properties can be determined simultaneously in a single run. Immunoaffinity (IAC) sample cleanup can significantly improve data quality by effectively removing matrix interfering components from samples and enhancing the sensitivity with analyte concentrations. By coupling IAC sample treatment with the highly sensitive and selective LC–MS/MS, low levels of mycotoxins can be determined accurately from complex food samples. The method was validated using different food matrices with good linearity, precision, and accuracy.
References
(1) International Agency for Research on Cancer (IARC), Some Naturally Occurring Substances: Food Items and Constituents, Heterocyclic Aromatic Amines and Mycotoxins, Monographs on the Evaluation of Carcinogenic Risks to Humans (Lyon, France, 1993), vol. 56.
(2) Food and Agriculture Organization of the United Nations, Worldwide regulations for mycotoxins in food and feed: FAO Food and Nutrition Paper 81 (2003). http://www.fao.org/3/y5499e/y5499e00.htm
(3) Commission Regulation (EC) No. 1881/2006, Off J Eur Union L364, 5–24 (2006).
(4) Commission Regulation (EC) No. 1126/2007, Off J Eur Union L255, 14–17 (2007).
(5) Commission Regulation (EU) No. 105/2010, Off J Eur Union L35, 7–8 (2010).
(6) Commission Regulation (EU) No. 165/2010, Off J Eur Union L50, 8–12 (2010).
(7) U.S. FDA, in Molecular Biology and Natural Toxins, Mycotoxins in Domestic and Imported Foods 7307.001 (2007). http://wayback.archiveit.org/7993/20170404002445/ https://www.fda.gov/downloads/ Food/ComplianceEnforcement/ UCM073294.pdf
(8) S. Agriopoulou, E. Stamatelopoulou, and T. Varzakas, Foods 9(518),1–23 (2020).
(9) N.W. Turnera, S. Subrahmanyamb, and S.A. Piletskyb, Analytica Chimica Acta. 632, 168–180 (2009).
(10) P. Zöllner and B. Mayer-Helm, J Chromatogr. A. 1136(2), 123–169 (2006).
(11) P. Li, Z. Zhang, X. Hu, and Q. Zhang, Mass Spectrom. Rev. 32(6), 420–452 (2013).
(12) M. Sulyok, F. Berthiller, R. Krska, and R. Schuhmacher, Rapid Commun. Mass Spectrom. 20, 2649–2659 (2006).
(13) E. Beltran, M. Ibanez, J.V. Sancho, and F. Hernandez. Rapid Commun. Mass Spectrom. 23, 1801–1809 (2009).
(14) D. Li, J.A. Steimling, J.D. Konschnik, S.L. Grossman, and T.W. Kahler, J. AOAC Int. 102, 1–8 (2019).
(15) M. Rychlik and S. Asam. Anal. Bioanal. Chem. 390, 617–628 (2008).
(16) E. Varga, T. Glauner, R. Köppen, K. Mayer, M. Sulyok, R. Schumacher, R. Krska, and F. Berthiller. Anal. Bioanal. Chem. 402, 2675−2686 (2012).
(17) F. Al-Taher, K. Banaszewski, L. Jackson, J. Zweigenbaum, D. Ryu, and J. Cappozzo, J. Agric. Food Chem. 61, 2378−2384 (2013).
(18) K. Zhang, M.R. Schaab, G. Southwood, E.R. Tor, L.S. Aston, W. Song, B. Eitzer, S. Majumdar, T. Lapainis, H. Mai, K. Tran, A. El-Demerdash, V. Vega, Y. Cai, J.W. Wong, A.J. Krynitsky, and T.H. Begley, J. Agric. Food Chem. 65, 7138−7152 (2017).
(19) M.W. Trucksess, S.W. Page, G.E. Wood, T.H. Cho, J. AOAC Int. 81, 880−886 (1998).
(20) A. Desmarchelier, S. Tessiot, T. Bessaire, L. Racault, E. Fiorese, A. Urbani, W.C. Chan, P. Cheng, and P. Mottier. J. Chromatogr. A 1337, 75−84 (2014).
(21) C. Brera, F. Debegnach, B. De Santis, E. Pannunzi, C. Berdini, E. Prantera, E. Gregori, and M. Miraglia, Talanta 83, 1442−1446 (2010)
(22) MaxSignal® IAC 6-in-1 Combo, mycotoxin immunoaffinity column user manual, MN50-1505-01, PerkinElmer (2019).
(23) L.K. Sørensen and T.H. Elbæk, J. Chromatogr. B. 820(2), 183–196 (2005)
(24) A.J. Krynitsky, J.W. Wong, K. Zhang, and H. Safarpour, LCGC N. Am. 35(7), 444–451 (2017).
(25) U.S. FDA, FDA Guidelines for the Validation of Chemical Methods for the FDA Foods Program. http://www.fda.gov/downloads/ScienceResearch/FieldScience/UCM298730.pdf
(26) European Commission Decision (2002/657/EC), Off. J. Eur. Union L221, 8–36 (2002).
(27) Commission Regulation (2006/401/ EC) of 23 February 2006, Off. J. Eur. Union L70, 12–34 (2006).
(28) J.W. Bennett and M. Klich, Clinical Microbiol. Rev. 16, 497–516 (2003).
Jingcun Wu and Tyrally Ordinario are with PerkinElmer Health Sciences Canada, Inc. in Ontario, Canada. Direct correspondence to: jingcun.wu@perkinelmer.com

New Study Reviews Chromatography Methods for Flavonoid Analysis
April 21st 2025Flavonoids are widely used metabolites that carry out various functions in different industries, such as food and cosmetics. Detecting, separating, and quantifying them in fruit species can be a complicated process.
Analytical Challenges in Measuring Migration from Food Contact Materials
November 2nd 2015Food contact materials contain low molecular weight additives and processing aids which can migrate into foods leading to trace levels of contamination. Food safety is ensured through regulations, comprising compositional controls and migration limits, which present a significant analytical challenge to the food industry to ensure compliance and demonstrate due diligence. Of the various analytical approaches, LC-MS/MS has proved to be an essential tool in monitoring migration of target compounds into foods, and more sophisticated approaches such as LC-high resolution MS (Orbitrap) are being increasingly used for untargeted analysis to monitor non-intentionally added substances. This podcast will provide an overview to this area, illustrated with various applications showing current approaches being employed.
Extracting Estrogenic Hormones Using Rotating Disk and Modified Clays
April 14th 2025University of Caldas and University of Chile researchers extracted estrogenic hormones from wastewater samples using rotating disk sorption extraction. After extraction, the concentrated analytes were measured using liquid chromatography coupled with photodiode array detection (HPLC-PDA).


