Molar Mass Determination of Collagen Peptides
A simple gel permeation chromatography/size-exclusion chromatography (GPC/SEC) method for molar mass determination of collagen peptides was developed, allowing for reliable molar mass determination using ultraviolet (UV) detection. The application of UV detection together with commercially available broadly distributed molar mass reference materials allows for easy and cost-effective laboratory implementation. The reliability of the method was checked by round-robin tests.
Hydrolyzed collagens (also referred to as collagen peptides or collagen hydrolysate) are products obtained by hydrolysis of natural proteins. They easily dissolve in water, and are highly digestible. Therefore, collagen peptides are used in dietary supplements and functional foods.
With typical molar masses of less than 10,000 g/mol collagen peptides comprise between at least 2 and at most 100 amino acids. Collagen peptides do not contain chains only of one specific molar mass, but exhibit a molar mass distribution (MMD). Because the MMD and the average molar mass influence application properties, there is a need for routine methods for reliable molar mass characterization of collagen peptides.
Gel permeation chromatography/size exclusion chromatography (GPC/SEC) is a chromatographic technique that separates macromolecules based on their size in solution. The ease, reliability, and reproducibility of GPC/SEC resulted in the technique becoming the workhorse in molar mass characterization of macromolecules (1).
However, molar masses derived by GPC/SEC are based on calibration curves established using suitable polymer standards. If the chemical structure of the standards deviates from the structure of the sample to be analyzed, only a relative molar mass is obtained (2).
One way to overcome this problem is the use of molar mass sensitive GPC/SEC-detectors, such as online light-scattering or online viscosity detection (2,3,5). However, such instrumentation is costly, and is not available in all laboratories. Furthermore, the possible pitfalls require operation by well-trained personnel. As a result, molar masses derived by different laboratories are often not comparable to each other.
Therefore, it was the purpose of the present work to develop a simple, robust, precise (but cost-effective) GPC/SEC approach for molar mass determination of collagen peptides. The approach should make it possible to provide close to true molar masses for collagen peptides, without applying molar mass sensitive detectors. Ultraviolet (UV)-detection was chosen, because of the more stable baseline of UV-detectors compared to refractive index (RI)-detection, which is typically applied in GPC/SEC.
For the present study, true weight average molar masses of five broadly distributed collagen peptides were determined using GPC/SEC with viscosity detection (4,5). Afterward, these samples were used as reference materials to establish a GPC/SEC calibration by a broad standard calibration approach. Finally, the suitability of the calibration approach was verified on another set of collagen peptides that were sent to four different laboratories to perform a round-robin test.
Materials and Methods
Dextran and pullulan standards (PSS), with molar masses at peak maximum ranging from Mp = 180 g/mol to Mp = 106,000 g/mol, were applied to set up a universal calibration curve ([ɳ] x M) to obtain the molar masses of the collagen peptides.
A mixture of collagen fragments (CNBr-Peptides), obtained by FILK (Research Institute of Leather and Plastic Sheeting) and suitable for UV detection, were used to establish the base calibration required for the broad calibration approach. The sample contained collagen fragments having molar masses in the range 3500 to 38,000 g/mol, certified by the manufacturer. However, the sample mixture was not suited for establishing a universal calibration curve, because of a lack of sufficiently precise information regarding the concentrations of the different collagen fragments.
Five collagen peptides (samples 1–5) used as reference materials after determination of their weight average masses, as well as six additional collagen peptides (samples A–F) to be applied in a round-robin test, were provided by the Gelatine Manufacturers of Europe (https://www. gelatine.org/en/service/contact.html). The newly established reference samples can be obtained by the GME Secretariat (https://www.gelatine.org/en/ service/contact.html).
Phosphate buffer pH 5.30 with 0.2 M NaCl (13.27 g KH2PO4, 0.44 g Na2HPO4, 11.69 g NaCl in 1.0 L deionized water) was applied as the GPC/SEC eluent. All salts were obtained from Sigma Aldrich in p.A. purity. Water was deionized in house using an ion exchanger (Behr).
A PSS SECcurity GPC/SEC system (PSS), equipped with an isocratic pump, a four channel on-line degassing device, a column thermostat, an autosampler and a UV-vis detector (λ = 214 nm), was applied for the broad standard approach.
For determination of true weight average molar masses of the collagen peptides reference samples, the UV detector was replaced by a SECcurity refractive index detector in series with a Viscotek H502 viscometer detector (Viscotek). Data acquisition and analysis were performed using PSS WinGPC UniChrom Version 8.2 (PSS).
PSS PROTEEMA columns (5 μm particle size, 100 Å porosity, 8.0 mm i.d. x 300 mm); with PSS PROTEEMA pre-column (8.0 mm i.d. x 50 mm) (PSS) and TSK SWXL G2000 columns (5 μm particle size, 100 Å porosity, 7.8 mm i.d. x 300 mm); with TSK precolumn (7.8 mm i.d. x 50 mm) (Tosoh) were used. Both column types yielded similar results GPC/SEC measurements were carried out at a temperature of 40° C and a flow rate of 0.5 mL/min. A small amount of benzoic acid (internal flow marker) was added to the solvent used for sample preparation. At least two separate concentrations were prepared for each sample. After dissolving overnight, each sample solution was analyzed in duplicate without further pretreatment.
For molar mass determination of the collagen peptides reference materials by GPC/SEC-viscosity, sample concentrations and injection volume of 3-7 g/L and of 100 μL, respectively, were used.
For the broad standard calibration approach, a typical sample concentration of 2 g/L and an injection volume of 20 μL were applied.
Theoretical Background of Broad Standard Calibration Approach
GPC/SEC is a separation technique that separates according to the size of molecules in solution. Determination of true sample molar masses requires a calibration curve constructed with standards having a chemical structure identical to that of the sample to be analyzed. The most common approach to construct the calibration curve is by injection of a series of narrowly distributed standards of known molar masses. If such narrowly distributed standards are not available, broadly distributed standards can be applied as well.
Based on the work of Benoit and Grubisic, it is known that polymers eluted at the same GPC/SEC elution volume have identical sizes (hydro-dynamic volumes) (2,4). The relation between the molar masses of macro-molecules eluted at the same elution volume but being of different chemical structure can be expressed as: (3)

where A and B are parameters that depend on the Mark-Houwink parameters of the two polymers in the eluent. Usually, A and B, which relate the molar mass of standards (M1) to the molar mass of the analyte at the same elution volume (M2), are unknown, and need to be determined.
For this purpose, a base calibration is constructed using narrowly distributed standards, the chemical structure of which is allowed to deviate from that of the analyte. Afterward, one or more broadly distributed reference samples having the same chemical structure as the material to be analyzed are run using the same experimental conditions. For these broadly distributed reference samples, one or more molar mass averages (Mn or Mw, target values) needs to be known. Using the detector signals S(V) of the broadly distributed reference materials and the molar mass of the base calibration at elution volume V, M1(V), makes it possible to calculate the number and weight average molar masses for each test set of A and B. It can easily be shown that the number and weight average molar masses can be calculated for each chromatogram expressed by:


Here, Mn,i(A,B) and Mw,i(A,B) are the number and weight average molar masses for chromatogram i, when applying parameters A and B to the base calibration, M1(V). The calculated molar mass averages depend on the choice of parameters A and B. A simultaneously good agreement between the target values of the broadly distributed samples and the molar mass average values calculated, based on their chromatograms according to Equation 2 and Equation 3, is achieved only if A and B are chosen correctly. Therefore, A and B are varied systematically by appropriate software routines until the best agreement between the calculated molar mass averages for the chromatograms of the broadly distributed reference samples with the target values is achieved. The so-identified set of A and B makes it possible to convert the base calibration into a calibration curve, representing the chemical structure of the analyte.
Results
To apply the above described broad standard approach to collagen peptides, a series of broadly distributed collagen peptides, for which either Mn or Mw are known, was required. Because such materials were not available, true weight average molar masses for samples 1–5 were determined using GPC/SEC with viscosity and RI detection. The required base calibration curve (log([n] x M) vs. V) for application of GPC/SEC viscosity was established using monodisperse saccharides and narrowly distributed pullulan and dextran standards with Mp values as provided by the standard supplier. Columns 2 and 3 of Table I list the average weight average molar masses, Mw, and the average intrinsic viscosities, [ɳ], of the collagen peptides with their respective standard deviations.
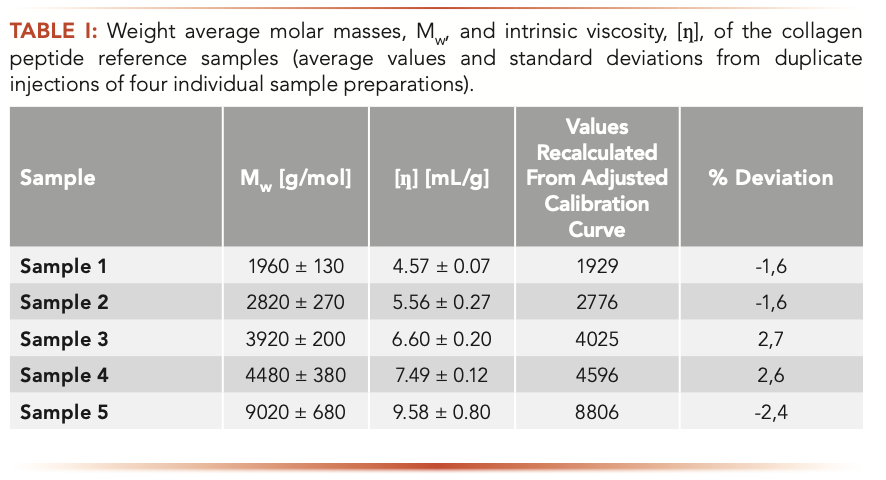
The so-characterized collagen peptides were used with their weight average molar masses as broadly distributed reference materials to convert a base calibration to a collagen calibration using the broad standard calibration approach.
It was the intention to apply UV detection because of the more stable baseline; thus application of the mono- and polysaccharides applied for establishing the universal calibration curve was not feasible. Therefore, a UV-active sample containing different collagen fragments (CNBr-Peptides) of known molar masses was run. The GPC/SEC chromatogram of this sample (Figure 1) reveals resolved peaks to which molar masses can be clearly assigned. The resulting base calibration is shown in Figure 2.
FIGURE 1: Chromatogram of the CNBr peptides sample on the PSS Proteema column with peak molar masses as indicated by supplier. Please note that on some columns the peak corresponding to a molar mass of 55 kDa is not as effectively separated as shown here, due to elution close to the exclusion limit.
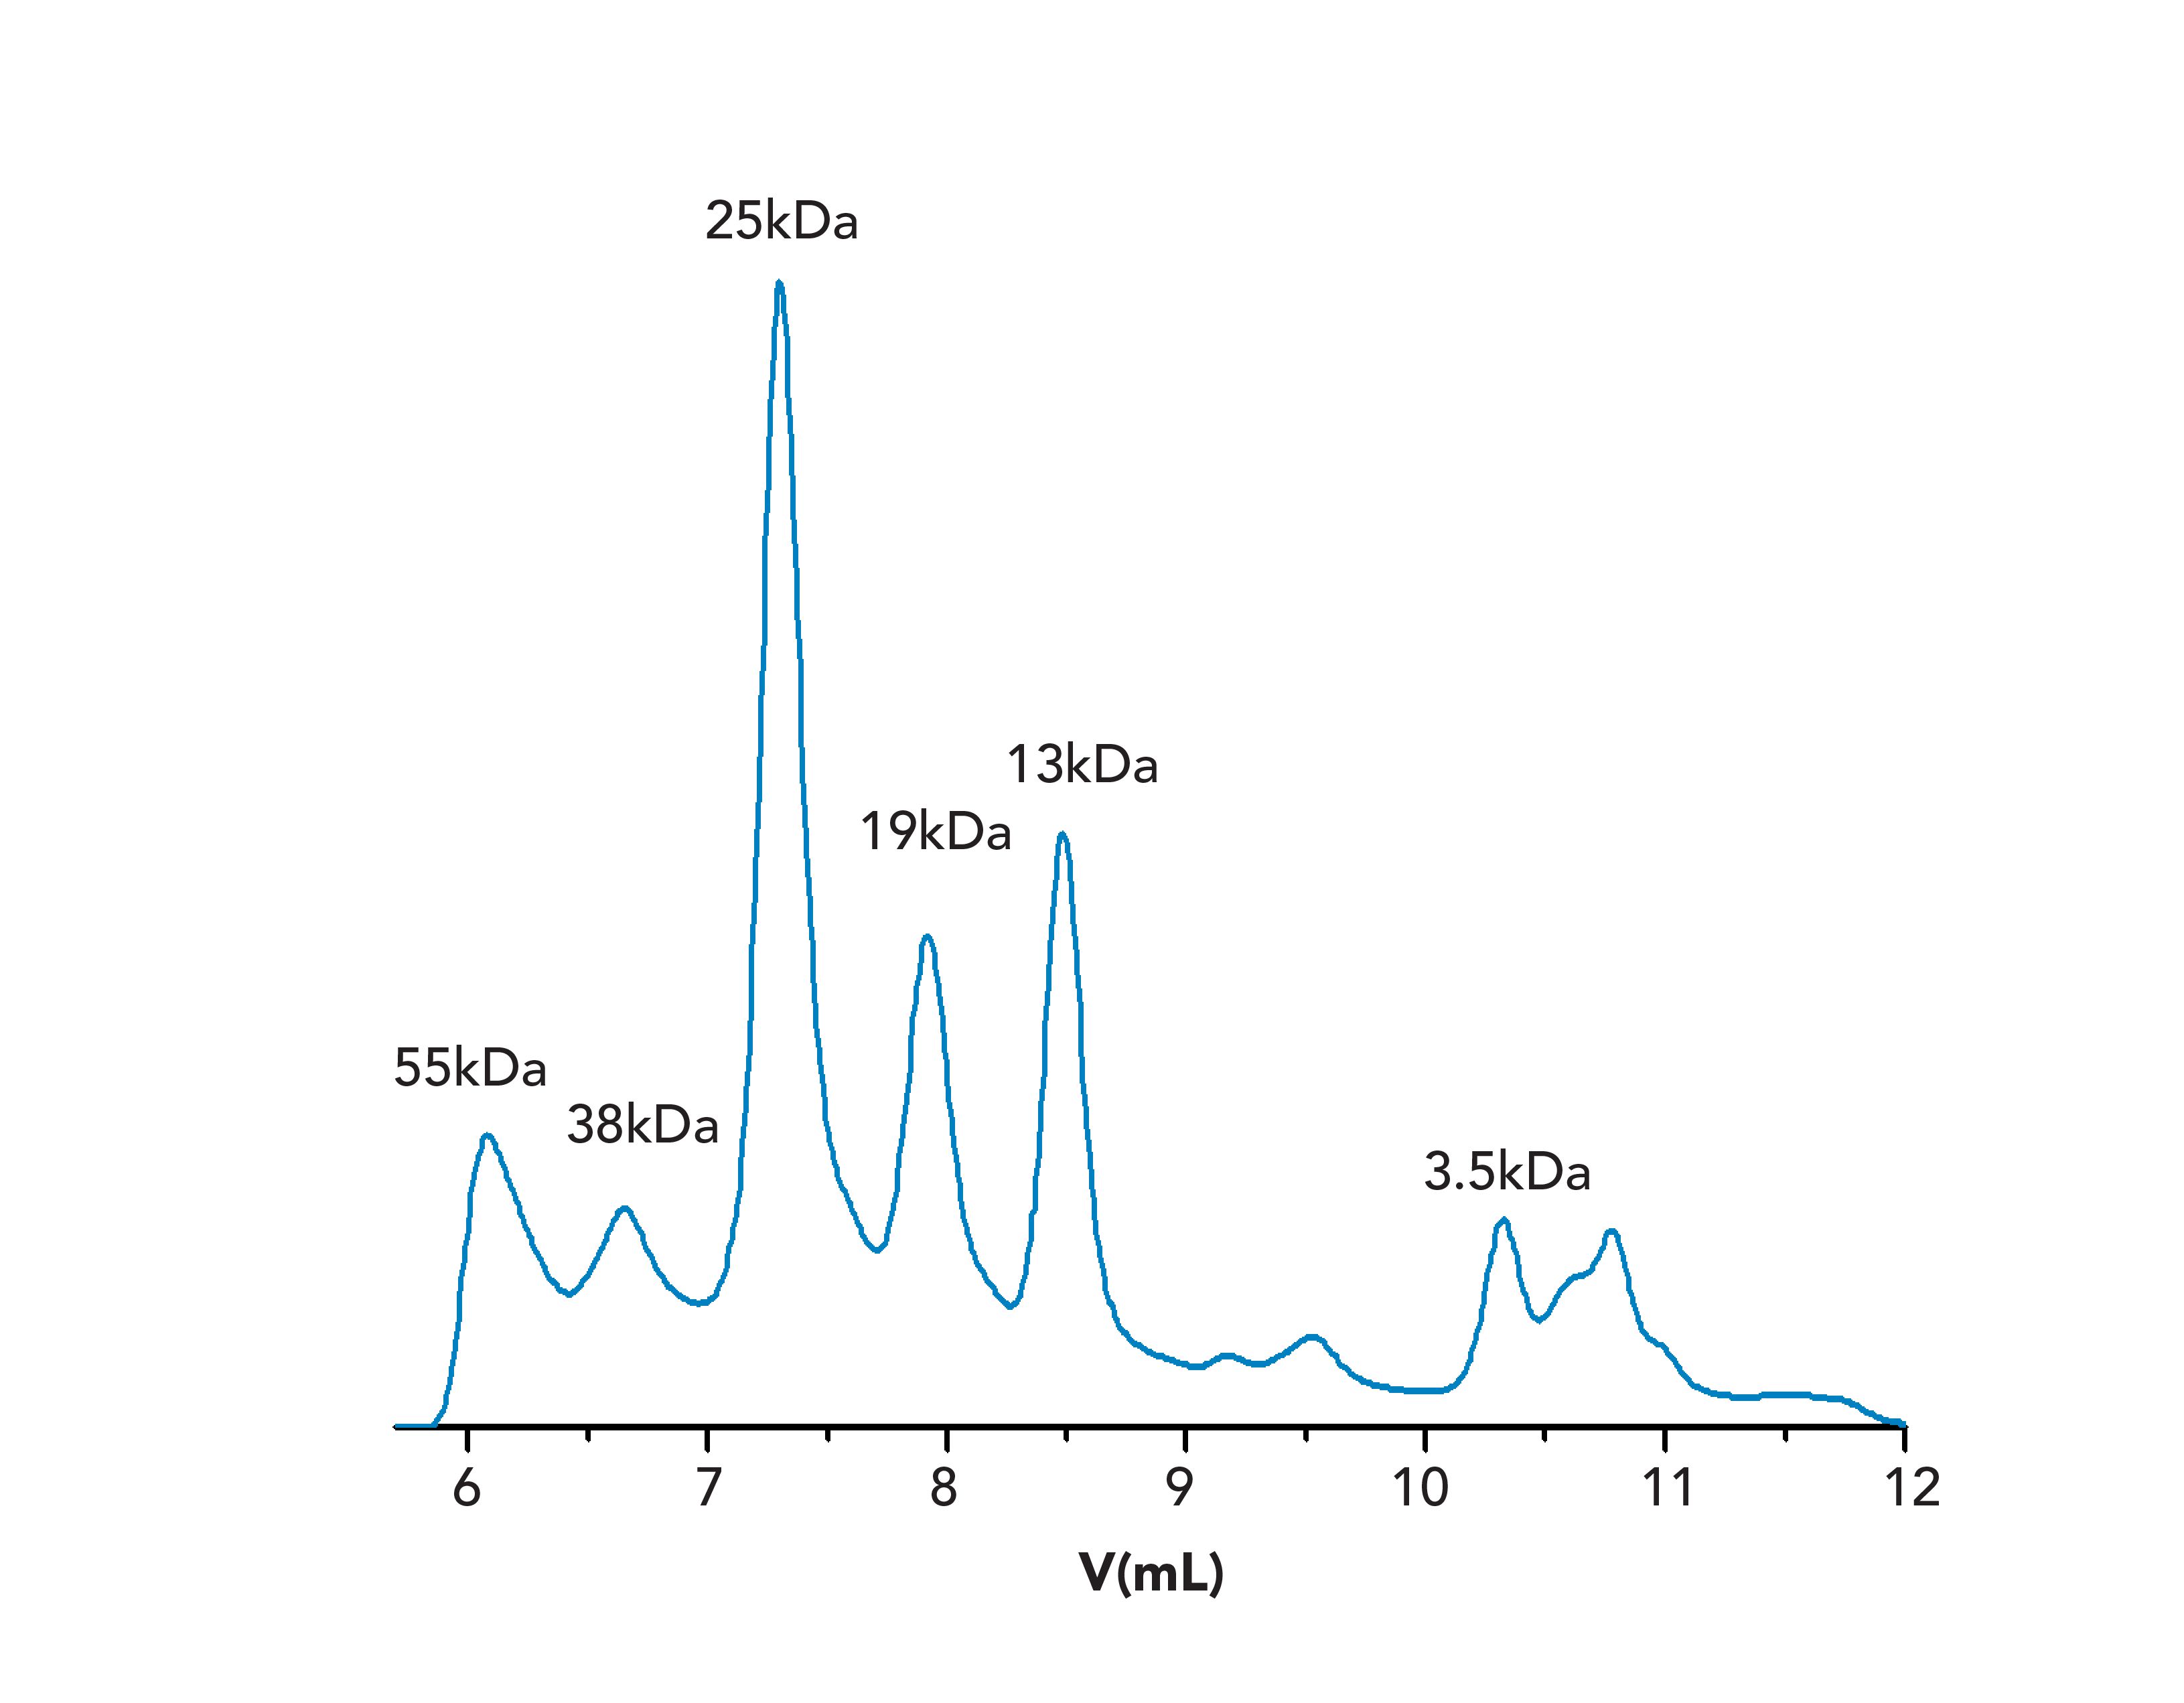
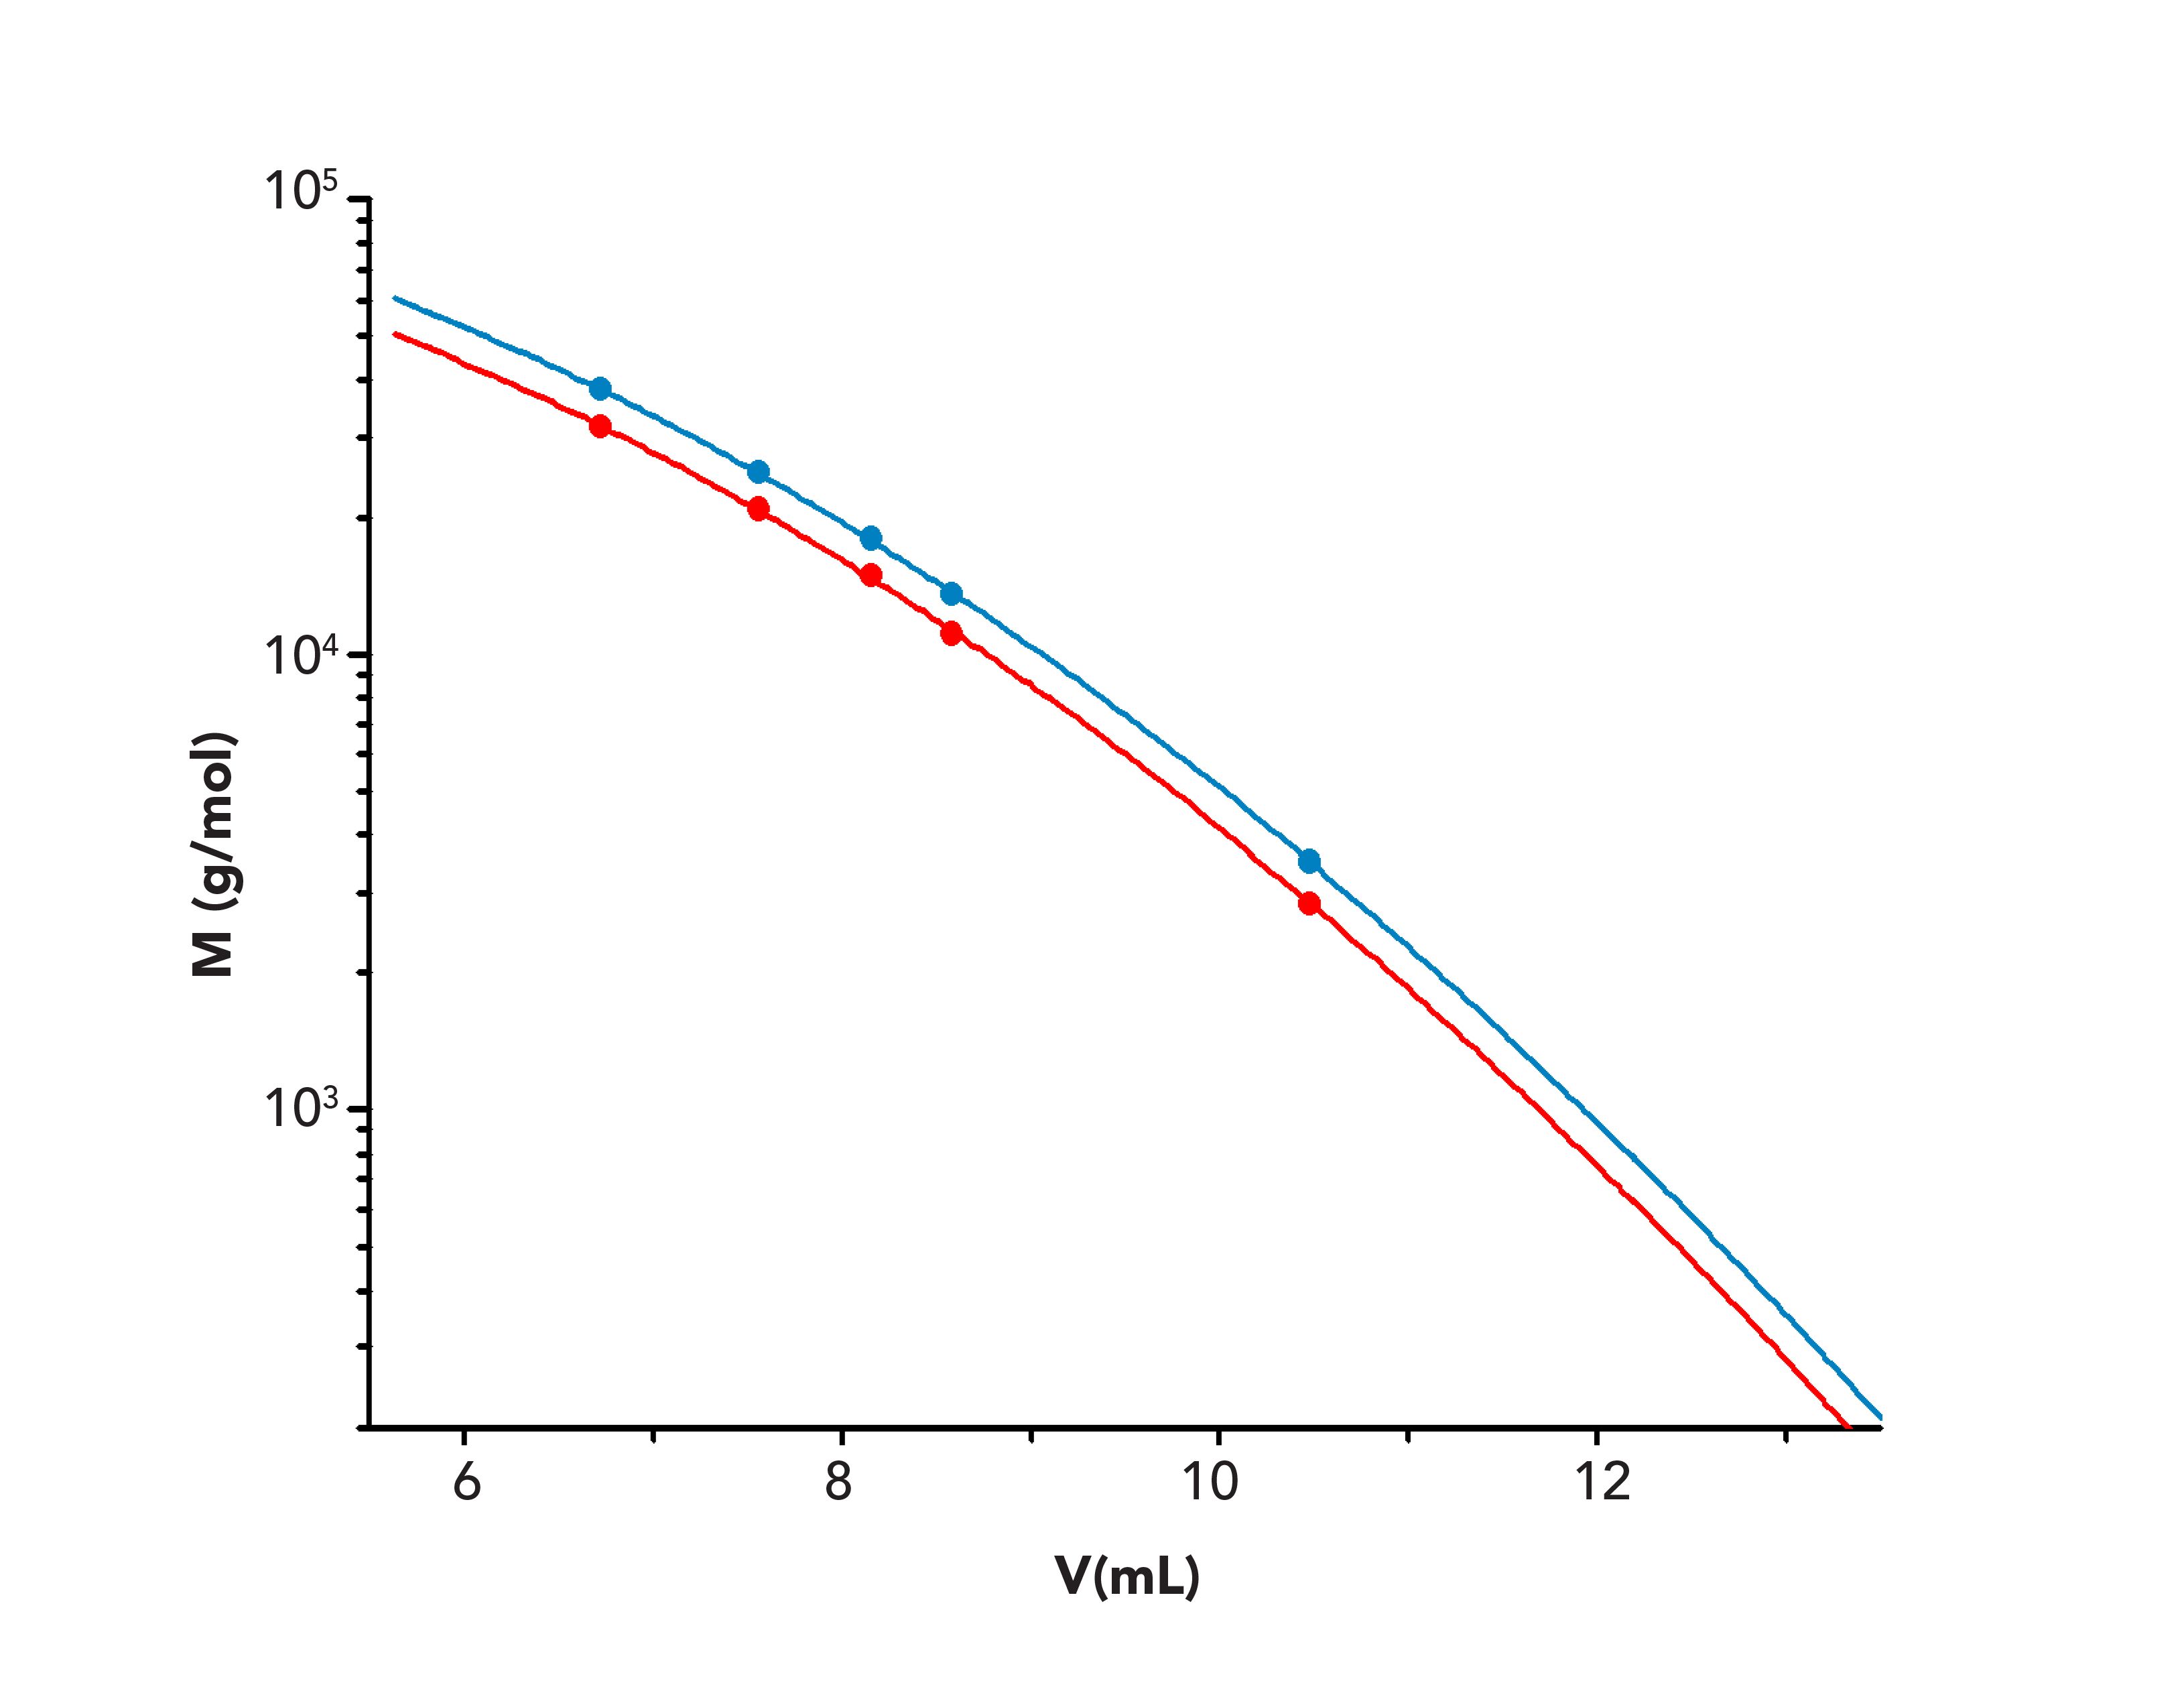
FIGURE 2: Overlay of calibration curves constructed using CNBr peptides base calibration (red), and collagen peptide calibration curve obtained by broad standard calibration (blue) on a PSS Proteema column.
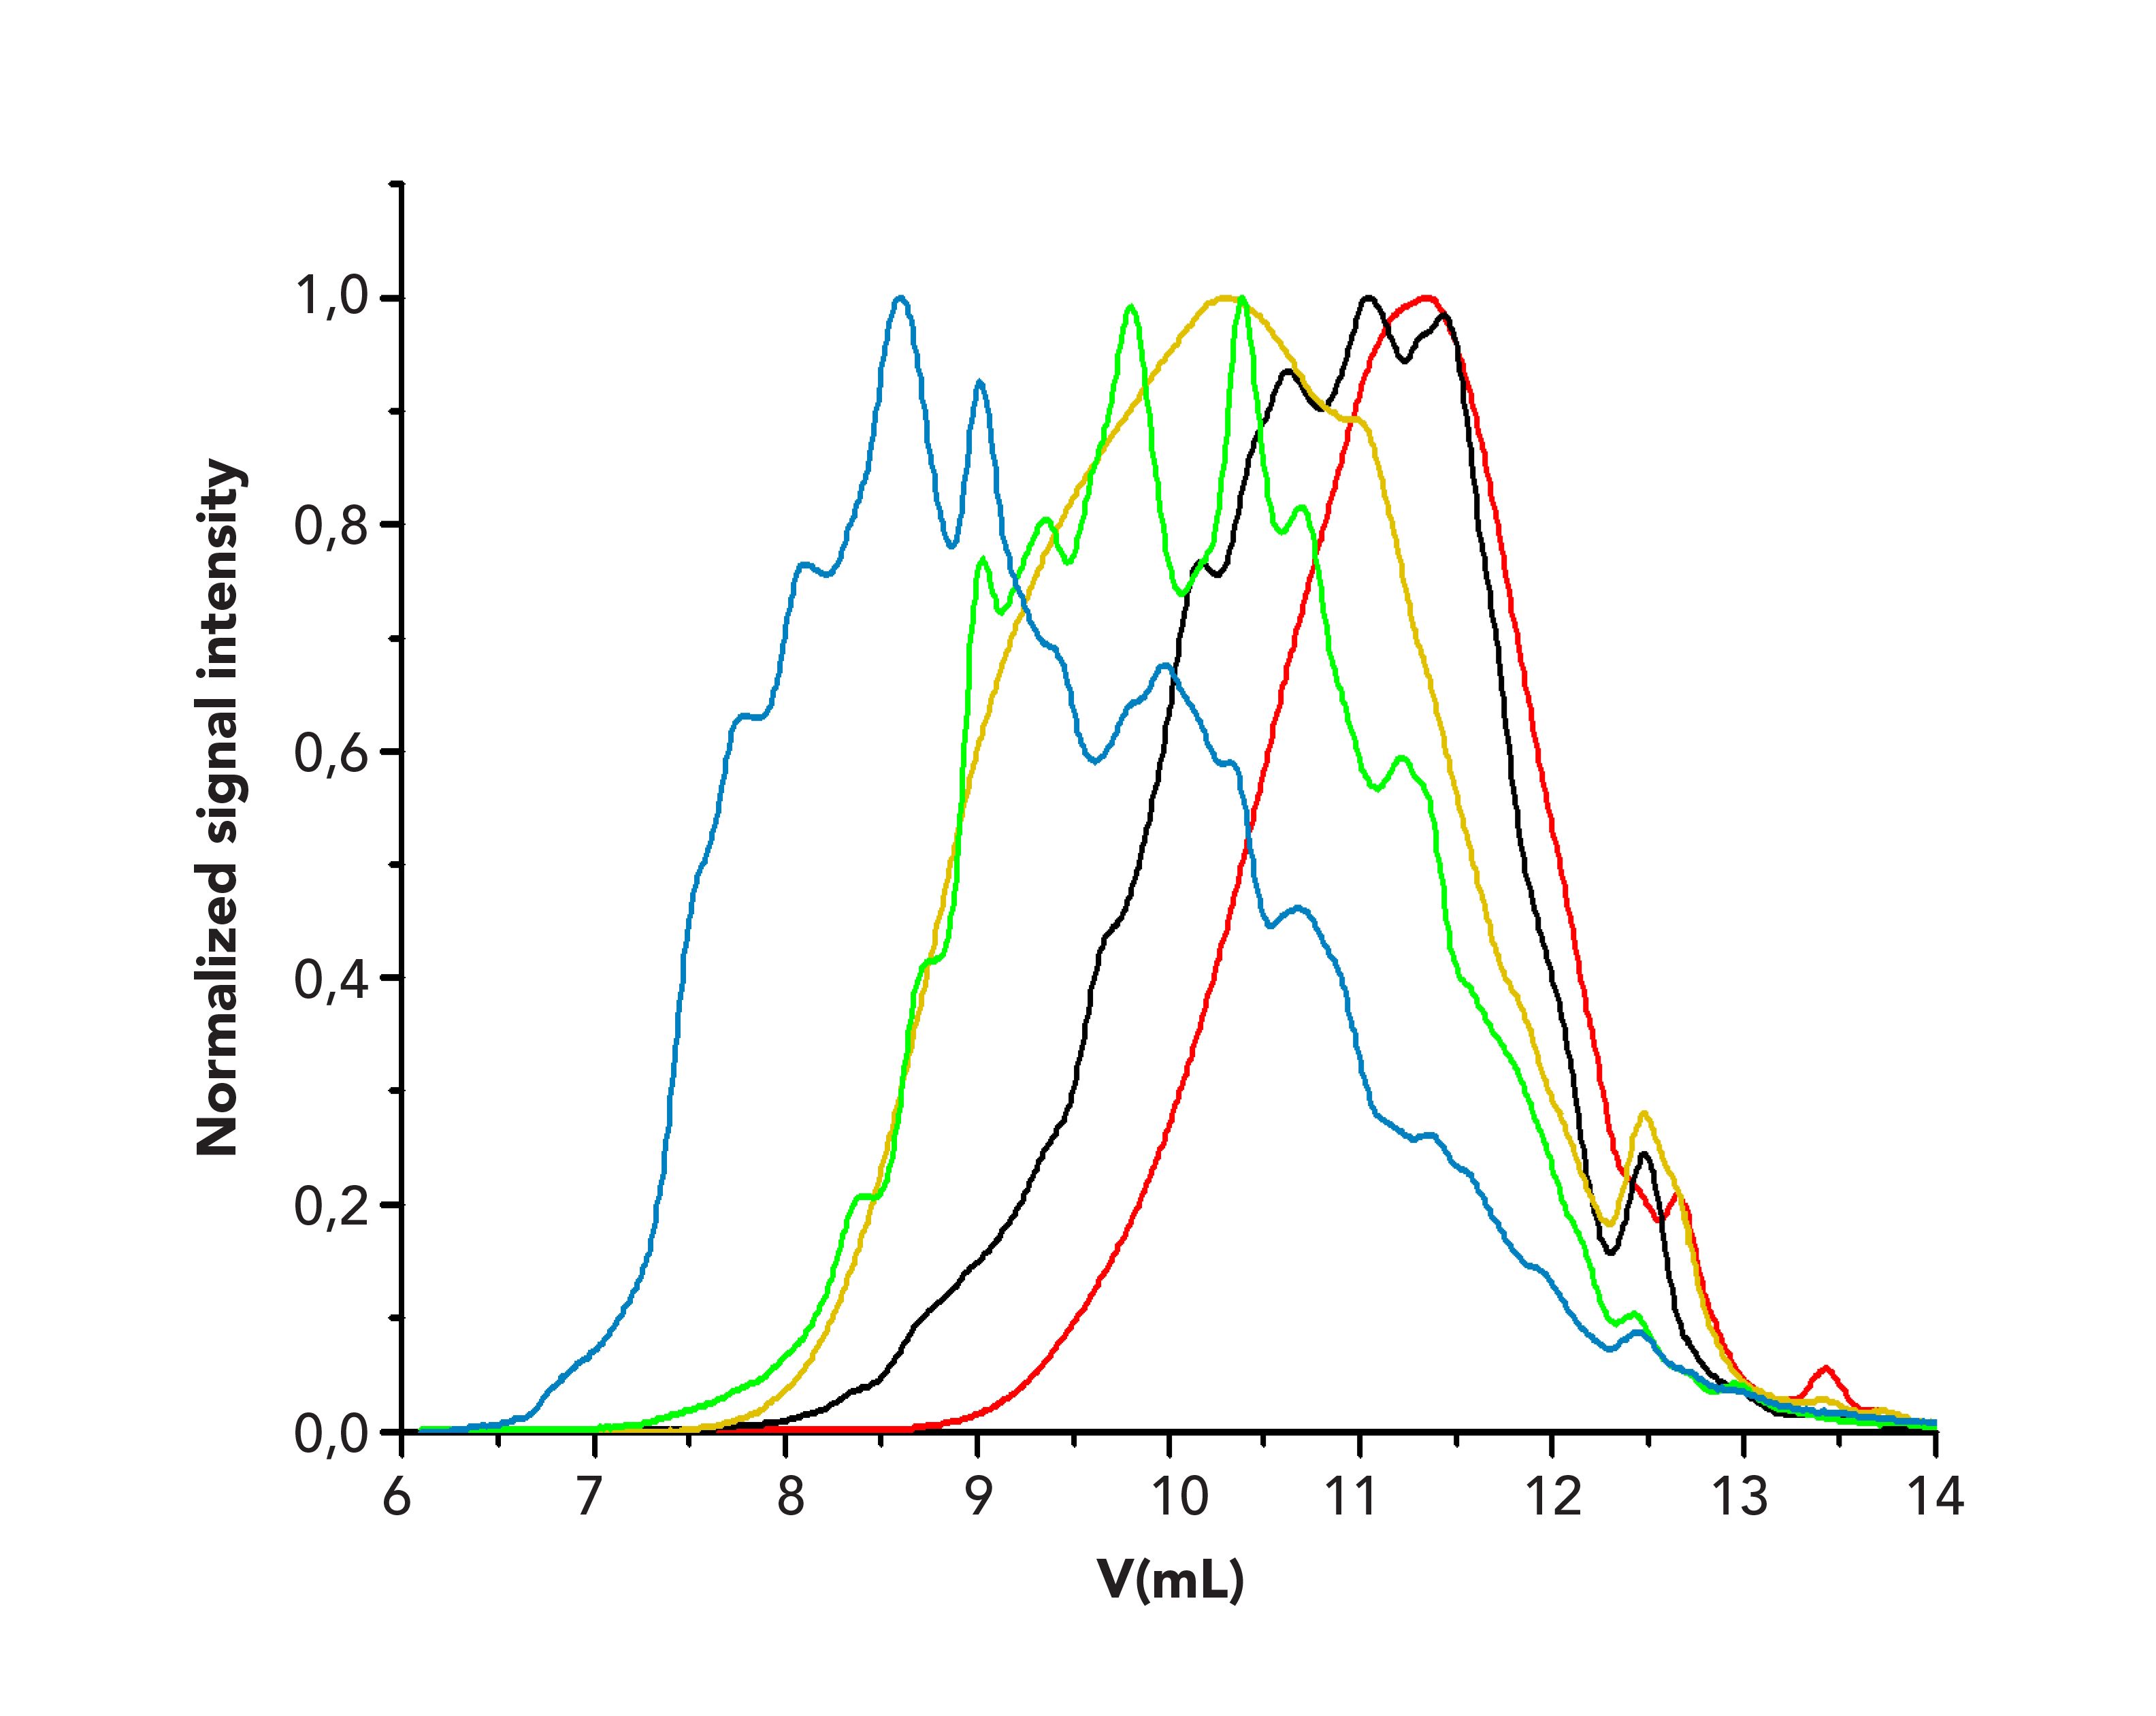
Once the base calibration was established, the broadly distributed reference materials were run using the same chromatographic conditions. An overlay of the chromatograms is provided in Figure 3. The chromatograms are rather broad, and reveal multiple peak maxima such that assignment of the molar mass to the peak maximum of the chromatogram would not be feasible. This is particularly true because the maximum of the chromatogram does not need to coincide with the maximum of the molar mass distribution.
FIGURE 3: Overlay of the chromatograms of the collagen peptides reference materials sample 1 (red), sample 2 (black), sample 3 (orange), sample 4 (green), sample 5 (blue) on a PSS Proteema column.
In the next step, parameters A and B were adjusted by the software such that the calibration curve derived by applying A and B to the base calibration together with the chromatograms of the broadly distributed reference materials resulted in the best agreement of target and calculated weight average molar masses. The weight average molar masses obtained by applying the resulting calibration are given in the fourth column of Table I. In all cases, the calculated weight aver- age molar masses deviate less than 3% from the target values, which had been obtained by GPC/SEC-viscosity (column 2 in Table I).
For comparison, the calibration curve established using the CNBr peptides is overlaid to the adjusted calibration in Figure 2. The latter is shifted toward lower molar masses. This direct application of the CNBr-peptides calibration would therefore result in an overestimation of the molar masses for collagen fragments.
Round-Robin Tests
To check whether the approach is suitable for obtaining identical weight average molar masses irrespective of the laboratory performing molar mass determination, the sample for establishing the base calibration curve, the five broadly distributed reference materials together with their assigned weight average molar masses, and a set of six collagen peptides, used as unknowns, were provided to four different laboratories. They were asked to use the chromatographic conditions provided in the experimental section and to follow the above established calibration approach. The results obtained for the samples in the different laboratories are compared to each other in Table II, which also provides a comparison with the true molar masses that were obtained independently by GPC/SEC-viscosity analysis. A graphical representation of the results is given in Figure 4.
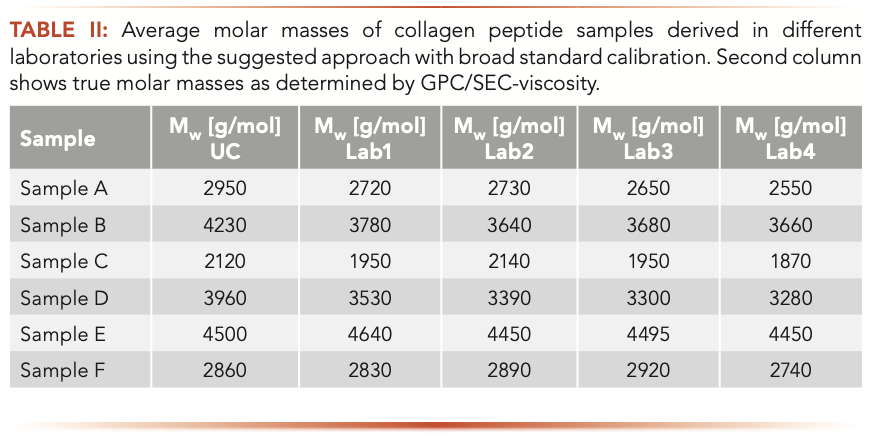
FIGURE 4: A graphical representation of the GPC/SEC results obtained independently in different laboratories.
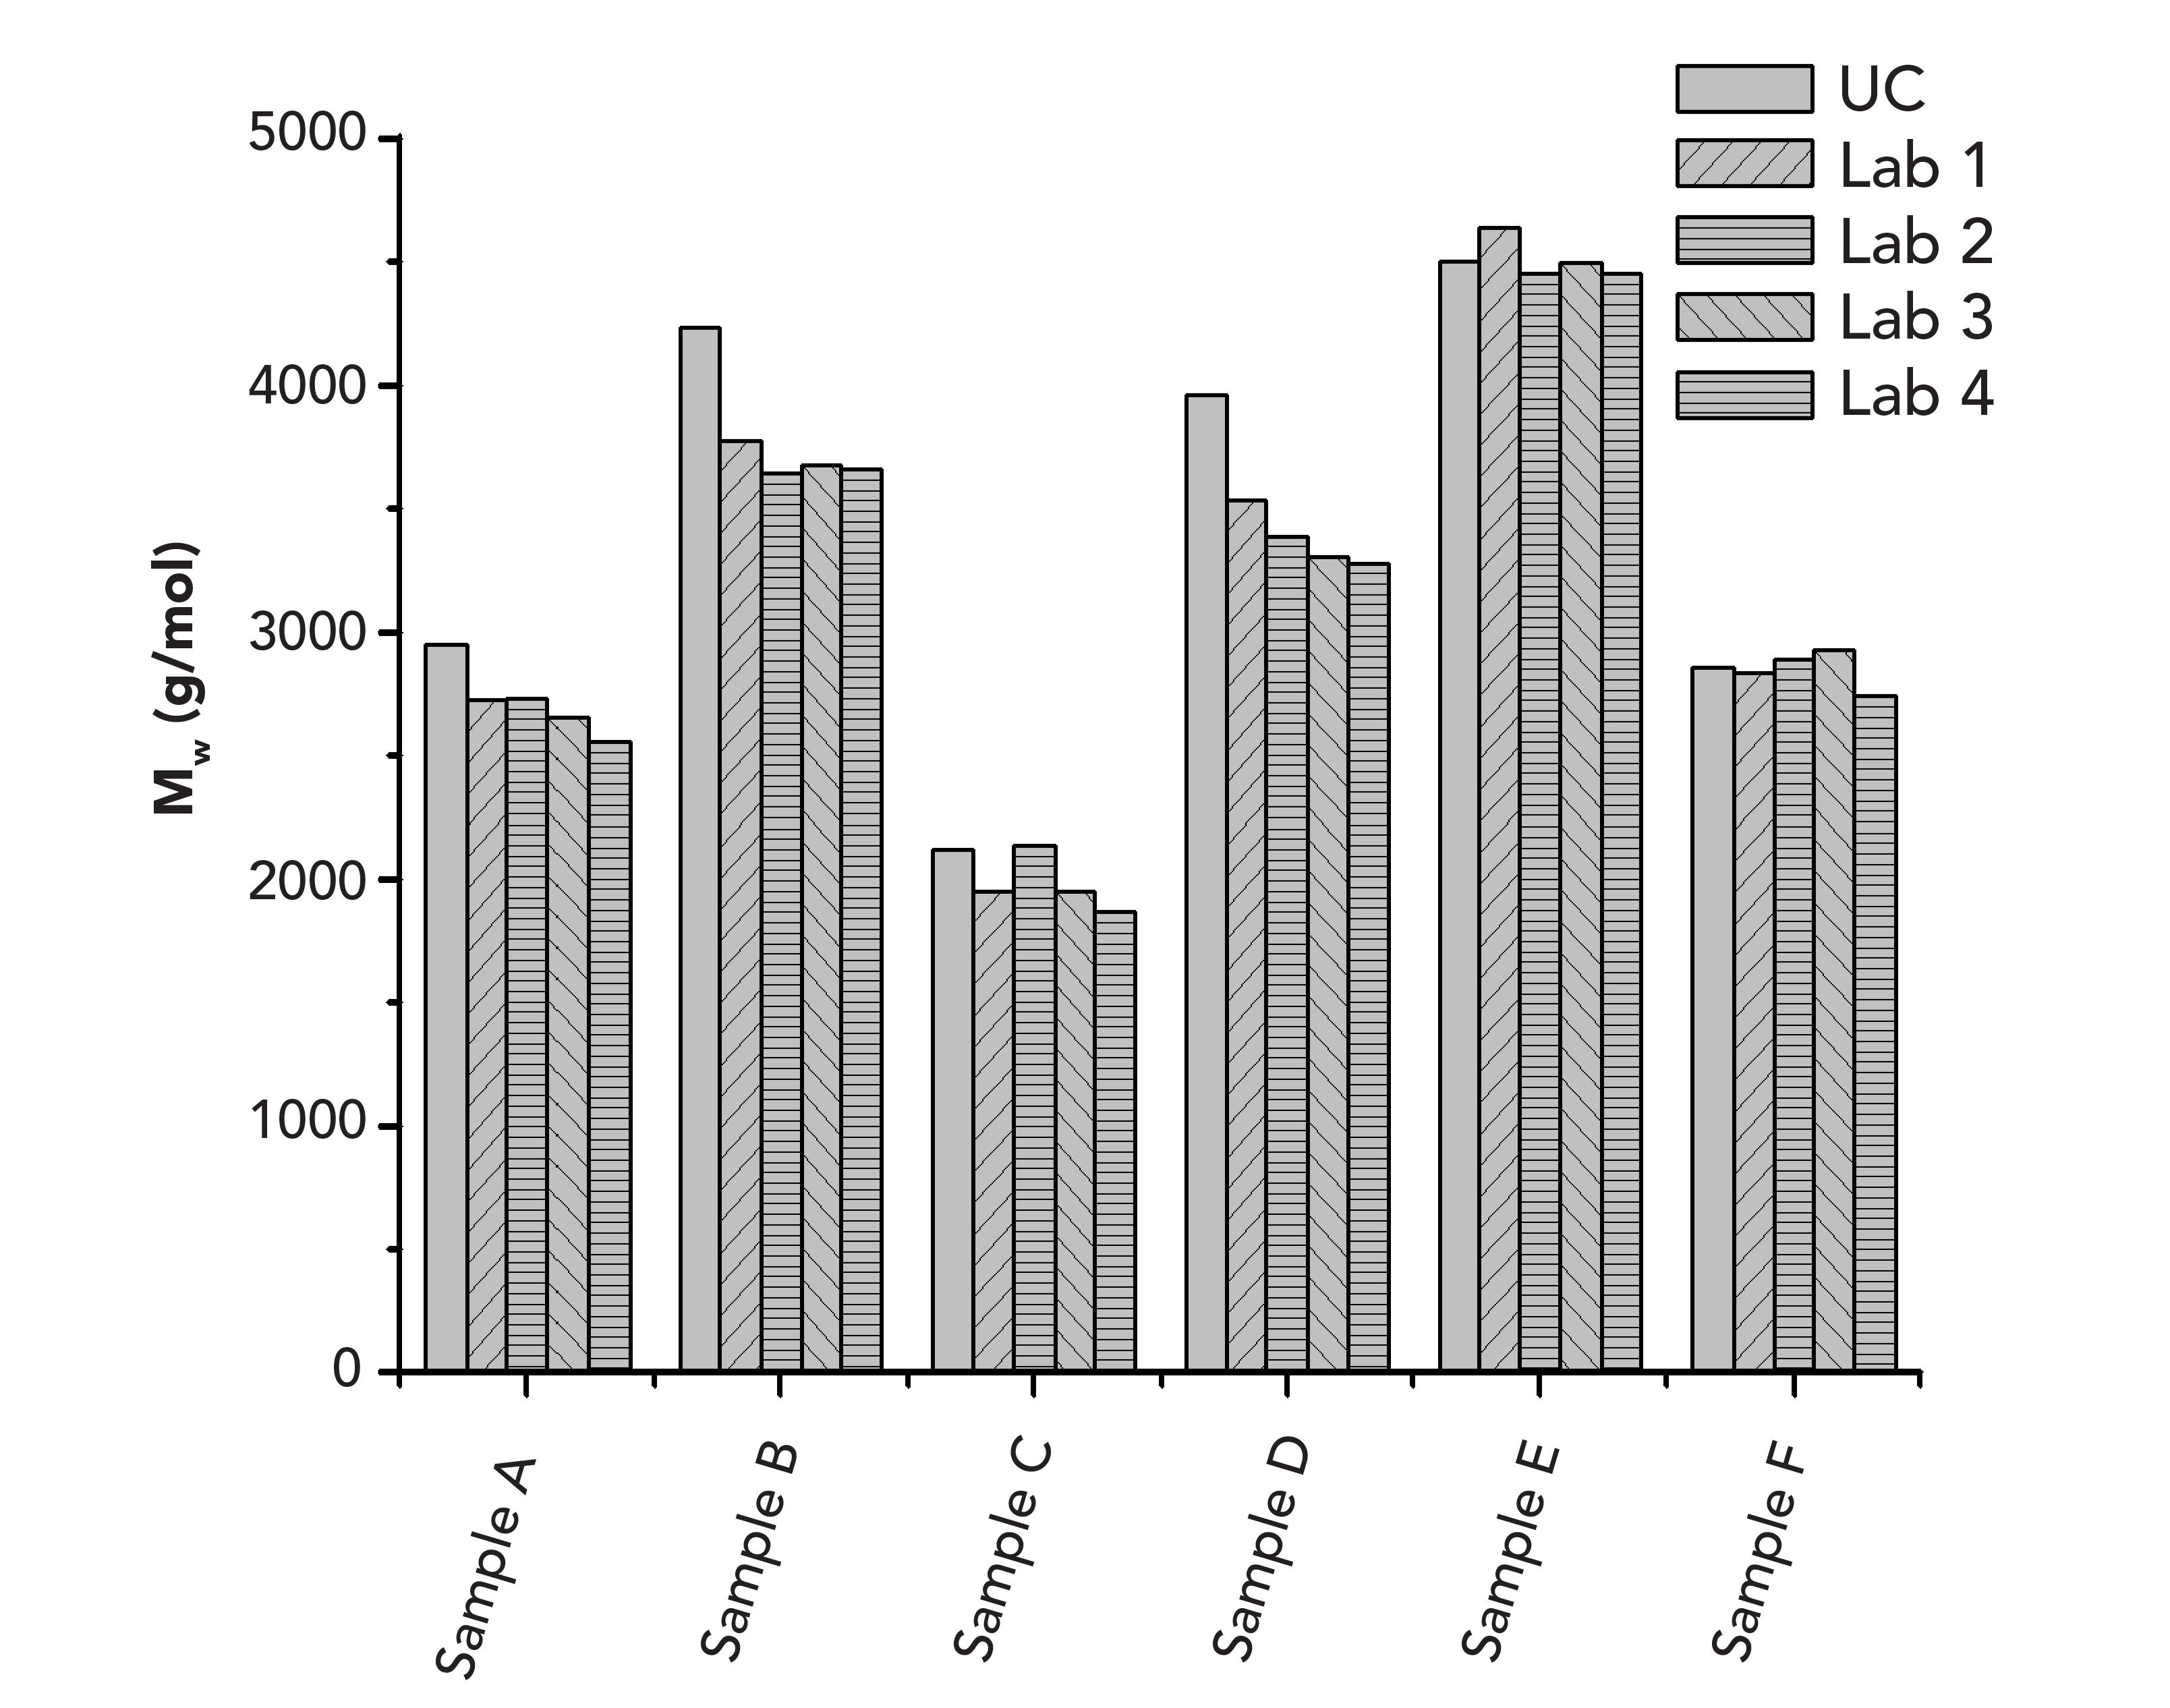
The results of the different laboratories agree well with each other. The average deviation of a laboratory result from the mean is less than 4%. Thus, reliable inter-laboratory comparison is possible using the above approach.
Furthermore, on average, the molar masses determined in the different laboratories deviate less than 9% from the true molar masses derived by the more demanding GPC/SEC-viscosity approach. Thus, it can be concluded that the broad standards approach described above not only allows for reliable inter-laboratory comparison, but also makes it possible to obtain close to true molar masses for the collagen peptides. This result is particularly interesting, because the collagen peptide compositions of the samples might deviate from each other because they originated from different collagen sources.
Conclusion
The use of five broadly distributed collagen peptide reference materials to convert a base calibration resulting from using a mixture of collagen fragments is an easy way to obtain a reliable calibration curve for collagen peptides.
Instead of applying more demanding molar mass sensitive detection devices or relying on laboratory-specific reference materials, the commercial availability of the sample applied to establish the base calibration and of the broadly distributed reference materials, which can be obtained from the GME Secretariat (6), allows for reliable and comparable molar mass determination of collagen peptides.
References
(1) GPC/SEC Theory and Background, PSS e-book Series Part 1. https://pss-polymer.com/fileadmin/pdf/PSS_e-book_1_GPC_SEC_Theory_and_Background.pdf
(2) A.M. Striegel et al., Modern Size Exclusion Liquid Chromatography (John Wiley & Sons. Inc., Hoboken, New Jersey, 2nd Ed., 2009).
(3) W. Radke in Macromolecular Engineering, K.G. Matyjaszewski, Y.; Leibler, L., Eds. (Wiley-VCH: Weinheim, Germany, 2007). pp. 1881-1936.
(4) Z. Grubisic, P. Rempp, and H. Benoît, J. Polym. Sci., Part B: Polym. Lett. 5(9), 753–759 (1967).
(5) M. Haney, J. Appl. Polym. Sci. 30, 3037 (1985).
(6) GME Collagen Peptides Monograph, Final Version 1, Gelatine Manufacturers of Europe (2020), https://www.gelatine.org/fileadmin/user_upload/gme_content/GME_Statements/GME_CP_Monograph-version_1_-_public.pdf.
Friedhelm Gores, Wolfgang Radke, and Daniela Held are with PSS Polymer Standards Service GmbH, in Mainz, Germany. Direct correspondence to: wradke@pss-polymer.com

New Study Reviews Chromatography Methods for Flavonoid Analysis
April 21st 2025Flavonoids are widely used metabolites that carry out various functions in different industries, such as food and cosmetics. Detecting, separating, and quantifying them in fruit species can be a complicated process.
Analytical Challenges in Measuring Migration from Food Contact Materials
November 2nd 2015Food contact materials contain low molecular weight additives and processing aids which can migrate into foods leading to trace levels of contamination. Food safety is ensured through regulations, comprising compositional controls and migration limits, which present a significant analytical challenge to the food industry to ensure compliance and demonstrate due diligence. Of the various analytical approaches, LC-MS/MS has proved to be an essential tool in monitoring migration of target compounds into foods, and more sophisticated approaches such as LC-high resolution MS (Orbitrap) are being increasingly used for untargeted analysis to monitor non-intentionally added substances. This podcast will provide an overview to this area, illustrated with various applications showing current approaches being employed.
Characterizing Plant Polysaccharides Using Size-Exclusion Chromatography
April 4th 2025With green chemistry becoming more standardized, Leena Pitkänen of Aalto University analyzed how useful size-exclusion chromatography (SEC) and asymmetric flow field-flow fractionation (AF4) could be in characterizing plant polysaccharides.
Rethinking Chromatography Workflows with AI and Machine Learning
April 1st 2025Interest in applying artificial intelligence (AI) and machine learning (ML) to chromatography is greater than ever. In this article, we discuss data-related barriers to accomplishing this goal and how rethinking chromatography data systems can overcome them.
Influence of Concentration in Conventional GPC/SEC and Advanced Detection GPC/SEC
March 21st 2025Sample concentration is a parameter that can influence the quality of gel permeation chromatography/size-exclusion chromatography (GPC/SEC) separations and the obtained results. Understanding this influence can help to support the development of reliable GPC/SEC methods.

.png&w=3840&q=75)

.png&w=3840&q=75)


.png&w=3840&q=75)


.png&w=3840&q=75)


