Rapid Rinse and Shoot: A Screening Workflow for Pesticides in Fruit by GC–MS in Under Six Minutes Using Library Searching of Deconvoluted Spectra
A fast-screening workflow for residual pesticides present on the surface of fruits was enabled using a gas chromatography (GC) oven with direct heating technology and mass spectrometry (MS) spectral deconvolution. Residual pesticides were rinsed from the tested commodity surface with acetone. The rinsate was collected and injected into the GC–MS system. The direct heating oven allowed for a very high temperature program rate (250 oC/min) to complete the GC–MS analysis in 3.4 min. Spectral deconvolution coupled with the library search algorithm and time-filtering using retention indices resulted in rapid and confident identification of residual pesticides present on the fruit. The NIST 17 spectral library, as well as other commercially available and user created libraries, can be used for compound identification. The entire analysis from sample collection to reporting took under 6 min. This approach is particularly useful for prioritizing samples in high-throughput facilities for more in-depth analysis.
Trace-level pesticides and environmental pollutants in the food supply continue to be a worldwide concern, and drive demand for more rapid and reliable methods of analysis. Part of the challenge is finding technologies that can search for hundreds of pesticides, polyaromatic hydrocarbons (PAHs), and other targets with simple sample preparation and a quick turnaround time.
The targeted analytical methods commonly used in food safety analysis focus on a finite list of compounds. This approach typically utilizes gas and liquid chromatography coupled with triple quadrupole mass spectrometry (GC–MS/MS and LC–MS/MS) (1,2). While these techniques provide outstanding sensitivity, they are limited by their restricted scope of targets, which is problematic if the method includes several hundreds of pesticides. High resolution mass spectrometry (HRMS) techniques coupled with GC and LC would enable comprehensive sample screening (3). However, this approach typically requires high-resolution databases to analyze data against them. Such databases often include only a limited number of compounds, and creating an expert-curated library is a labor-intensive process. In addition, HRMS requires rather sophisticated and expensive instrumentation. An alternative screening approach utilizes GC coupled with a single quadrupole mass spectrometer (GC–MS) operated in full scan mode (4). To increase the confidence of identification with GC–MS, mass spectral deconvolution and time-filtering can be utilized. Time-filtering can be performed based on the retention times (tR) of the identified targets by comparing them to the library tR values. The disadvantage of tR-filtered search is its dependence on the flow path, column flow, and oven ramp rate. The use of linear retention indices (RI) makes the screening strategy much less dependent on these chromatographic conditions. Additionally, com- mercial libraries commonly include RI values rather than tR values. RI values for the identified compounds can be compared to the RI of the library entry. When the observed and the library RI values are close, the identification is confirmed with increased confidence. When the observed RI differs from the library entry value, the hit is removed from the list of identified compounds.
The screening approach described in this work utilizes GC–MS for a rapid (3.4-min) analysis of fruit rinsates, followed by compound identification, based on deconvoluted mass spectral search and time-filtering, using RIs for increased identification confidence. Acetone rinsates of fruit provided a qualitative estimate of residual foliar applied pesticides. The advantage of this sample collection technique is a high pesticide-to-matrix ratio compared to sample preparation techniques that include sample grinding and extraction. This approach can be successfully implemented for initial commodity triage. Any fruit for which the rinsate is found to contain compounds of concern can be further subjected to a comprehensive and quantitative sample preparation using the “quick, easy, cheap, effective, rugged, and safe” (QuEChERS) method, followed by targeted quantitative analysis performed with GC–MS operated in selected ion monitoring (SIM) mode or triple-quadruple GC–MS in multiple reaction monitoring (MRM) mode.
The entire triage workflow was performed in under 6 min, which included fruit rinsing, GC–MS analysis, data processing, and report generation. The unprecedented speed of GC–MS screening performed in 3.4 min was achieved with direct heating technology, which provides oven ramping at a rate of 250 °C/min.
As a demonstration of the utility of this approach, five types of fruits and berries (including strawberries, bananas, lemons, cherries, and peaches) were purchased in a local grocery store and a farm around Wilmington, Delaware, and subjected to analysis with the method.
Materials and Methods
Analysis
The analysis was performed using an Agilent Intuvo 9000 GC instrument equipped with a 7650A Automatic Liquid Sampler that was coupled with an Agilent 5977B MSD (Agilent Technologies). The GC–MSD system was configured to enable the shortest cycle time, avoid carryover, and maximize throughput. Figure 1 shows the system configuration used in this work, and the instrument operating parameters are summarized in Table I. The optimized chromatographic method included an HP-5MS UI column (10 m × 180 μm × 0.18 μm)(part number 19091S-571UI-INT) and the Intuvo Restrictor Module (part number G39093-63008), with temperature programming of 250 °C/min that enabled a 3.4 min run time. Helium flow rate was 0.75 mL/min and 1.25 mL/min through the column and the restrictor, respectively. The injection volume was set to 1 μL. A multimode inlet was set to 280 °C during the injection, and the temperature was increased to 350° in post-run to minimize carryover caused by residual sample matrix accumulated in the inlet. The multimode guard chip (G4587-60665) prevented high boiling matrix compounds from contaminating the head of the column, and was operated in the track oven mode.
FIGURE 1: System configuration.
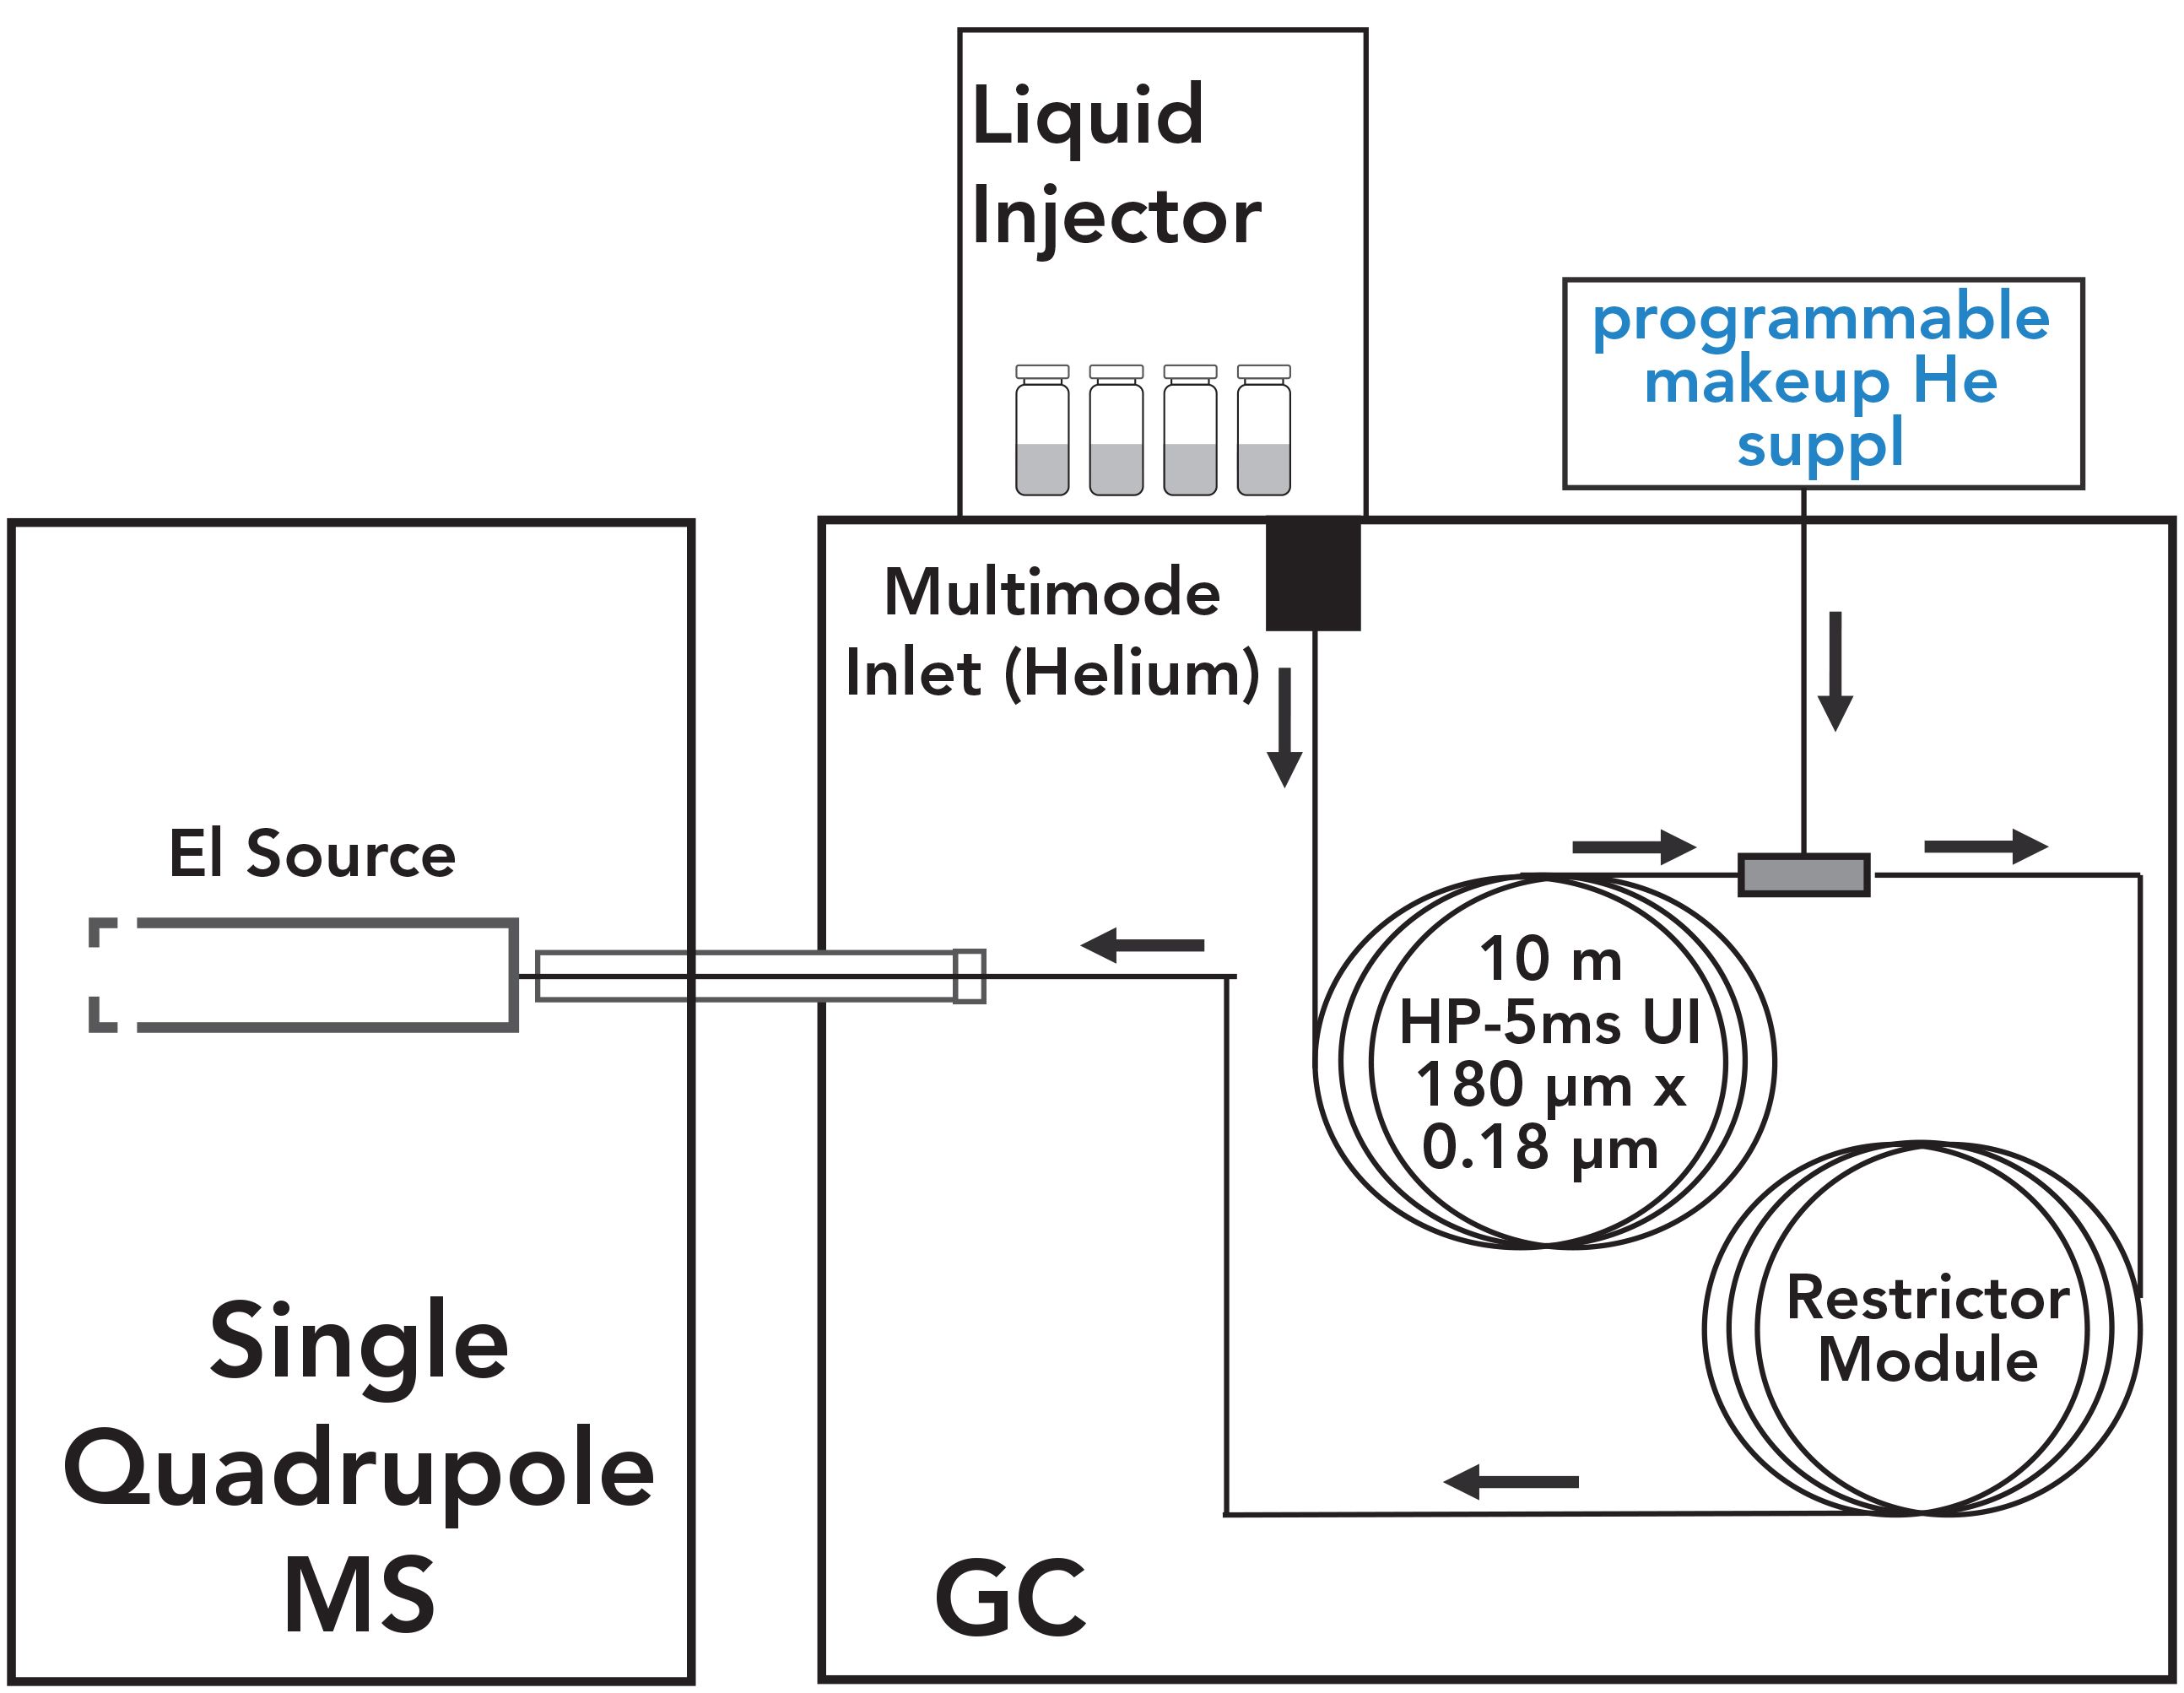
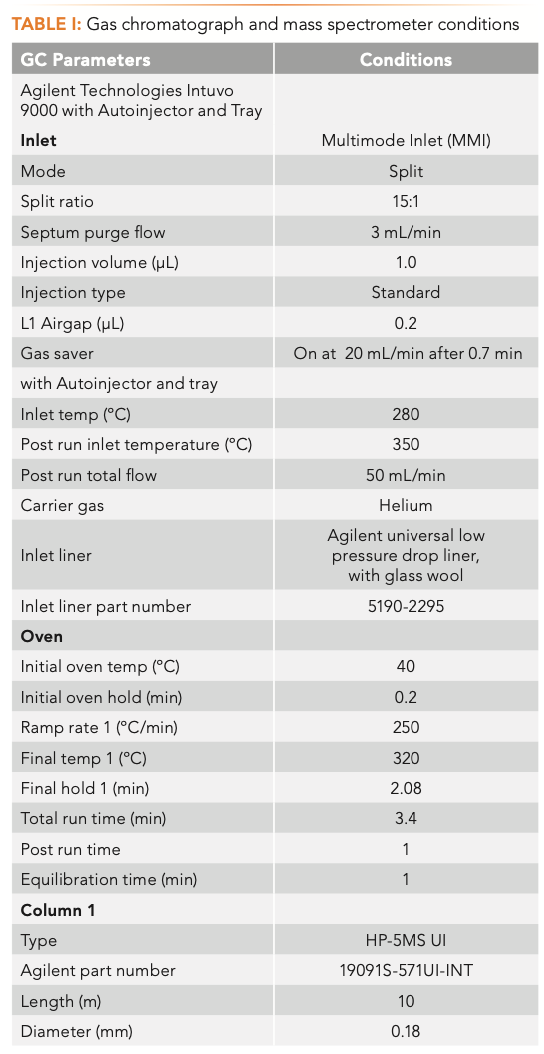
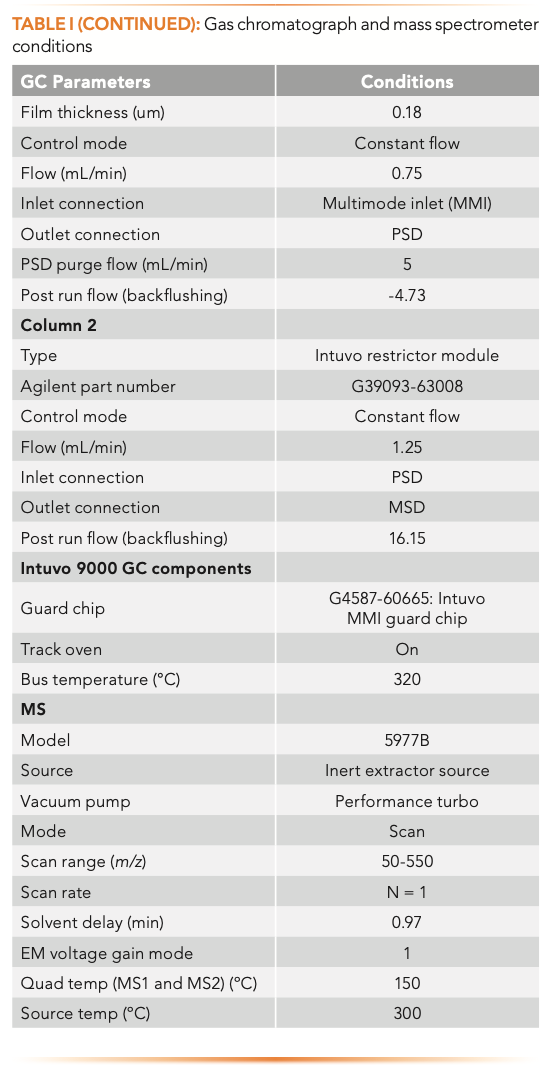
The GC system was configured for mid-column backflushing using the programmable makeup helium supply. A post-run backflush was initiated at 3.4 min after linear n-alkane C34 was eluted. There was no need to continue the chromatographic run past 3.4 min, because no pesticides were expected to be eluted beyond this time. However, heavier matrix components may still be on the GC column by the end of the analytical run. To eliminate carryover and the appearance of ghost peaks in subsequent runs, post-run backflush was initiated at 3.4 min by raising the pressure on the programmable makeup helium supply at the midpoint, thereby reversing the flow through the first column, and increasing the flow through the second column. The reversed flow carries any high boilers that were in the column and the guard chip at the end of data collection out into the split vent trap, thereby extending the life of the columns and the guard chip. For this configuration, the backflushing time was 1 min.
The bus temperature was set to 320 °C, and the MS EI source and MS quadrupole were heated to 300 °C and 150 °C, respectively. The mass spectrometer operated in full scan data acquisition mode (m/z 50−500).
MassHunter Quant 10.1 Unknowns Analysis (MH UA) software was used for data processing. The spectral deconvolution function provided an automated means of quickly identifying compounds, even in high matrix samples, in the presence of coeluted compounds using library match score (LMS). Time filtering using RI values increased compound identification accuracy. MH UA recalculated RI values observed for the component in the sample and RI values available in the library to tR values using tR calibration. The difference between the calculated tR values for the observed component and the library entry was listed in the report. Unlike tR, RI is independent of the flow path, and is applicable to a custom column configuration. Further details on the method setup can be found in the application note describing the screening workflow (5).
Sample Preparation
Five varieties of fruits and berries not labeled as organic, including strawberries, bananas, lemons, cherries, and peaches, were purchased at a local retail store and a farm in the Wilmington, Delaware, area. The tested fruit was placed into a glass funnel and rinsed with acetone (≥99.9% [dried basis], Honeywell Burdick & Jackson), using a 500 mL PTFE squeeze bottle. With bananas, lemons, and peaches, one piece of fruit was placed into the funnel. With strawberries and cherries, several berries were placed in the funnel to fill up 2/3 of the funnel volume. The rinsate was collected into a 4 mL amber vial until the vial was full. The funnel was rinsed on the inside with acetone between the samples.
RI Calibration with n-Alkanes
Commonly in chromatography, tR is a key parameter to aid analyte identification. However, tR depends on the GC flow path, column stationary phase, and dimensions, as well chromatographic conditions. Alternatively, relative tR can be used for analyte identification. Originally, relative tRs for isothermal GC separations known as Kovats Indices were used. Subsequently, the calculations of relative retention were adapted to apply to temperature-programmed GC separations and these values became known as linear retention indices (RI or LRI). RI works well for identifying compounds, as long as the oven temperature program is not complex, and the stationary phase type is the same as that used to collect the reference library RIs. Application of RI requires that an n-alkane mixture be run that covers the elution range of the analytes of interest (some practitioners use straight chain methyl- or ethyl-esters). In this work, the RI of the latest eluted pesticide in the pesticide library was under 3400, suggesting that RI calibration needed to be performed up to C34 linear n-alkane. A detailed workflow describing how to create RI calibration with MassHunter Quantitative Analysis is described in a technical brief (6). In this work, RI calibration was performed over the range of linear n-alkanes C9–C34 with a custom n-alkane standard (Ultra Scientific, Agilent Technologies Inc.), containing every linear n-alkane between C8 and C40. The concentration of several alkanes, including C13, C18, C22, C28, and C31, was twice that of other alkanes simplifying their identification.
Results
Figure 2 shows the scan total ion chromatogram (TIC) of a strawberry acetone rinsate. Although sample preparation via rinsing the surface decreased the amount of matrix introduced to the system compared to the conventional sample preparation techniques that involve sample grinding and extraction, it still brought over some matrix compounds, as seen in the scan TIC on the top of Figure 2.
FIGURE 2: (a) Screening results for strawberry rinsate identified against (b) the pesticide and (c) the NIST spectral libraries, featuring (d) identification of fludioxonil.
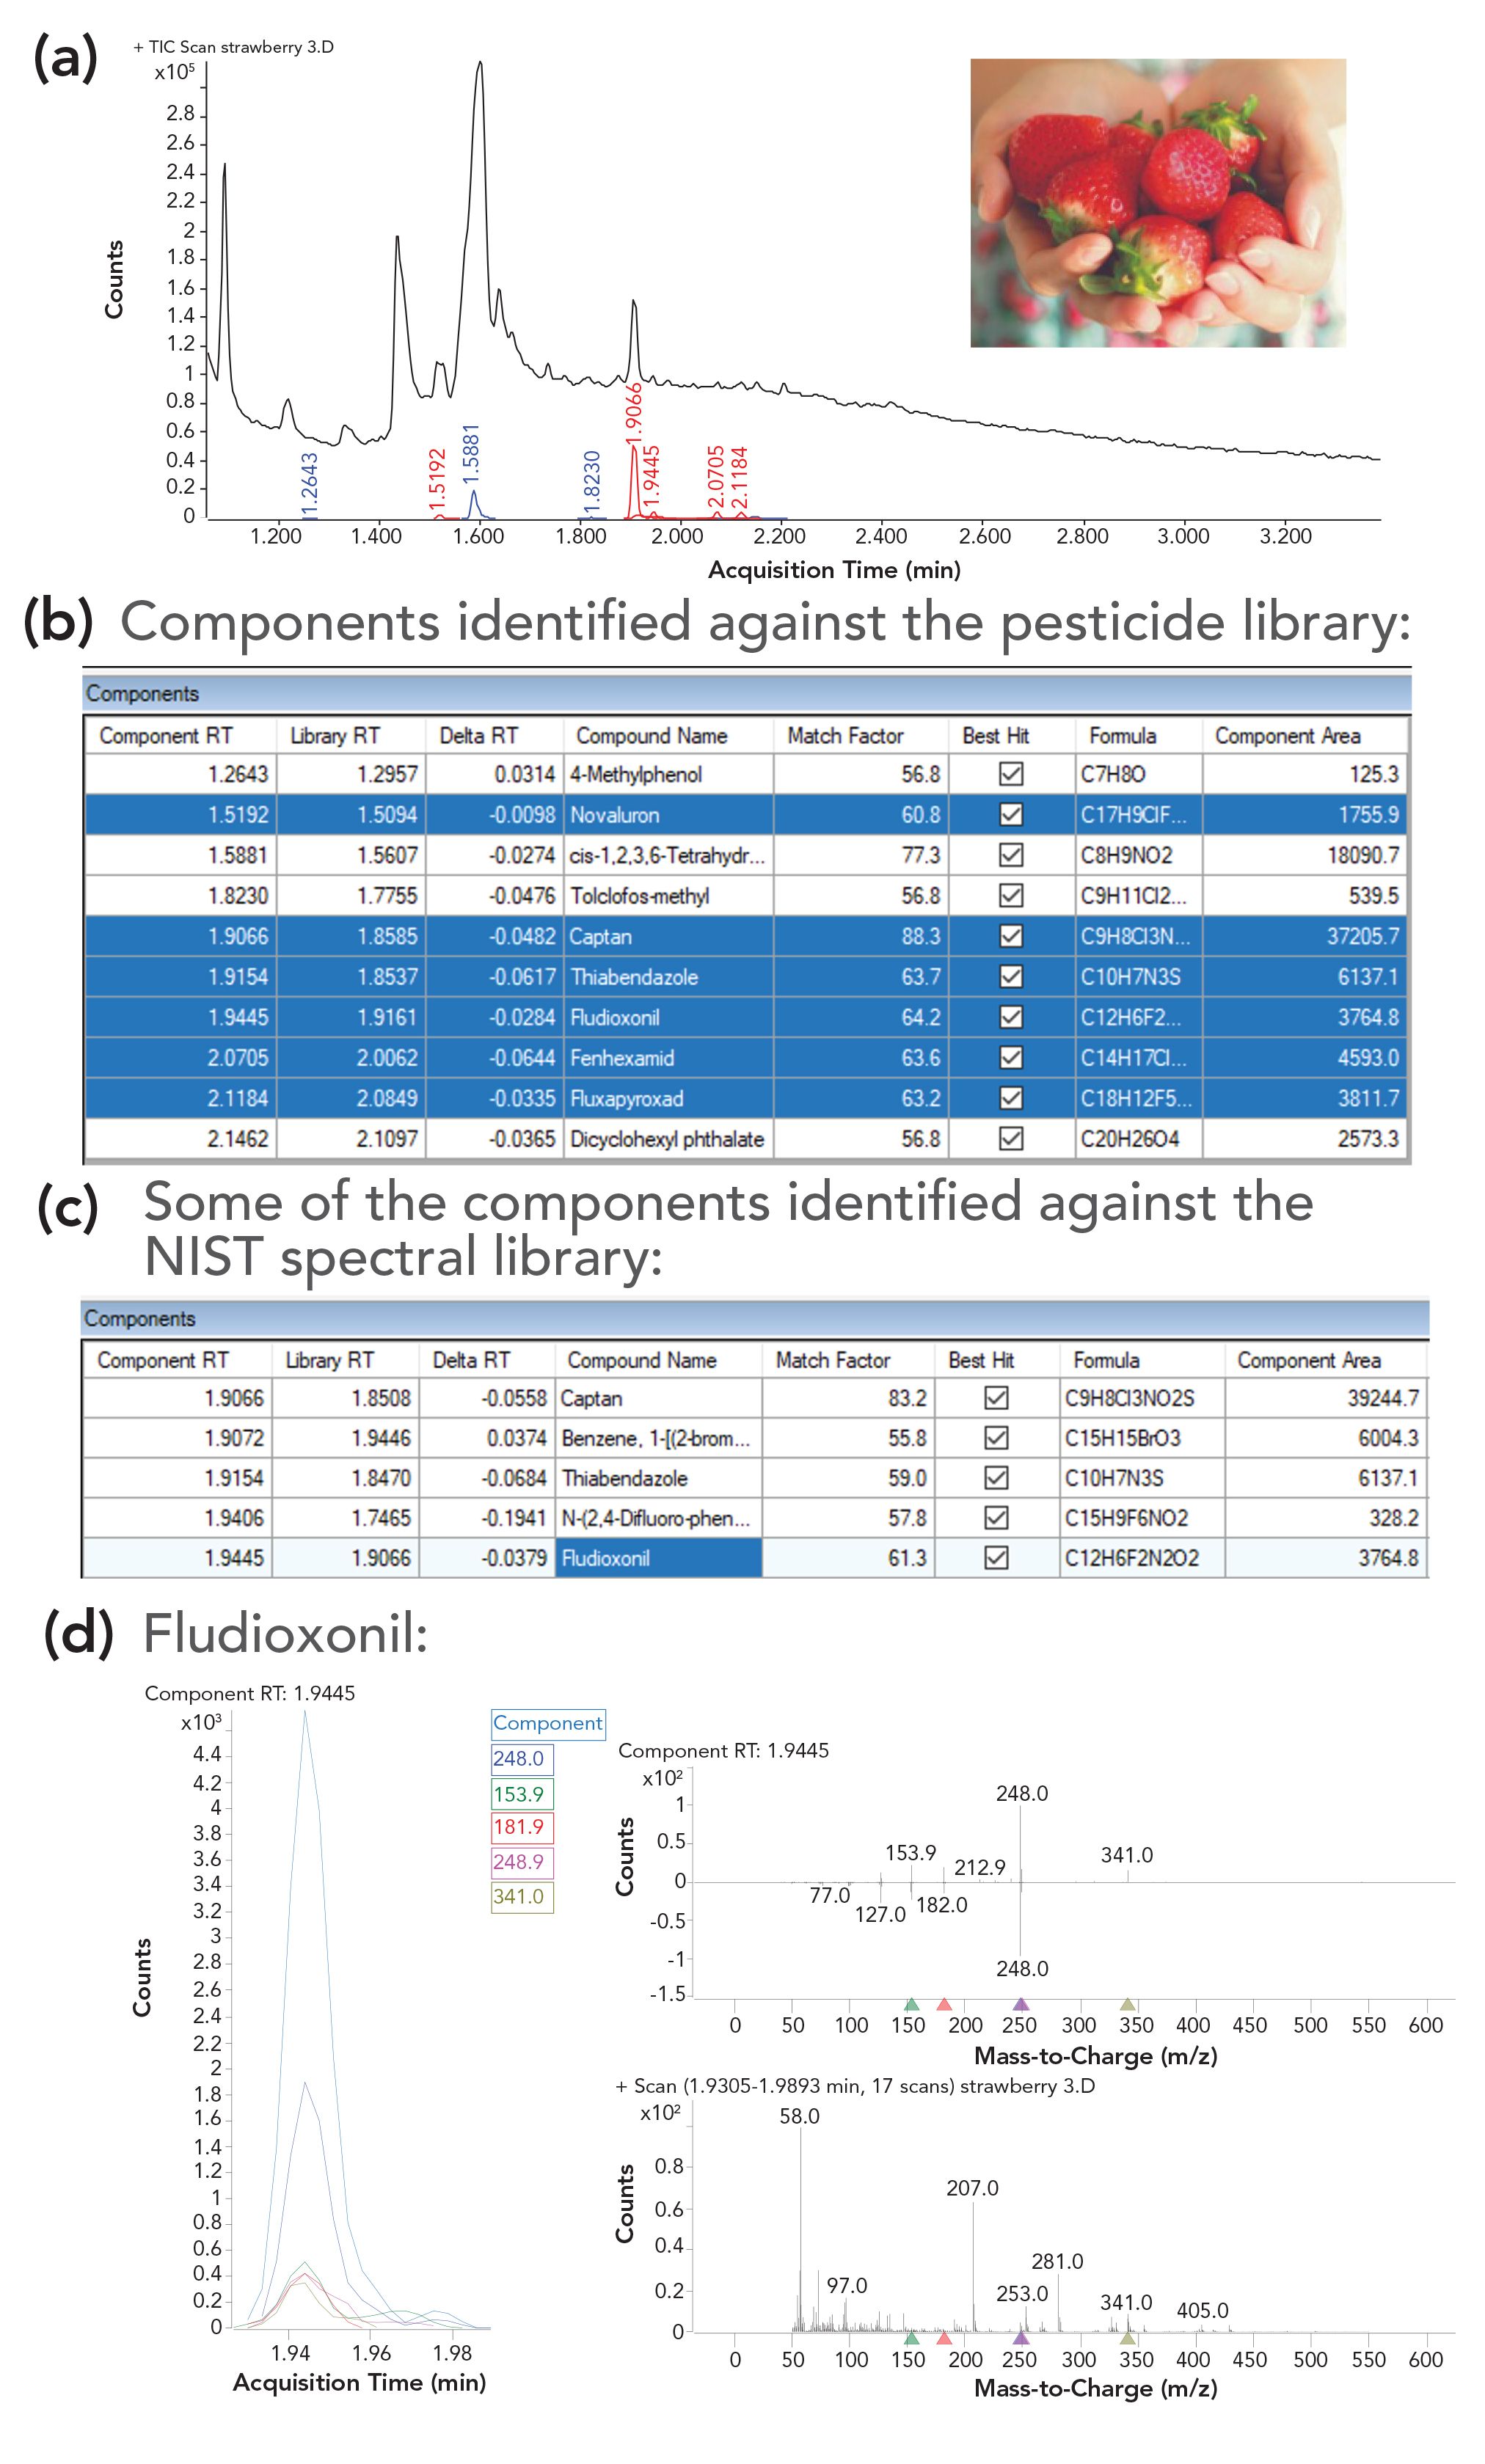
The scan file for the strawberry rinsate was then analyzed with the deconvoluted components searched against a custom pesticide library that included 1081 entries (spectra and RI) for pesticides and common environmental contaminants. The minimum library match score (LMS) was set to 55 and time filtering was enabled with an tR penalty-free range of ±12 sec. Ten compounds were identified against the library of pesticides and environmental contaminants in the strawberry rinsate that met the method criteria. The generated report summarizing the identified compounds is shown under the TIC in Figure 2. The peaks corresponding to the pesticides identified in the strawberry rinsate sample, and their retention times are labeled in red in the TIC on the top of Figure 2. These pesticides are highlighted in blue in the table underneath the TIC. Among the remaining identified compounds are environmental contaminants like dicyclohexyl phthalate, possibly from packaging, cis-1,2,3,6-tetrahydrophthalimide (a possible metabolite of captan), a fungicide, tolclofos-methyl, and a phenol derivative, 4-methylphenol of natural origin.
The pesticide library includes the information only on the compound RI, but not tR. RI calibration is used to calculate library tR using the RI, and compares the tR of the detected components with the library entries. The filtered hits are dis- played in the report. In Figure 2, only tR values are shown. If desired, RI values also can be displayed in the report.
As an example, one of the reported pesticides in Figure 2, fludioxonil, had a low LMS of 64.2. However, confidence in the identification was improved because of the small delta tR (-0.028 min), which is a difference between the observed tR and that calculated based on the library RI.
Additionally, ions present in the deconvoluted spectrum for fludioxonil were relatively unique, and matched those from the inverted library reference spectrum (Figure 2, mirror plot on the bottom right). The spectral deconvolution process had removed the interfering ions that appeared in the spectrum before deconvolution, producing an LMS of 64.2 that would not have been achieved for the raw spectrum. The alignment of extracted ion chromatograms for characteristic ions is shown on the bottom left in Figure 2.
The inspection process of the compounds reported in the sample is repeated for all the found hits to generate a list of compounds included in the final report. The decision as to what compounds to add to the report depends on several factors, including (but not limited to) LMS, uniqueness of the ions, tR match, and degree of concern for a specific compound. The component area item is also useful as an indication of the relative size of the response for the listed hit.
The custom mass spectral library with >1000 compounds that contains exclusively pesticide and environmental contaminants is convenient for screening, because the number of hits to be inspected is limited. However, there are cases when a much broader screen may be desired. The same approach can also be used to search the deconvoluted components against the NIST 17 library, which contains over 260,000 spectra. NIST 17 contains RIs experimentally determined on semi-standard non-polar columns of the type used here for many of the entries. The deconvoluted spectra of the components are searched through NIST 17 and the LMS for the identified components are shown in the report (the second table in Figure 2). To increase confidence of identification, time-filtering is performed using the algorithm described above. Briefly, the NIST RI values are automatically recalculated to tRs using the RI calibration. The tRs for the hits are compared to the calculated NIST tR values to enable time filtering. Although this is a very powerful tool, it searches all matrix components and can produce a very large list of hits to be inspected. For example, the screen of the strawberry rinsate produced 135 hits with LMS values > 55 when time filtering was applied. Time-filtering limited the number of compounds included in the report from 300 to 135. Reviewing the search results from NIST 17 with over 100 hits is more time consuming than that from the custom library.
The second table in Figure 2 shows a portion of the screen results from NIST 17 for the strawberry rinsate. The Library tR shown in the table is calculated based on the RI value from NIST 17 using RI calibration. The RI value from NIST 17 used for calculating the tR is either the experimental RI for the semi-standard non-polar phase if available, or a theoretical value calculated from molecular parameters. Note that the latter is of limited value, as the errors in the predicted RI can be quite large. Fludioxonil, a fungicide identified in the strawberry rinsate when searching against the pesticide library, was also identified against NIST 17 with a comparable LMS of 61.3 and a small tR delta of -0.038 min.
NIST search is useful for comprehensive screening to uncover unexpected compounds. It takes longer reviewing time, because of the large number of naturally occurring compounds from the matrix. Also, some compounds identified against the pesticide library may not be present in NIST 17 (for example, fluxapyroxad, which was found in the strawberry rinsate, is not included in NIST 17).
The NIST 17 screen can serve multiple purposes:
- Confirming identifications of compounds found with the pesticide library screen.
- Finding alternative identifications for the hits with questionable LMS values.
- Identifying chemicals not in the pesticide library that may be of concern.
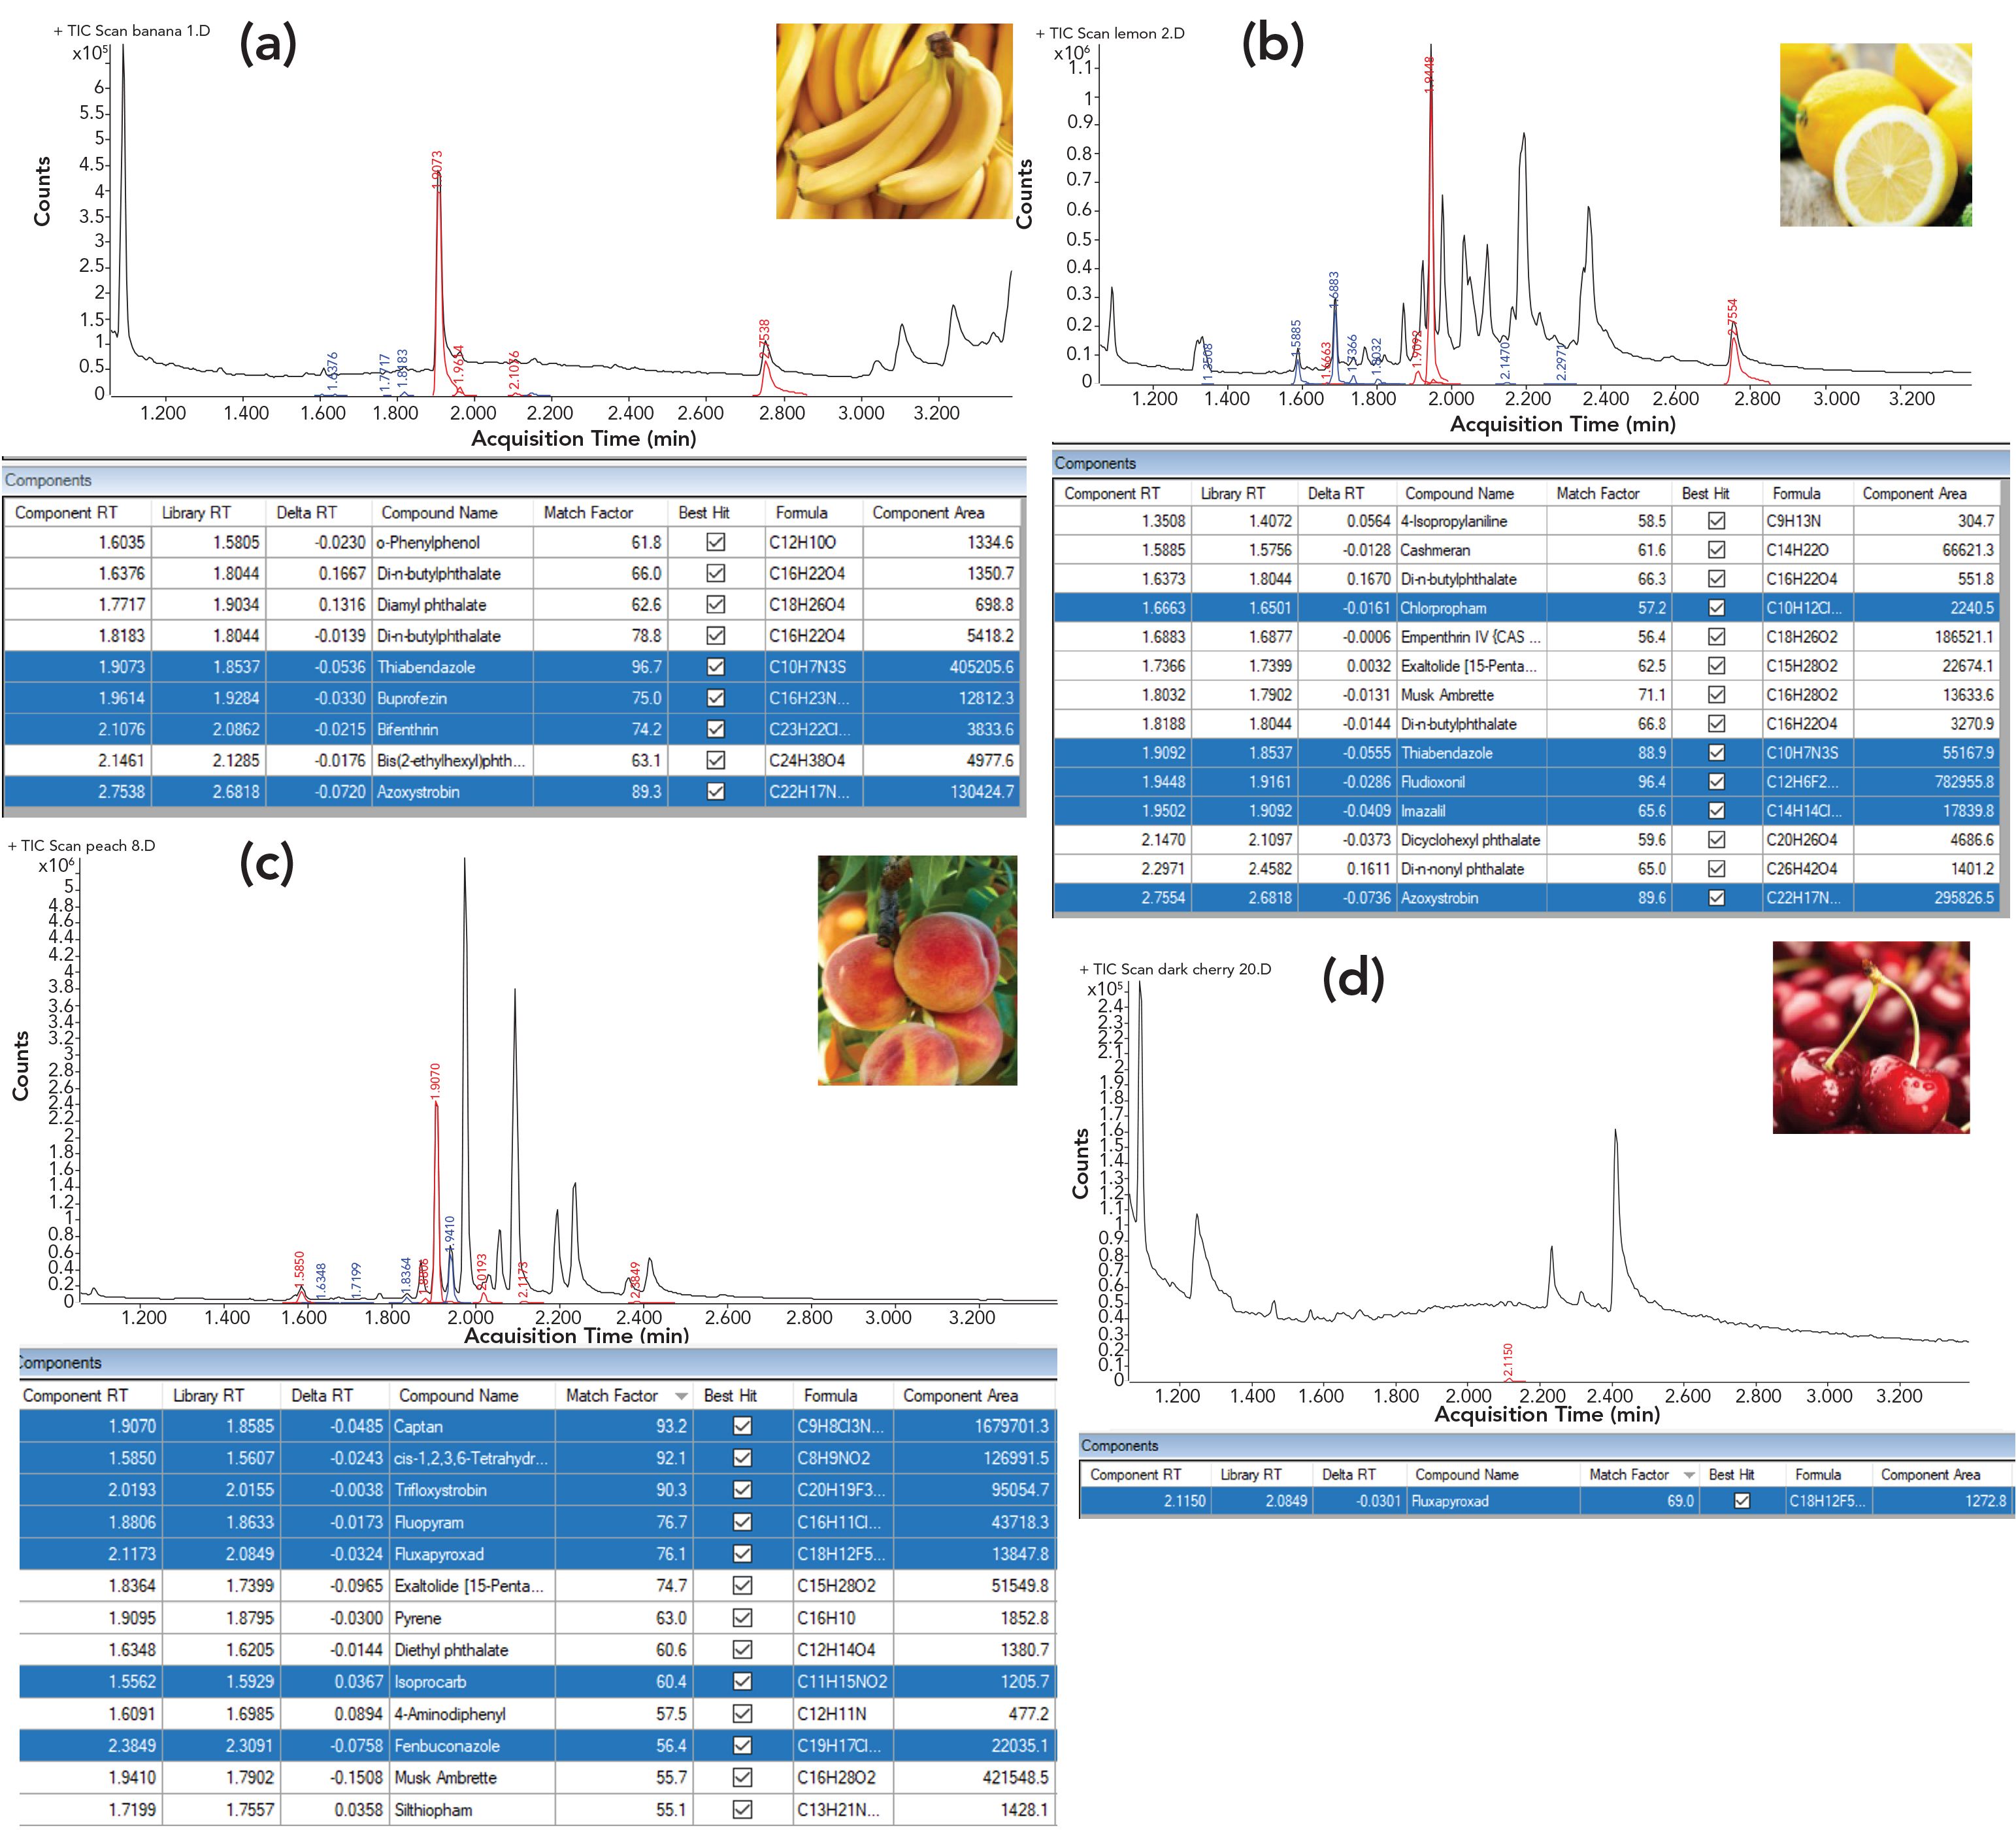
Other fruits and berries, including bananas, lemons, peaches, and cherries, were screened for pesticides and their rinsates were analyzed against the pesticide library. The results are shown in Figure 3, with the pesticides highlighted in the tables in blue. It is of note that various fruits resulted in different levels of matrix background in the scan TIC. Bananas and cherries showed lower backgrounds, whereas strawberries, lemons, and peaches produced a higher scan TIC. In some cases, base peaks in chromatograms were attributed to pesticides detected in acetone rinsates as a result of a favorable pesticides-to-matrix ratio, such as thiabendazole in bananas, fludioxonil in lemons, and captan in peaches.
FIGURE 3: Screening results for (a) banana, (b) lemon, (c) peach, and (d) cherry rinsates identified against the pesticide library.
With the hardware employed, the oven ramp rate can be lowered to yield a significant increase in a chromatographic resolution. For example, to more closely evaluate a screening result and increase confidence in compound identification, chromatographic and spectral interference can be reduced by using the slower oven ramp. Further details, and an example of the identity verification for compounds determined in peach rinsate, can be found in the application note describing the screening workflow (5). Additionally, the screening can be applicable to various contaminants monitored beyond the food and beverage industry. For example, the system configuration and work flow described in this work were used for rapid phthalate screening in plastics, as described in an application brief (7).
Conclusion
A rapid screening for pesticides and other contaminants found on the surface of fruits and berries was enabled using a GC oven with direct heating technology and MS spectral deconvolution, resulting in a 3.4-min analysis time with a total workflow time of under 6 min that includes sample preparation, analysis, data processing, and reporting. Rapid and reliable identification of pesticides was achieved by library searching of deconvoluted spectra coupled with time-filtering using RI values. Both user-created and the NIST 17 spectral libraries were used for com- pound identification. The screening workflow described herein should be useful for triaging samples in high-throughput facilities, such as receiving docks and distribution centers.
References
(1) M.C. da Silva, M.L.G. Oliveira, R. Augusti, and A.F. Faria, J. Agric. Food Chem. 67(1), 399–405 (2019).
(2) Z. Zhang, M. Feng, K. Zhu, L. Han, Y. Sapozhnikova, and S.J. Lehotay. J. Agric. Food Chem. 64(31), 6091–6099 (2016).
(3) Y. Pico, A.H. Alfarhan, and D. Barcelo. Trends Anal. Chem. 122, 115720 (2020).
(4) A. Andrianova, B. Quimby, J. Westland. Agilent Technologies Application Note, publication number 5994 0915EN (2019).
(5) A. Andrianova and B. Quimby, Agilent Technologies Application Note, publication number 5994 2077EN (2020).
(6) C. Sandy, I. Butler, and R. Sullivan, Agilent Technologies Technical Brief, publication number 5991-8221EN (2017).
(7) A. Andrianova and B. Quimby. Agilent Technologies Application Brief, publication number 5994 2727EN (2020).
Anastasia A. Andrianova is a GC/MS Applications Scientist at Agilent Technologies, in, Wilmington, Delaware. Bruce D. Quimby is a Senior GC/MS Applications Scientist at Agilent Technologies, in Wilmington, Delaware. Direct correspondence to: anastasia.andrianova@agilent.com

Analytical Challenges in Measuring Migration from Food Contact Materials
November 2nd 2015Food contact materials contain low molecular weight additives and processing aids which can migrate into foods leading to trace levels of contamination. Food safety is ensured through regulations, comprising compositional controls and migration limits, which present a significant analytical challenge to the food industry to ensure compliance and demonstrate due diligence. Of the various analytical approaches, LC-MS/MS has proved to be an essential tool in monitoring migration of target compounds into foods, and more sophisticated approaches such as LC-high resolution MS (Orbitrap) are being increasingly used for untargeted analysis to monitor non-intentionally added substances. This podcast will provide an overview to this area, illustrated with various applications showing current approaches being employed.


