An Excerpt from "Optimizing Gas Chromatography Using Column Dimensions"
Judicious initial choices of gas chromatography (GC) column dimensions, and even a change of column dimension during method development, can lead to significant improvements in resolution.
These tips will help you navigate choices about GC column dimensions to achieve significant improvements in resolution.
Optimizing gas chromatography (GC) separations typically involves making informed choices around stationary‐phase chemistry and column temperature programs. However, judicious initial choices of GC column dimensions, and even a change of column dimension during method development, can lead to significant improvements in resolution. Some knowledge of the relationships between resolution and column length, internal diameter, and film thickness can lead to the best column choice to begin method development or to get you out of trouble when your stationary‐phase chemistry choice or temperature program optimization do not produce the required results.
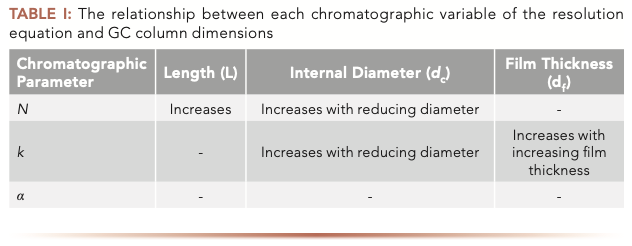
The primary relationships between resolution and column dimensions are outlined in equation 1 and Table I:

Efficiency (N) is a function of carrier gas type, column length (L), column internal diameter (dc). Retention factor (k) is a function of temperature, film thickness (df), and column internal diameter (dc). Selectivity (a) is a function of temperature (T) and stationary‐phase chemistry. So how can we relate the various GC column dimensions to resolution (Rs)? Combining equation 1 with the information in Table I, we can summarize the overall effects of column dimensions on chromatographic resolution using the following general relationships and caveats.
Column Length (L)
Doubling column length doubles efficiency (N), improving resolution by a factor of 1.4, and doubles analysis time (by ~1.5 to 1.75x for gradient‐temperature programming). It also increases column costs, and encourages the need to consider the effects of elution temperature with increasing column length; you may need to adjust the oven temperature program.

Column Internal Diameter (dc)
Column internal diameter (dc) affects efficiency, retention, carrier flow rate, capacity, and pressure drop across the column. It is inversely proportional to column efficiency— halve the column diameter, and double efficiency, increasing resolution by a factor of 1.4. Column head pressure is an inverse square function of column radius, so halving column diameter will increase head pressure (for an equivalent linear velocity) by a factor of 4. Column capacity increases with column internal diameter; however, capacity is also dependent on the stationary‐phase type, film thickness, and the nature of the analytes.
Stationary-Phase Film Thickness (df)
Stationary‐phase film thickness affects retention, inertness, capacity, resolution, and bleed. It is directly proportional to retention time (or a ratio of 1.5:1 for gradient temperature programming). Thick stationary‐phase films give retention for highly volatile analytes. Increasing film thickness allows retention of volatile analytes at temperatures at or above ambient. Doubling stationary‐phase film thickness gives an increase of ~20 °C in elution temperature. Retention of late eluted (high boil‐ ing point) analytes is reduced using thinner film columns. Early eluted analytes (k < 2) are better resolved using thicker‐film columns. Resolution may decrease for analytes with retention factor (k) values greater than ~5 with increasing film thickness. Thicker films bleed more; upper temperature limits of thick film columns will be lower. Thicker‐film columns are more inert because the film shields the analyte from active sites on the silica tubing (therefore, better peak shape for polar and active compounds). Thicker film columns have higher analyte capacity, and so may reduce peak fronting.
This is an excerpt of a blog entry with the same title. See the full blog entry on our website (www.chromatographyonline.com) for real-life examples to illustrate these points.

New Study Reviews Chromatography Methods for Flavonoid Analysis
April 21st 2025Flavonoids are widely used metabolites that carry out various functions in different industries, such as food and cosmetics. Detecting, separating, and quantifying them in fruit species can be a complicated process.
University of Rouen-Normandy Scientists Explore Eco-Friendly Sampling Approach for GC-HRMS
April 17th 2025Root exudates—substances secreted by living plant roots—are challenging to sample, as they are typically extracted using artificial devices and can vary widely in both quantity and composition across plant species.
Sorbonne Researchers Develop Miniaturized GC Detector for VOC Analysis
April 16th 2025A team of scientists from the Paris university developed and optimized MAVERIC, a miniaturized and autonomous gas chromatography (GC) system coupled to a nano-gravimetric detector (NGD) based on a NEMS (nano-electromechanical-system) resonator.

.png&w=3840&q=75)

.png&w=3840&q=75)


.png&w=3840&q=75)


.png&w=3840&q=75)


