Ionization Efficiency for Environmentally Relevant Compounds Using Atmospheric Pressure Photoionization Versus Electrospray Ionization (ESI)
Atmospheric pressure photoionization (APPI) and electrospray ionization (ESI) are compared for the mass spectrometry (MS) quantitation of pharmaceuticals frequently detected in environmental waters, including antibiotics, beta blockers, and selective-serotonin reuptake inhibitors.
For solution-phase samples, the world of mass spectrometry defaults to electrospray ionization (ESI). ESI is used for the analysis of a broad variety of compounds, ranging from polar to moderately nonpolar. However, ESI possesses limitations that prevent the ionization of certain analytes—particularly nonpolar compounds. This study aims to compare the ionization efficiency of complementary ionization techniques, and to demonstrate that multiple methods can improve the analytical results with respect to limits of detection and matrix tolerance. Atmospheric pressure photoionization (APPI) is an ionization method that complements ESI, excelling in the analysis of nonpolar and moderately polar analytes. In this study, we optimized methods using APPI and ESI for the detection and quantitation of pharmaceuticals frequently detected in the environment, including antibiotics, beta blockers, and selective-serotonin reuptake inhibitors, and tested their matrix tolerance relative to artificial wastewater. While most of these compounds ionized preferentially by ESI, some performed significantly better using APPI.
Every day, in the world of analytical chemistry, we strive to discover better ways to analyze, to achieve goals such as lower limits of detection, broader dynamic ranges, and techniques that tolerate greater interferences. Along with the need for improved methods of quantitation, there is pressure on the field of mass spectrometry (MS) to be able to successfully detect multitudes of analytes of interest from single injections. The question becomes, “How do we improve upon the detection of analytes?” However, sometimes using a single injection leads to reducing performance because it limits us to using a single ionization method. When you can optimize not only your separation, but also your ionization method, your method may truly improve. The basic principle of MS is to ionize molecules under study into gaseous ions, separate these ions in accordance with their mass-to-charge (m/z) ratio, and detect them (1). Today’s commercial instruments are capable of transferring 97–99% of ions successfully from the source to the detector, so the greatest improvements in detection and methods today are focused on the source. The ultimate question is, “When ionizing a sample, will the use of complementary ionization techniques improve the figures of merit of the individual analyses, or not?”
ESI and APPI: Complementary Ionization Techniques
By choosing the appropriate ionization source, liquid chromatography with tandem mass spectrometry (LC–MS/MS) can be used for the detection of trace levels of contaminants, such as antibiotics and endocrine disrupting compounds (EDCs) from environmental samples. The electrospray ionization (ESI) source has been used as a powerful soft ionization technique for the analysis by MS of a wide array of sample types, ranging from polar to nonpolar, and has also be used for the analysis of thermolabile molecules of high molecular weight (MW) (2). Although ESI is popularly used for the analysis of environmental pollutants, it may not be able to ionize all contaminants efficiently. Certain contaminants are either poorly ionized, or not ionized at all. ESI is limited to analytes that are of low to high polarity and moderate to high MW (3).
Atmospheric pressure photoionization (APPI), introduced in 2000, is also a soft ionization technique. APPI was found to have success with the analysis of compounds with low to no polarity, and compounds of low to moderate MW, but cannot be used on thermolabile compounds. These parameters are what makes APPI and ESI complementary to each other (4). This complementarity opens new doors for studies already utilizing the ESI method, because APPI can be used for complementary analysis of compounds that may not be detected by ESI. Additionally, APPI has shown tolerance to matrix components beyond what ESI has, due to its ionization pathway (5). APPI can be used for the analysis of a wide range of compounds, including drugs, human endogenous compounds, lipids, natural compounds, pesticides, synthetic organics, and petroleum derivatives (6). There are very few research papers reporting comparative studies of ionization efficiencies in MS for the detection of antibiotics and EDCs (7–9).
A triple-quadrupole mass analyzer was used in this study, utilizing both the full- scan mode optimization and multiple-reaction monitoring (MRM) quantitation. Full-scan mode can give qualitative analysis of a sample’s composition under study, and MRM mode is a highly selective mass monitoring mode with a wider linearity dynamic range, improved limit of quantitation (LOQ), increased sensitivity, and superior accuracy. One of the advantages of the MRM scan mode is an increase in signal-to-noise ratio because of removal of non-analyte ions and isobaric precursors by monitoring fragments.
There are different MS acquisition parameters that affect the signal intensity of ions. The MassHunter Data Acquisition software sets a default value for all acquisition parameters for each ionization source (S1).
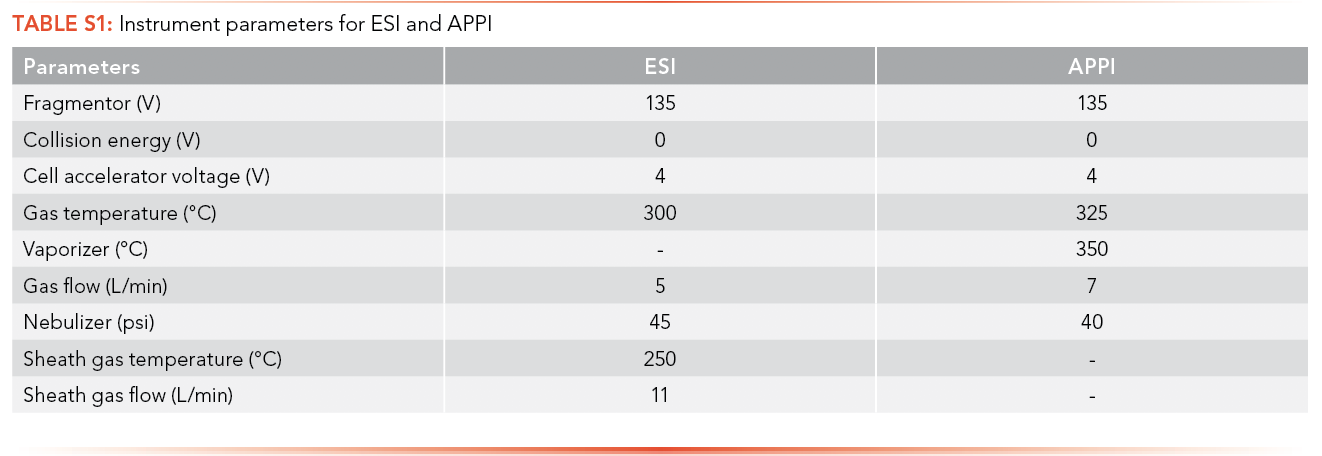
There is a sheath gas flow chamber in the electrospray ionization source that is absent in the atmospheric pressure photoionization source. As a result, the sheath gas temperature and sheath gas flow rate parameters are present only for ESI while APPI has an additional vaporizer parameter that is not present in ESI. Fragmentor voltage, collision energy, cell accelerator voltage, gas temperature, vaporizer, gas flow (L/min), nebulizer (psi), sheath gas temperature, and sheath gas flow rate were all optimized for each analyte prior to data acquisition in this study.
Analytes of Interest
The current global population is growing at the annual rate of 1.09%, and pharmaceuticals are continuing to be prescribed and consumed at an alarming rate. In 76 countries across the globe, antibiotic consumption as described in defined daily doses (DDD) increased by 65%—from 21.1 billion doses in 2000 to 34.8 billion doses in 2015—and the overall antibiotic consumption rate has increased by 39% (10). In addition to antibiotics, beta blockers and antidepressants are two classes of pharmaceuticals gaining popularity. Beta blockers are a class of drugs frequently used to treat hypertension, heart disease, and other cardiovascular events. Although the true nature of their efficacy remains to be questioned in certain studies, beta blockers are still highly prescribed due to the diverse range of clinical symptoms they can successfully treat (11,12). In addition, according to 2017 data from the National Center for Health Statistics (NCHS), the rate of antidepressant use in America has increased by 65% since 1999 (13). Unfortunately, this increase in pharmaceutical use means more pharmaceutical waste is likely to end up in the environment. While there is an urgency to know the exact harm this excess will cause, the priority is to increase our ability to detect as many pharmaceuticals in environmental samples as possible. This will then allow for proper removal techniques to be employed before the harmful substances have a chance to contaminate the environment (14).
Low Concentrations, Large Impact
Numerous studies have shown that some pharmaceuticals are not completely removed during wastewater treatment, and ultimately enter the environment in low concentrations. Important effects of pharmaceuticals entering the environment in low concentrations include antibiotic resistance, genotoxicity, acute or chronic toxicity, and endocrine disruption (15). Antibiotics and EDCs are emerging pollutants detected throughout the world, yet they remain unregulated by the U.S. Environmental Protection Agency (EPA) (16).
Sir Alexander Fleming, the British bacteriologist, discovered penicillin in 1928 from the fungus Penicillium notatum, spurring a novel era of antibiotics derived from microorganisms and antibiotic synthesis (17). The ability antibiotics have to eradicate a wide range of bacterial infections led to their increased use over time. Unfortunately, these bacteria have developed mechanisms to combat the actions of antibiotics. Thus, the over-prescribing of antibiotics, along with a lack of patient knowledge regarding the importance of correct antibiotic administration, has become an insidious issue that is known as antibiotic resistance. Antibiotic resistance arises as microorganisms develop the ability to survive against the action of antibiotics, meaning that when antibiotic-resistant bacteria infect animals and humans, the antibiotic regimen that would normally eradicate the bacteria becomes useless. This is the reason being able to successfully detect antibiotics from wastewater samples is so important. In this study, five different classes of antibiotics were used: beta-lactams, macrolides, nitroimidazoles, sulfonamides, and tetracyclines.
Antibiotics can either be bacteriostatic, meaning they prevent the growth of bacteria, or they can be bactericidal, meaning that they destroy the bacteria entirely. However, an antibiotic’s mechanism of action is more important when considering treatment options. Beta-lactams inhibit the biosynthesis of bacterial cell walls by making penicillin-binding proteins unavailable for new peptidoglycan synthesis, which causes the lysing of bacteria. The beta-lactams used in this study are ampicillin, ceftriaxone, cephalexin, and penicillin G. Macrolides inhibit protein synthesis during translocation in bacteria by dissociating peptidyl-tRNA from the middle of the 23S rRNA of the ribosome’s 50S subunit, causing early detachment of unfinished peptide chains. The macrolides used in this study are erythromycin and tylosin, an antibiotic popularly used in farm animals. Tetracyclines prevent the attachment of aminoacyl t-RNA to the A site in bacterial ribosomes by acting on the 16S rRNA of the 30S subunit inhibiting protein synthesis. Oxytetracycline and tetracycline were used in this study. Sulfonamides prevent the multiplication and growth of bacteria by inhibiting certain steps in the metabolism of folic acid. Sulfamethoxazole and trimethoprim were the sulfonamides used in this study. Nitroimidazole antibiotics inhibit nucleic acid synthesis that occurs in bacterial cells by disruption of the DNA in microorganisms. Metronidazole and 1,2 dimethyl-5-nitroimidazole were the nitro- imidazoles used in this study (18).
EDCs are natural compounds or synthetic chemicals that mimic natural hormones in the body and interfere with the action of the natural hormones (19). These compounds most profoundly cause adverse effects on reproduction, developmental, neural, and immune systems of human beings and animals. Research suggests that EDCs reduce fertility, and increase the risk of cancer, diabetes, obesity, and endometriosis (20). Among various EDCs, beta blockers (acebutolol, atenolol, metoprolol and propranolol) and SSRI antidepressants (citalopram, paroxetine and venlafaxine) were used in this study.
Make or Break for Successful Analysis: Matrix Effects and Wastewater
Properly dealing with impurities is a necessary complication in every field of research. In MS, matrix effects variability in ionization efficiency of analytes of interest as co-eluted species serve to either enhance or inhibit the ionization process for an analyte. This issue becomes increasingly problematic when trying to discern analytes of interest from wastewater. Water that is obtained as a byproduct of agricultural, industrial, domestic, and commercial activity is termed wastewater. Wastewater contains nutrients such as calcium, iron, nitrogen, phosphorus, and potassium, and components such as fats, sugars, and proteins. In this study, synthetic wastewater was made to mimic the wastewater from the influent of a “typical” wastewater treatment plant, with its composition designed to imitate the dissolved inorganic solids and dissolved organic solids of real wastewater. The synthetic wastewater prepared in this study followed the protocol described by H. E. Gray, 2012 (21).
APPI has been found to be less susceptible to matrix effects compared to ESI. This is likely due to the fact that APPI is more selective in ionization. The photon emitted from the krypton lamp, at 10.6 eV, can ionize analytes, but potentially not the matrix components; the difference in how a sample is ionized can be the difference between more or less matrix interference (22). Using APPI involves the ejection of an electron from the analyte molecule to produce the gaseous radical cation (23). It is also possible, however, that the matrix component can act as a dopant and ionize sample components with high ionization energy through electron transfer, leading to signal enhancement.
Although matrix effects cannot be removed completely, they can be minimized by optimizing the sample preparation procedure and LC–MS parameters. Solid-phase extraction (SPE) with an appropriate sorbent can reduce matrix effects by eliminating interfering matrices. The formula for calculation of the matrix effect is:

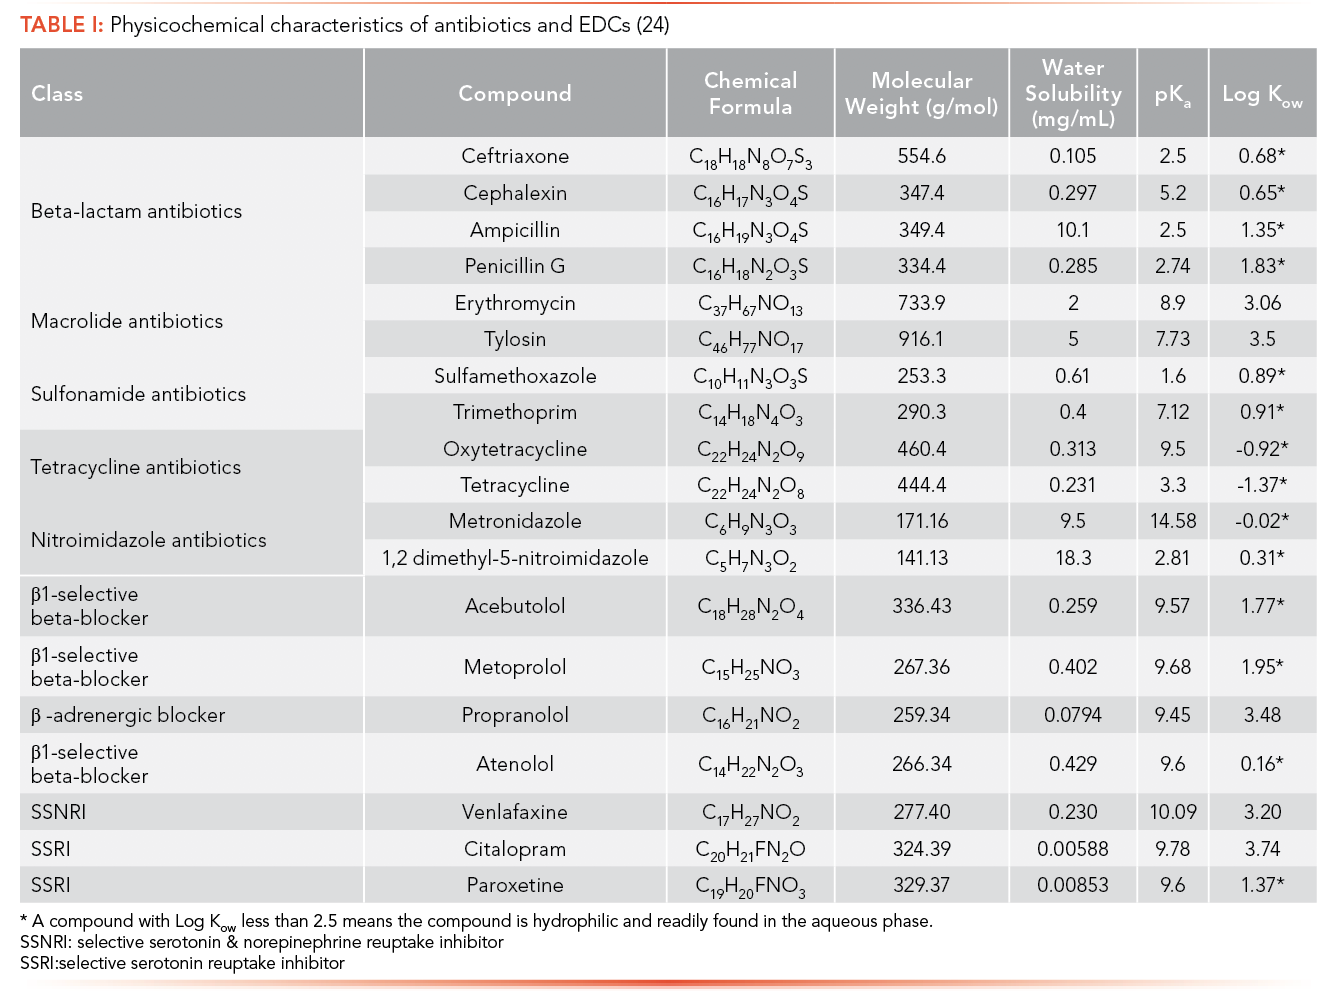
Physicochemical characteristics of anti- biotics and EDCs help to determine the environmental fate of these compounds. Table I contains important physicochemical characteristics of antibiotics and EDCs under study, including solubility, pKa, and log Kow. A compound with log Kow less than 2.5 means the compound is hydrophilic and readily found in the aqueous phase.
Methods
Specific Analytes Used
A total of 12 antibiotics and 7 EDCs were analyzed in this study. Ceftriaxone sodium salt hemi(heptahydrate) and erythromycin with a purity of >98% were purchased from Acros Organics. Propranolol hydrochloride (99%), metronidazole (99%), acebutolol hydrochloride, metoprolol tartrate (98%), tetracycline hydrochloride (96%) and oxytetracycline hydrochloride were purchased from Alfa Aesar. TCI Co. was the main supplier of chemicals: cephalexin monohydrate (>98%), sulfamethoxazole (>98%), penicillin G potassium salt (>98%), atenolol (98%), venlafaxine hydrochloride (>98%), trimethoprim (>98%), citalopram hydrobromide (>98%) and 1,2 dimethyl-5-nitroimidazole. Ampicillin sodium salt was procured from Affymetrix Inc. Tylosin tartrate (95+%) and paroxetine hydrochloride (98+%) were bought from Ark Pharm Inc. All antibiotics and EDCs were used without further purification. All the solvents used in the analysis, like acetonitrile, methanol, and toluene, are of HPLC grade and purchased from Fisher Chemical. Potassium phosphate monobasic (99.8%) was purchased from EK Industries Inc. Sodium acetate trihydrate (100.7%), magnesium sulfate heptahydrate (99.9%), ammonium chloride (99.7%) and calcium chloride dihydrate (99.9%) were bought from Fisher Scientific. All solvents and chemicals were used without further purification.
Optimized Parameters
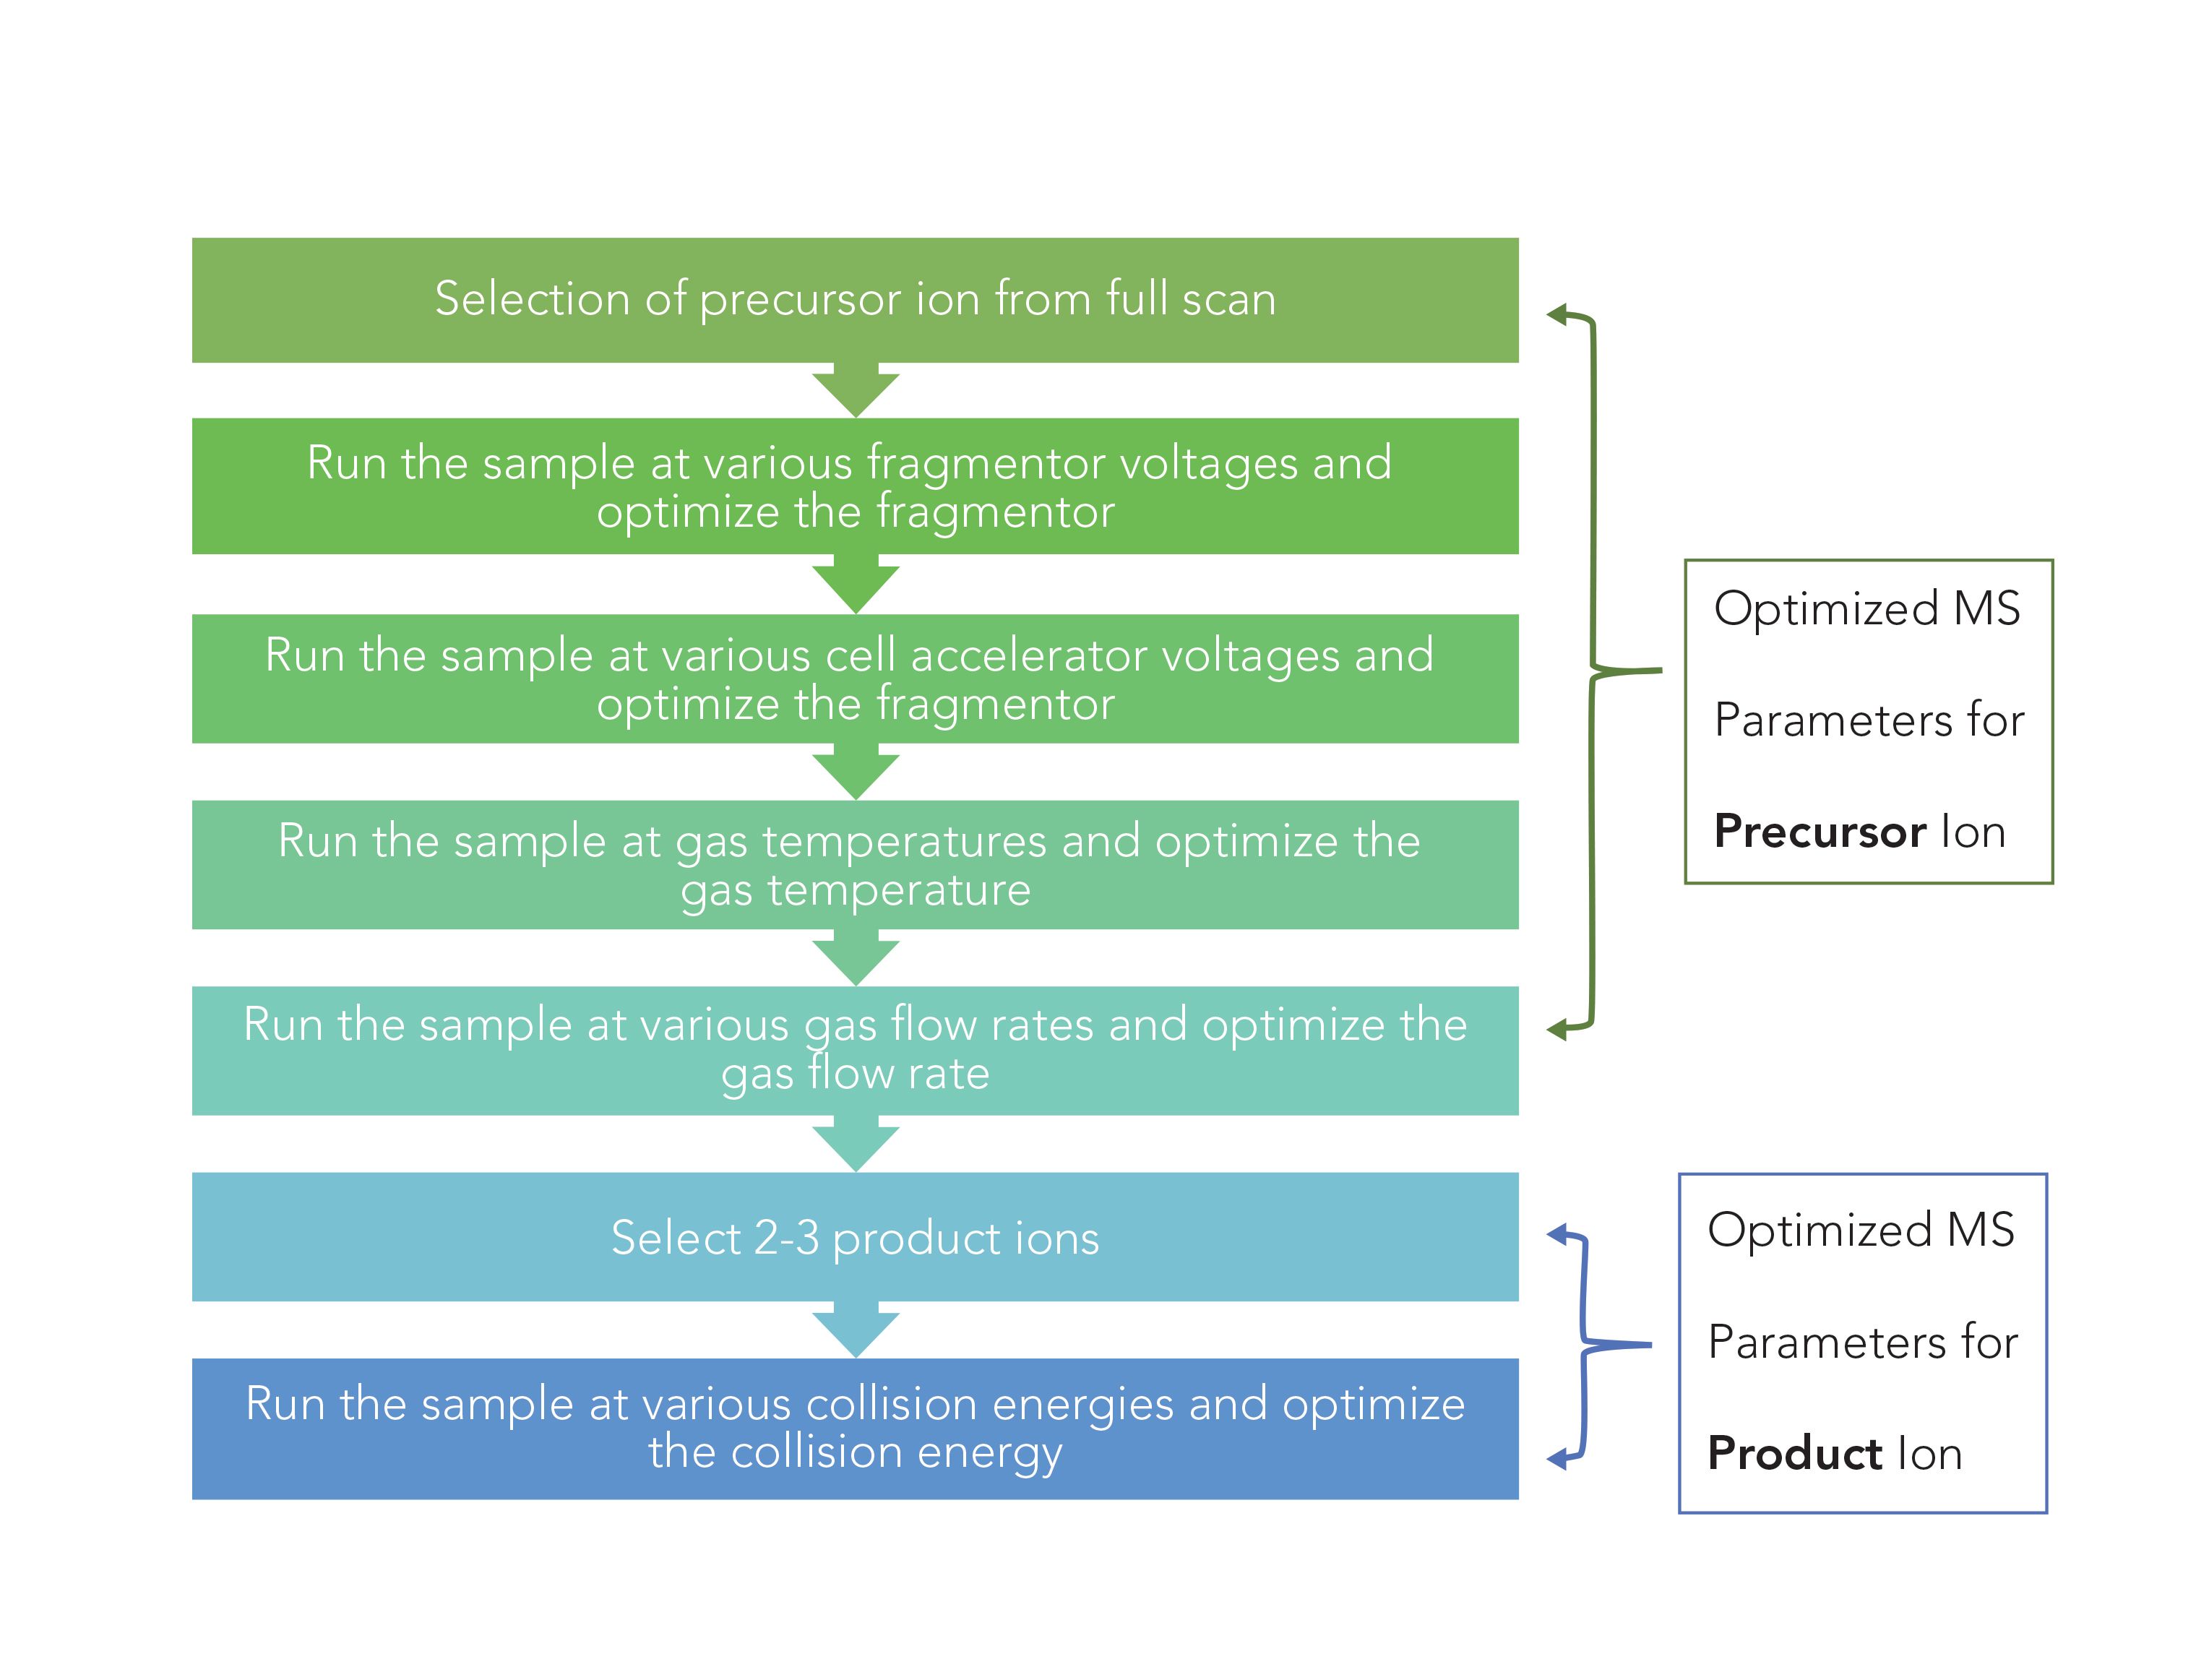
The MS parameters were optimized as follows: 1.00 ppm sample of each analyte was analyzed for the selection of the precursor ion, optimization of fragmentor voltage, optimization of cell accelerator voltage, optimization of gas temperature, optimization of gas flow rate, and optimization of collision energy. All the ions formed were analyzed for intensity. Ions with m/z equal to and greater than the MW of each analyte were considered to determine the precursor ion. See Figure 1 for the flowchart of optimization strategy.
FIGURE 1: Flow chart of method optimization strategy.
A calibration curve for each analyte was obtained by the internal calibration method using the optimized MS parameters. Calibration was performed in the range of 1.00 ppt to 10.0 ppm for each analyte under study. Each of the standard solutions for antibiotics was spiked with the mixture of internal standards of antibiotics (azithromycin d3, cephalexin d5, ciprofloxacin d8, penicillin G d5, sulfamethoxazole d4, and trimethoprim d3) to produce a final concentration of 100 ppb of each internal standard. Each of the standard solutions for EDCs was spiked with the mixture of internal standards of EDCs (metoprolol d7 and paroxetine d6) to produce a final concentration of 10.0 ppb of each internal standard.
A synthetic wastewater matrix solution was prepared by dissolving potassium phosphate monobasic, sodium acetate trihydrate, magnesium sulfate heptahydrate, ammonium chloride, and calcium chloride dihydrate in MilliQ water. The concentration and quantity of reagents used for synthetic wastewater matrix preparation is given in S2.

Analysis of the antibiotics and EDCs was performed in triplicate for each parameter using an Agilent Technologies 1290-6460 Triple Quadrupole LC–MS/MS instrument using two ionization sources: a Jet Spray ESI source and an APPI source operated in positive mode. Full-scan mode was used for the optimization of MS parameters and MRM mode was used for calibration and analysis of wastewater. Data interpretation was performed using the instrument’s MassHunter Workstation Software. HPLC parameters for analysis are given in S3.

Calibration was performed in the range of 1.00 ppt to 10.0 ppm in matrix for all the analytes under study. Internal standards were added as described previously. Limits of quantitation were calculated based on the quadratic regression lines and were calculated in the instrument software. LOQs lower than 1.00 ppt were reported as <1.00 ppt as they were below the lowest calibrator.
A setup of Waters Oasis Prime HLB cartridges and a SPE vacuum manifold was used for offline SPE to extract antibiotics and EDCs from the synthetic wastewater matrix calibration sample. Waters Oasis PRIME HLB cartridges, 1 mL barrel syringe with 30 mg universal polymeric reversed-phase sorbent, were employed. SPE pretreatment was performed by washing the column with 2 mL of HPLC grade methanol, 2 mL of Millipore deionized water, and 2 mL of Millipore deionized water at pH 2 under gravity. Then the samples were loaded on the column under vacuum at 10 to 20 mL/min rate.
Washing and Elution Step for Antibiotics Sample
After loading the sample on the column, the cartridge was washed with 2 mL Millipore deionized water for antibiotic sample. The column was then eluted first with 2 mL of methanol, and then with 1 mL of methanol: acetone (1:1) under gravity and collected and combined in test tubes.
Washing and Elution Step for EDCs Sample
EDCs sample cartridges were washed with 1 mL of methanol:water (5:95) solvent. After the first washing step, the column was dried for 15 to 30 min under a vacuum. The column was eluted first with 1 mL of ethyl acetate:methanol (9:1) under gravity (this eluate was collected in a test tube labeled as fraction 1), then washed with 1 mL of 5% methanol/2% acetic acid in water, then with 1 mL of 5% methanol/2% NH4OH in water under a vacuum and dried for 10 to 15 min under a vacuum. After drying, the column was eluted with 1 mL of 2% NH4OH in methanol and combined with eluate present in the test tubes labeled as fraction 1.
Wastewater Sample
Wastewater samples were collected from the influent of the aeration treatment at the Environmental Resources Training Center (ERTC), a training center for drinking water and wastewater treatment at Southern Illinois University–Edwardsville. The samples were analyzed for the presence of antibiotics and EDCs to demonstrate the effectiveness of the method development on real wastewater samples.
The wastewater samples were sequentially filtered through VWR 417 (40 μm) filter paper, then through VWR 696 (1.2 μm) glass microfiber filter paper, and then through Ahlstrom 193 (0.7 μm) microfiber glass filter. The filtrate was separated into six bottles each with 250 mL of filtrate, three samples for analysis of antibiotics and three for EDCs. All samples were spiked with appropriate internal standards as described previously.
Samples were adjusted to pH 3.0 using 6.0 M sulfuric acid before performing the SPE. Waters Oasis Prime HLB cartridges (6 mL, 200 mg universal polymeric reverse-phase sorbent) were used for wastewater sample analyte extraction. The SPE method for wastewater was identical to the synthetic matrix sample preparation, except the quantity of reagent solvents used was five times greater, due to the increased volume and cartridge bed mass.
Results and Discussion
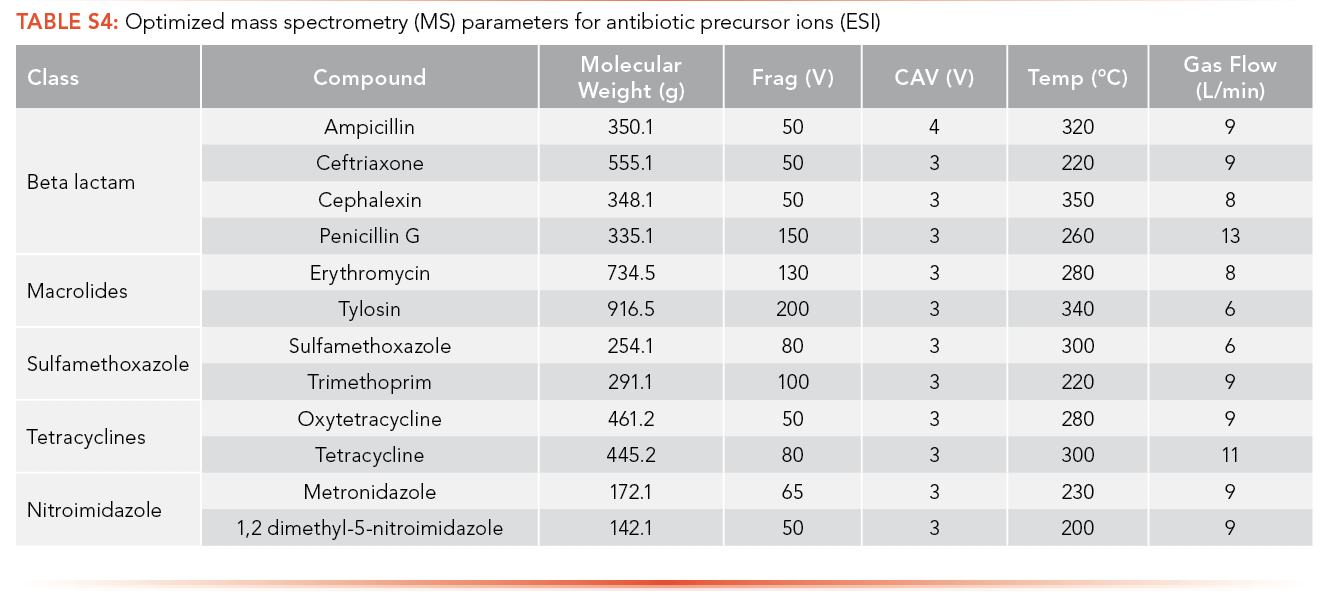
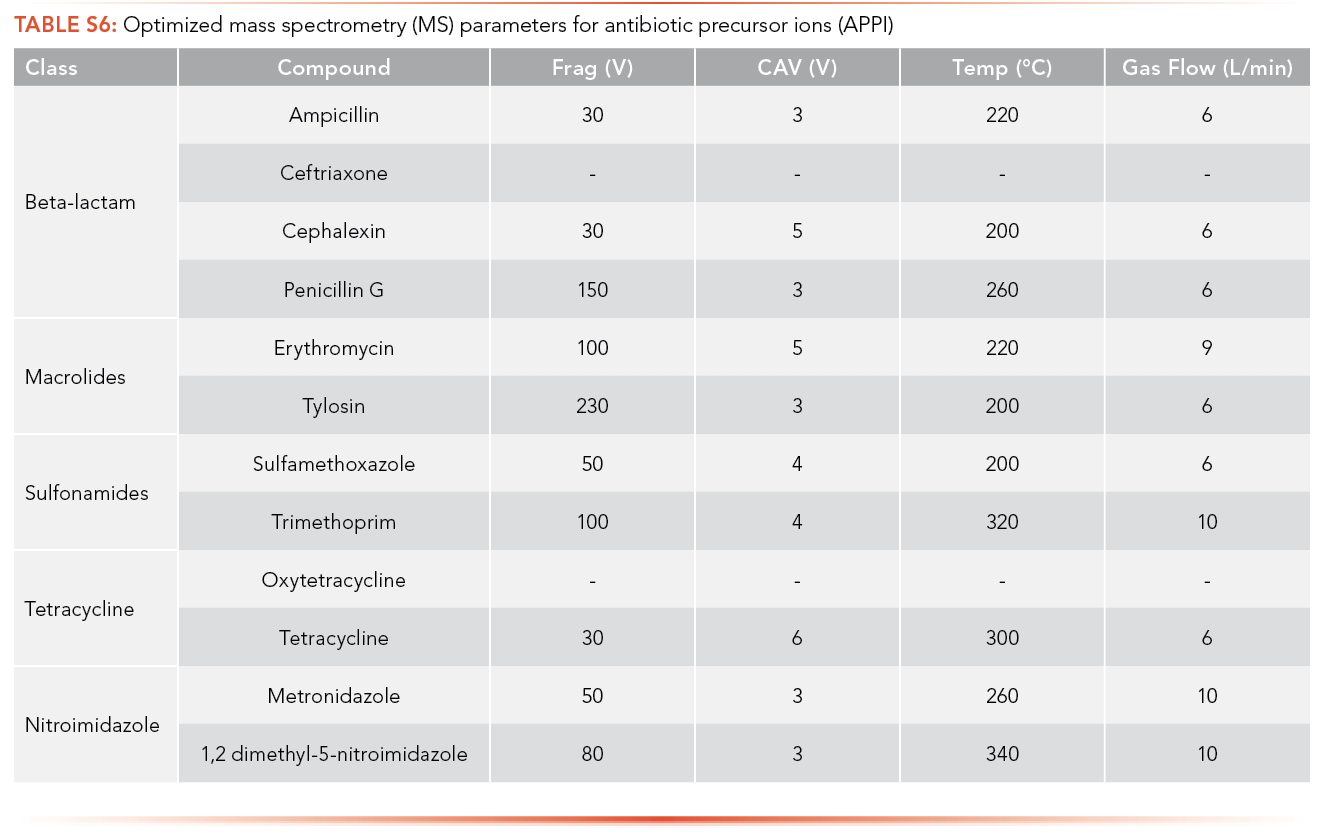
The optimized MS parameters for the precursor ion of antibiotics for ESI as an ionization source can be found in S4 and S5, while parameters for APPI are shown in S6 and S7. Ions with the highest intensity peak with a m/z equal to or greater than the MW of the analyte were selected as potential precursor ions and MS parameters were optimized using these ions.


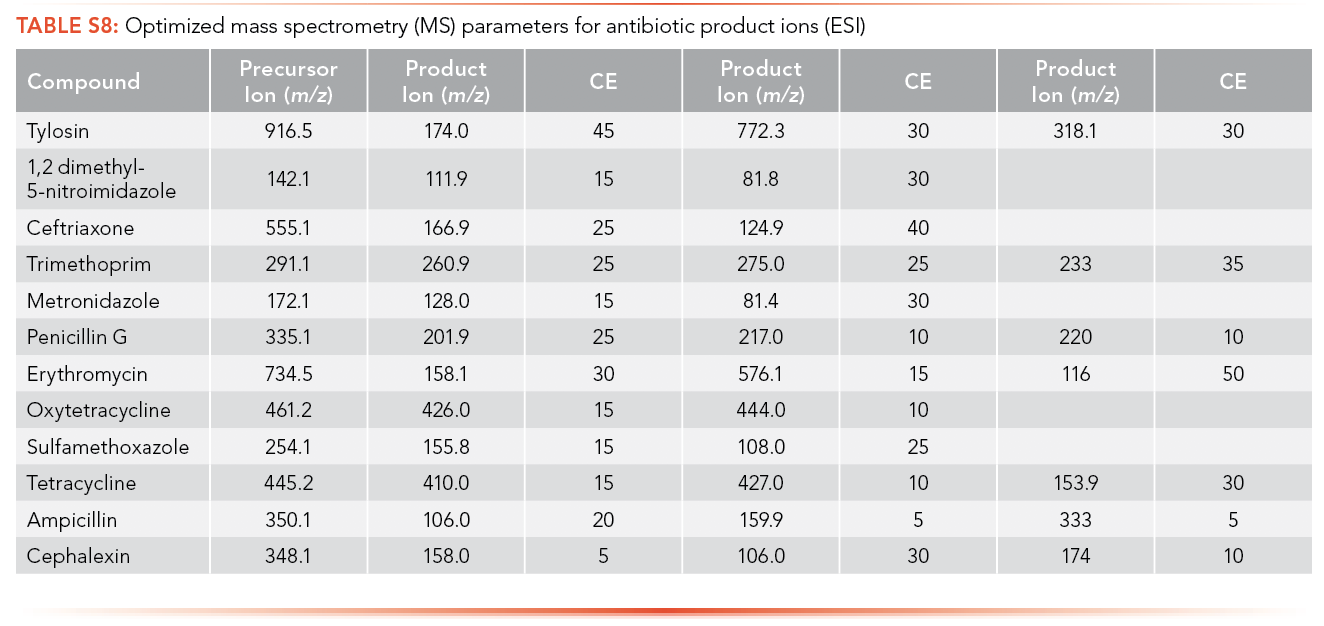
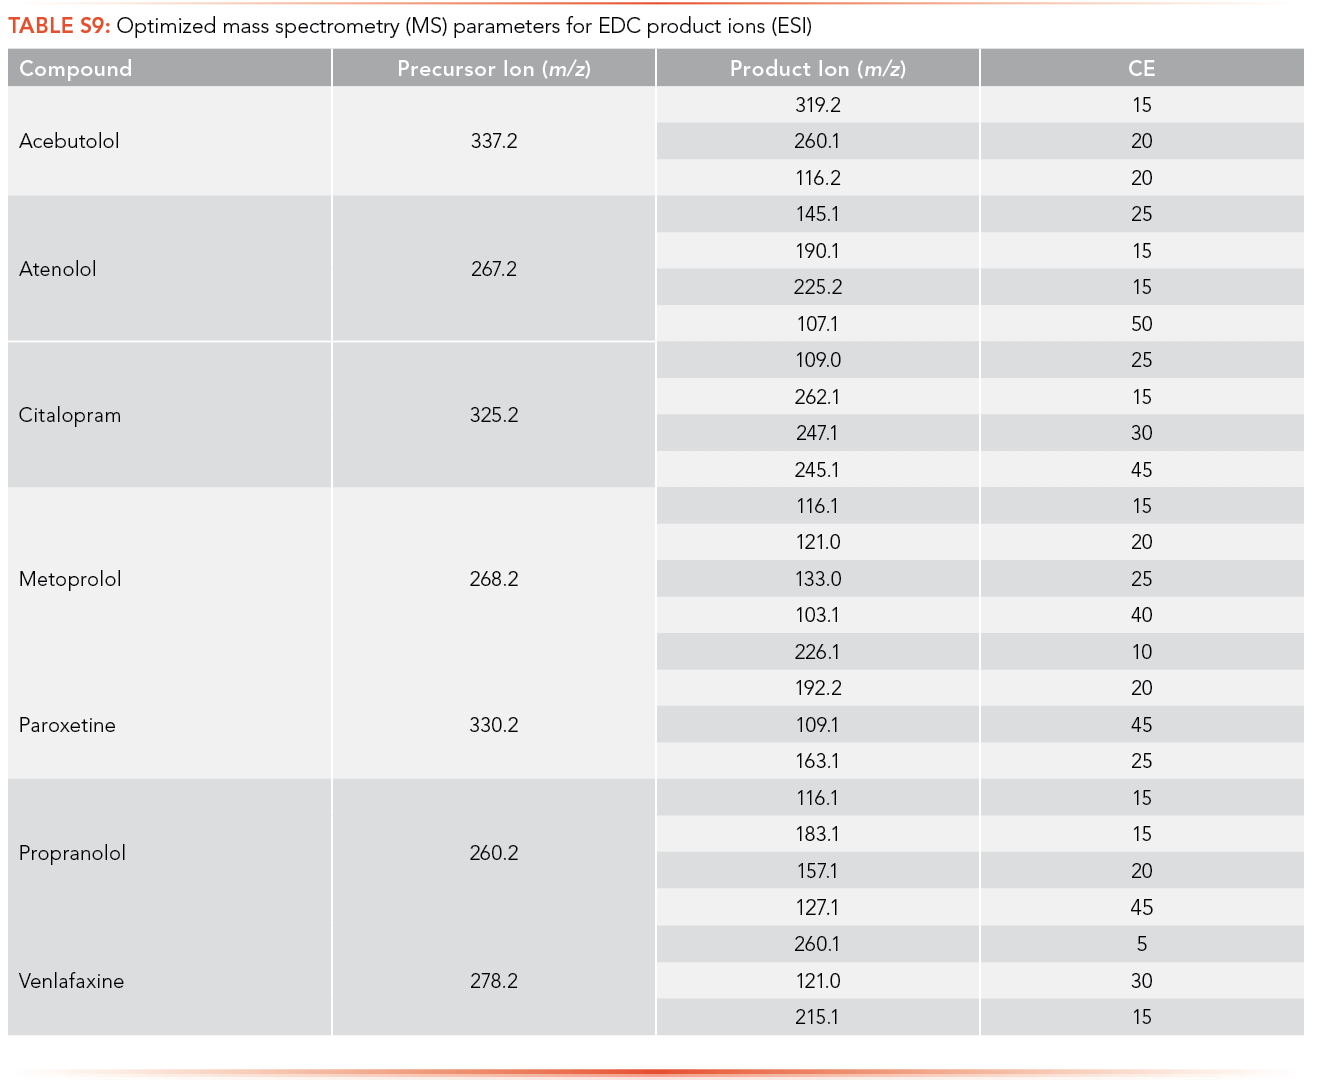
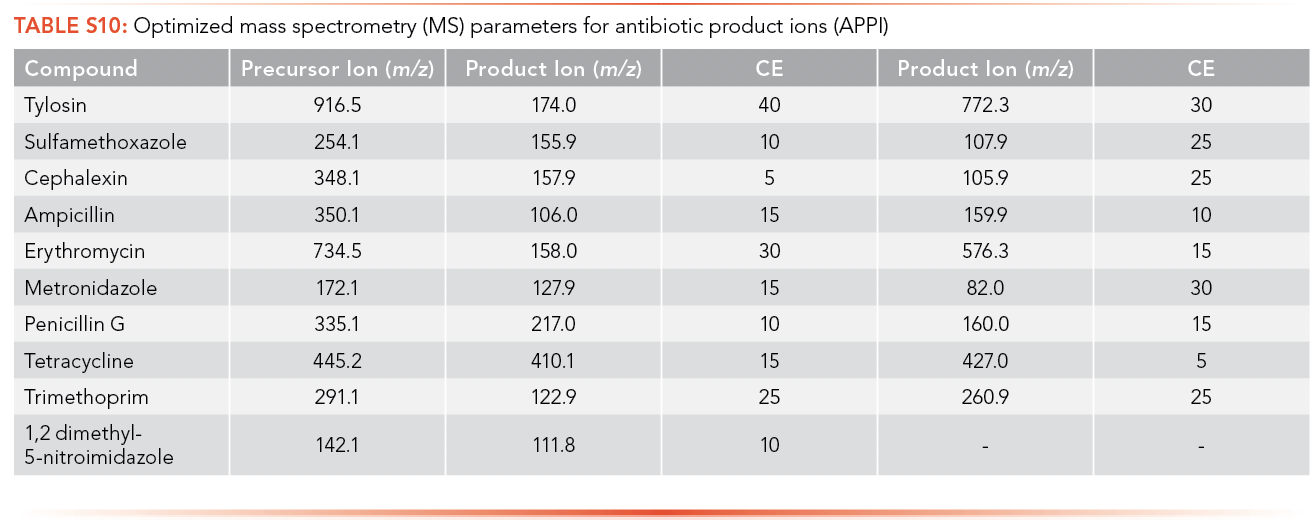
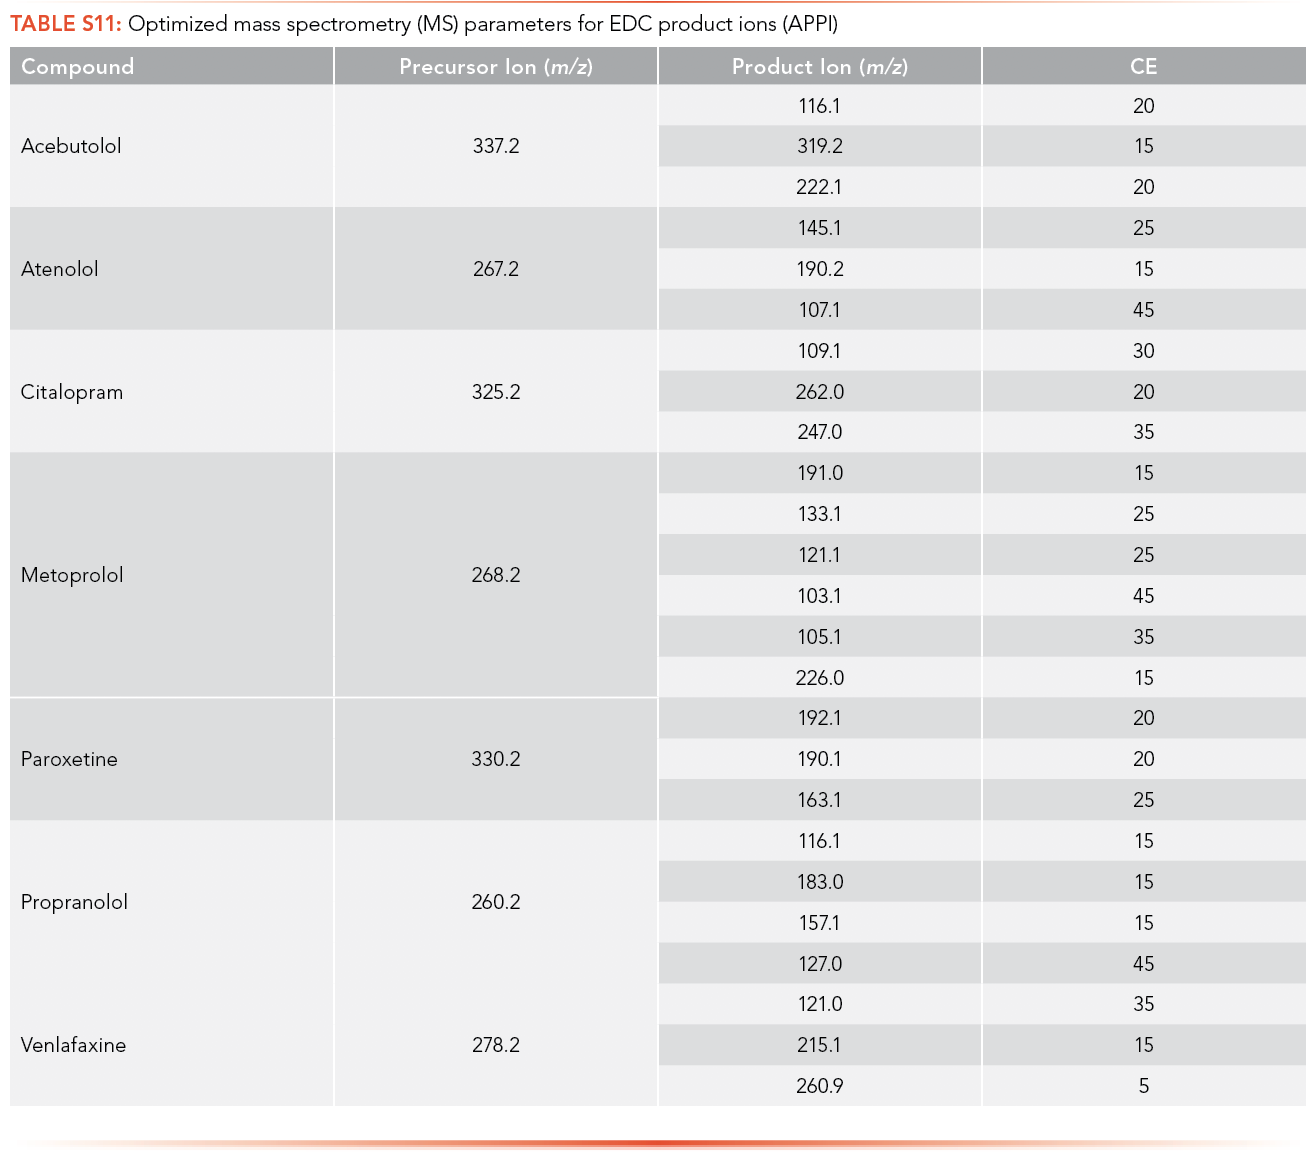
The optimized MS parameters for the product ion of antibiotics for ESI as an ionization source can be found in S8 and S9, while parameters for APPI are shown in S10 and S11. At most, three ions with m/z less than the MW of the analyte and with the highest ion abundance were optimized to determine the optimized collision energy of the product ions.
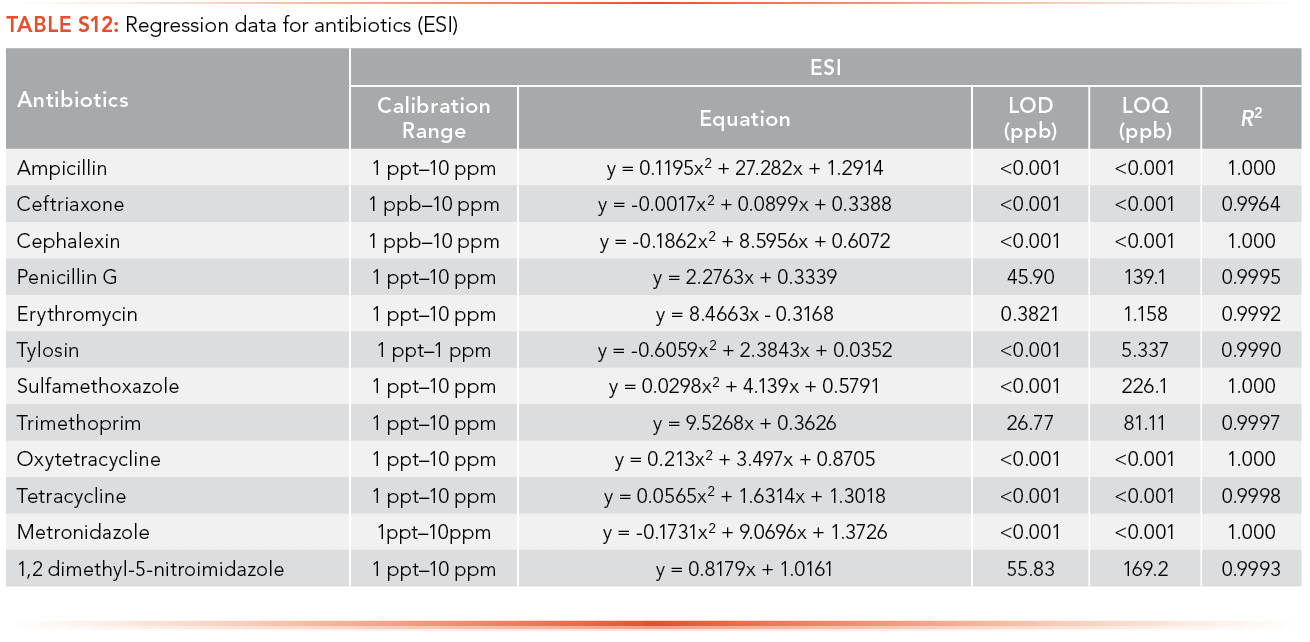
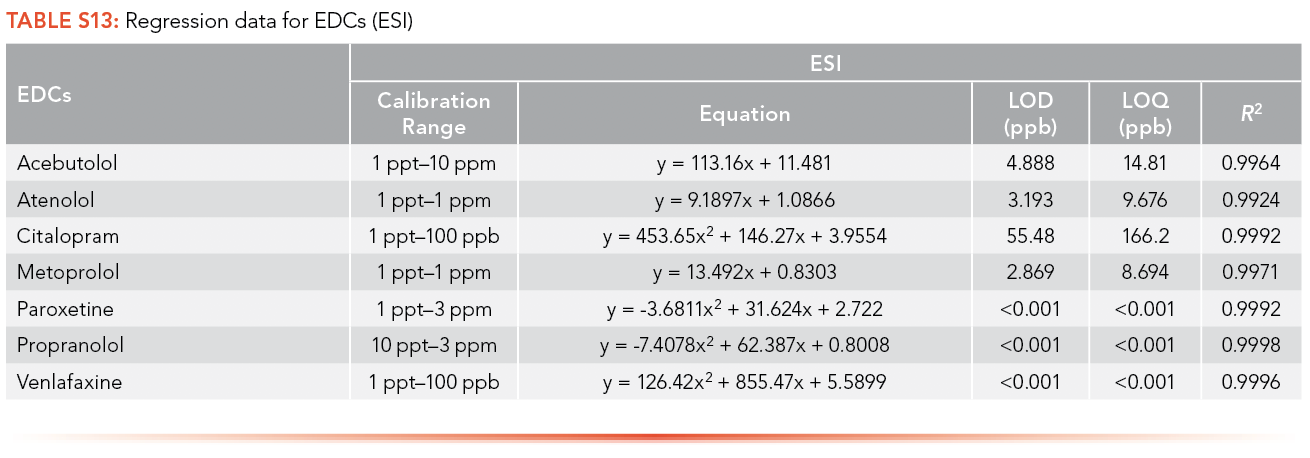
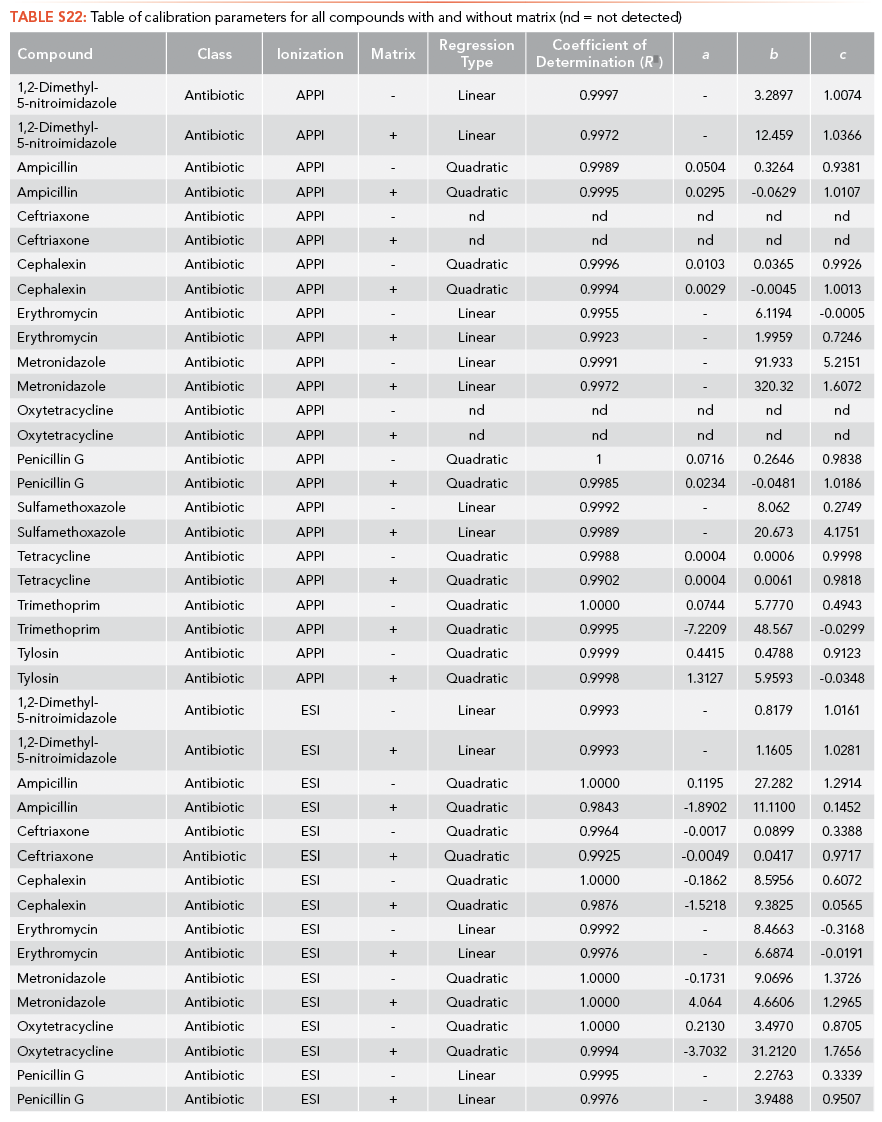
The regression equations for antibiotics and EDCs without matrix were selected such that they were equivalent for the calibration curve performed with and without matrix. The calibration curve correlation coefficient (R2) criteria were established as higher than 0.99 for all the antibiotics and EDCs without matrix using ESI, shown in S12 and S13. Ampicillin, ceftriaxone, cephalexin, sulfamethoxazole, oxytetracycline, tetracycline, and metronidazole have limits of detection lower than 1 ppt using ESI and sulfamethoxazole has the highest LOQ among the antibiotics analyzed (226.1 ppb). All standard calibration curves are shown in the Supplemental Information (See S13). Paroxetine, propranolol, and venlafaxine have a limit of detection lower than 1 ppt using ESI, and acebutolol has the highest LOQ (14.81 ppb).
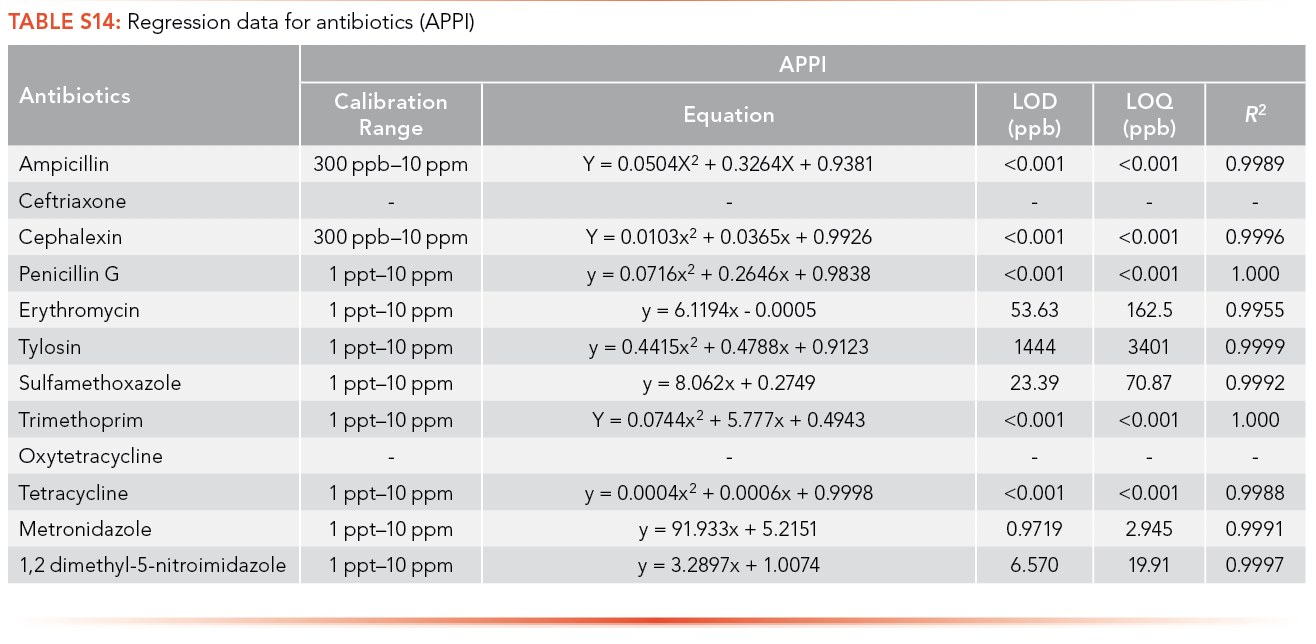
Ampicillin, cephalexin, penicillin G, trimethoprim, and tetracycline have limits of detection lower than 1 ppt using APPI as the ionization source, and tylosin has the highest LOQ among the antibiotics analyzed (3,401 ppb), as shown in S14. Citalopram, paroxetine, and propranolol have limits of detection lower than 1 ppt using APPI as the ionization source and venlafaxine has the highest LOQ (3,788 ppb) as shown in S15.
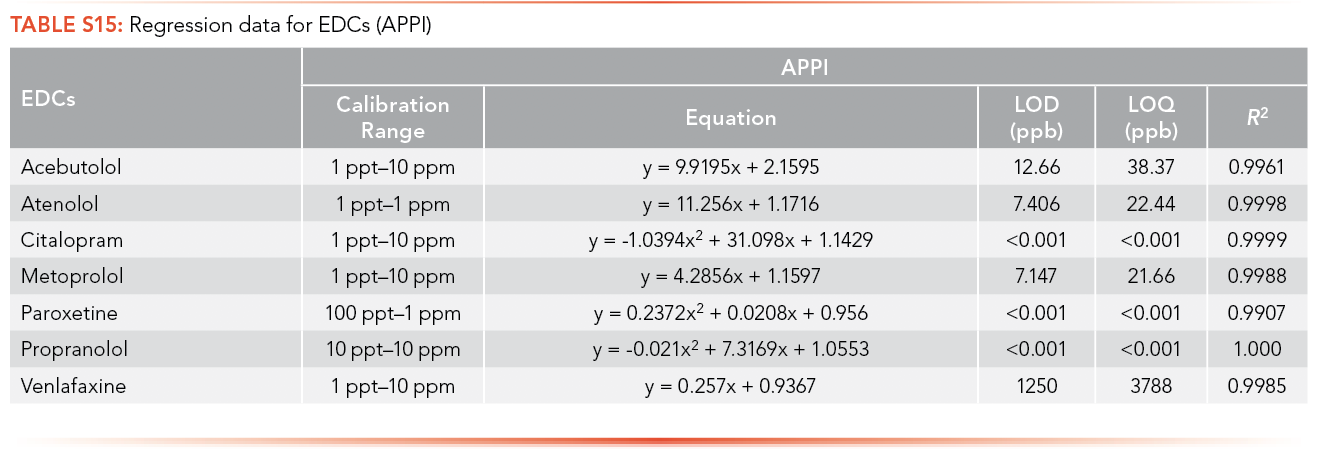
The efficiency of both ionization sources was determined by comparing the LOQ for each of the pharmaceuticals obtained using ESI and APPI. LOQ less than 1 ppt in both the ionization sources means the most efficient ionization source could not be determined. Many compounds that are thermolabile will degrade using APPI, meaning the compound will not be detected by APPI and ESI was the ionization source that was preferred here. Erythromycin, tylosin and metronidazole ionized efficiently by ESI based on the comparative LOQ result. This is hypothesized to be due to the pKa of each compound (Table I) being greater that the pH of the mobile phase (3.80) used in the analysis of antibiotics, allowing it to protonate easily. Acebutolol, atenolol, metoprolol, and venlafaxine were ionized efficiently by ESI based on the comparative LOQ results obtained from the calibration curve performed with and without matrix. A complete breakdown of this analysis can be found in Table II and Table III.
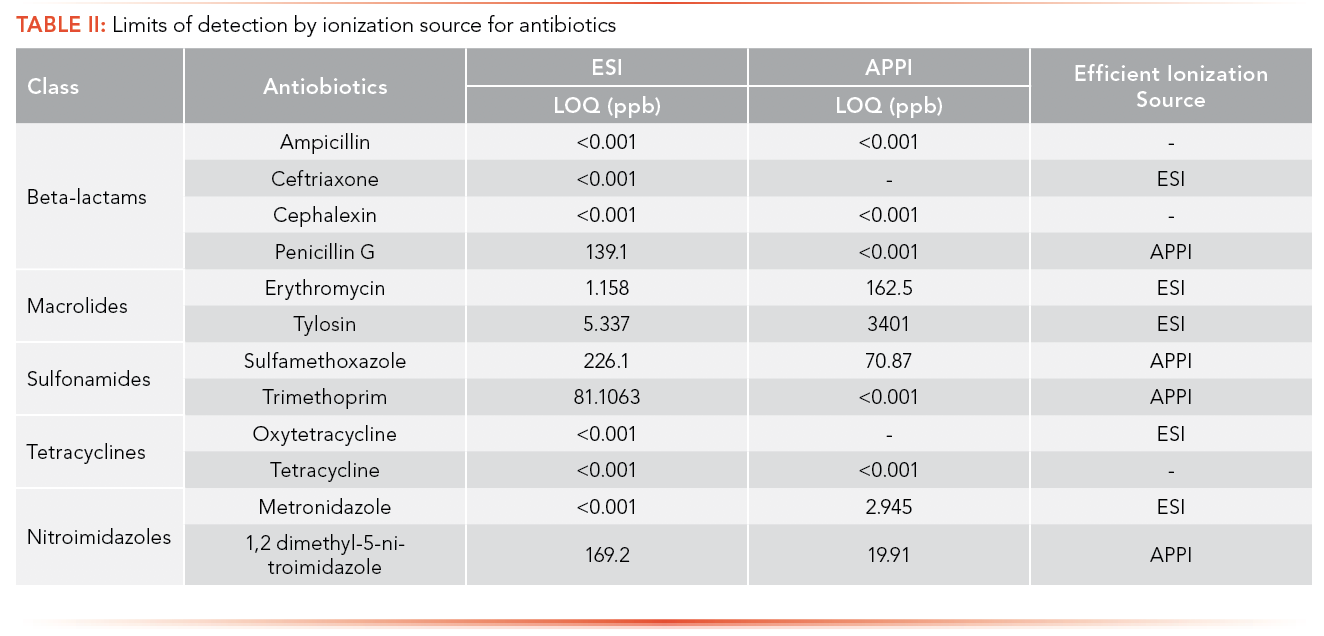

Penicillin G, sulfamethoxazole, and 1,2 dimethyl-5-nitroimidazole have lower LOQs when ionized by APPI; APPI is the preferred ionization source for these analytes. The pKa values of these compounds (Table I) are less than the pH of the mobile phase (3.80), leading them not to be protonated in solution. In addition, sulfamethoxazole and 1,2 dimethyl-5-nitroimidazole each have a high degree of conjugation in their structures, facilitating the absorption of photons and molecular radical ion formation (M+•) (24). This specific trend was not observed in the case of trimethoprim, indicating that some other preferred ion formation pathway must be present. Citalopram also has a higher degree of conjugation in its structure, facilitating the absorption of photons and M+•, making the APPI source highly efficient for the analysis of these compounds.
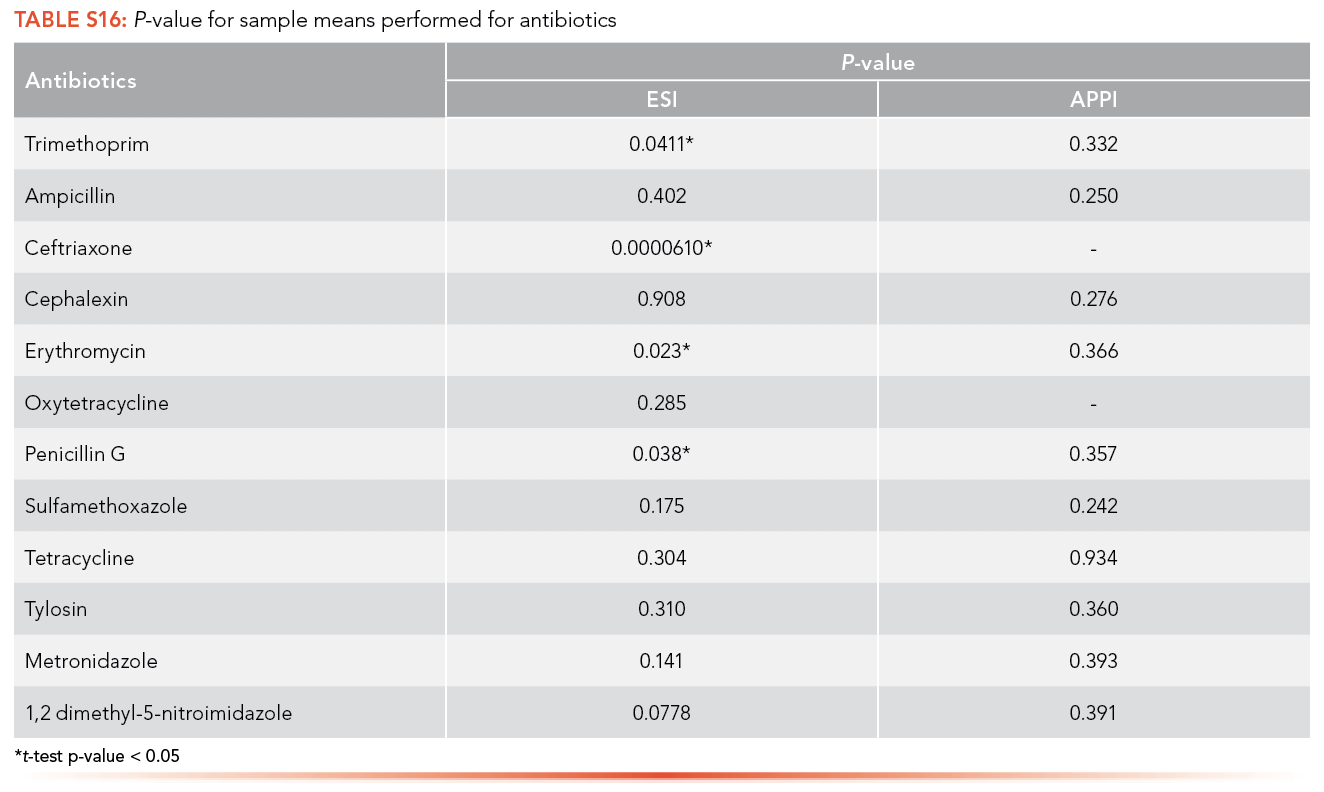
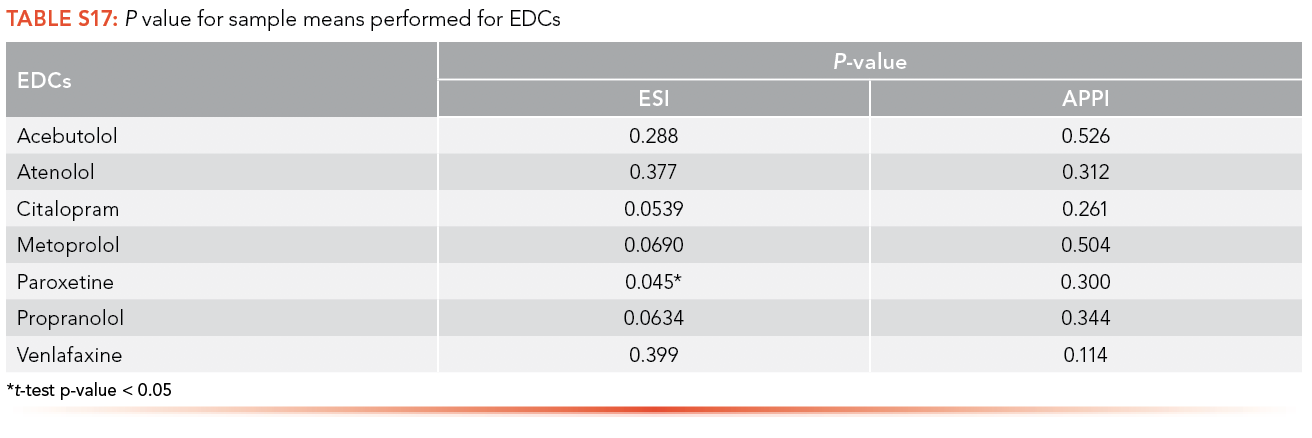
Paired t-tests were conducted at a significance level (α) of 0.05 on the data of the calibration curve performed with an artificial matrix and without a matrix. S16 provides the p-values of the test for both the ESI and APPI ionization sources for analysis of antibiotics and shows that all population means are equal; therefore, there is no significant difference between data obtained with or without a matrix. S17 shows the population means are also equal between the data obtained with and without artificial matrix for EDCs.
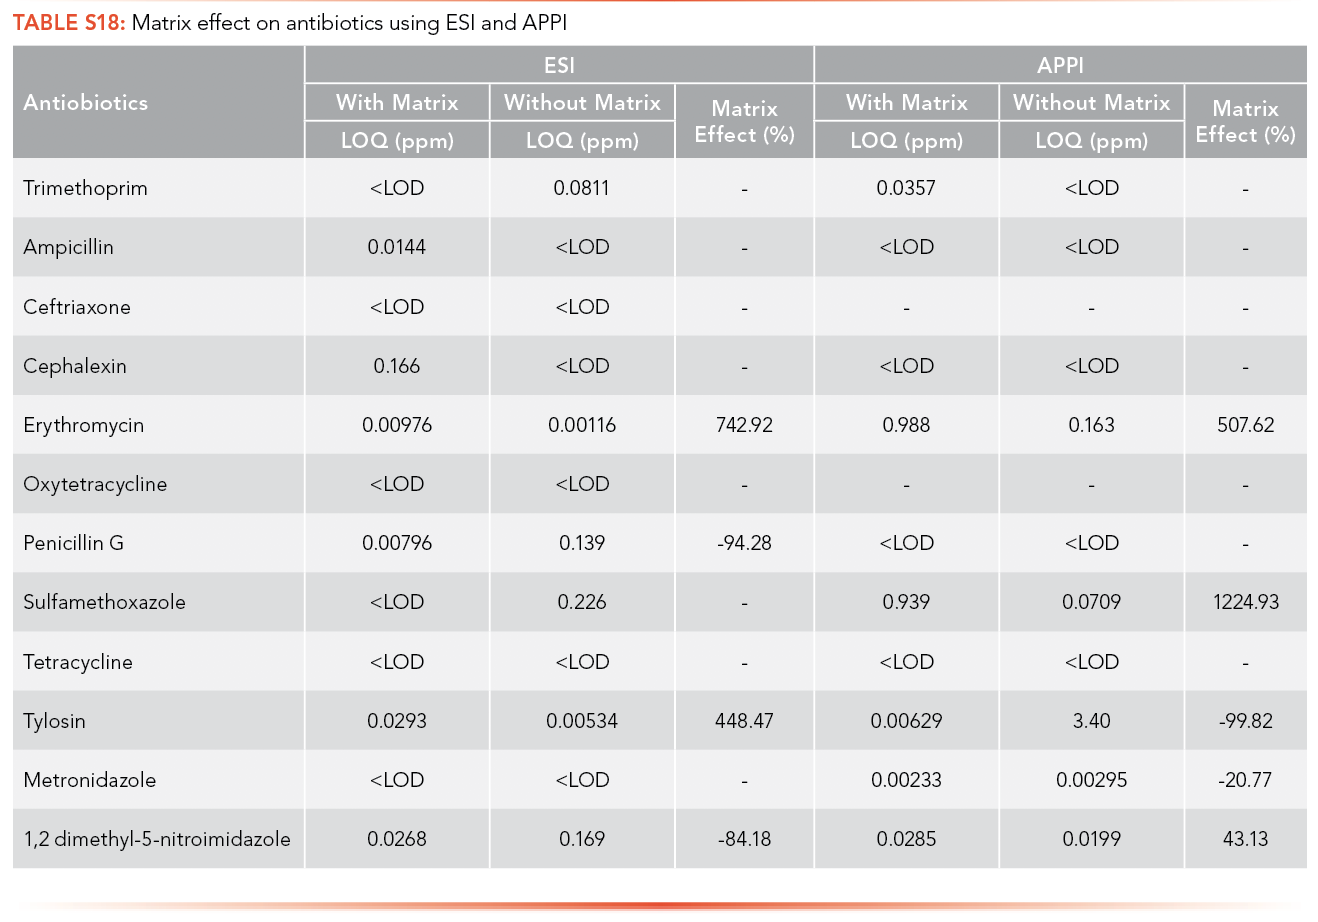
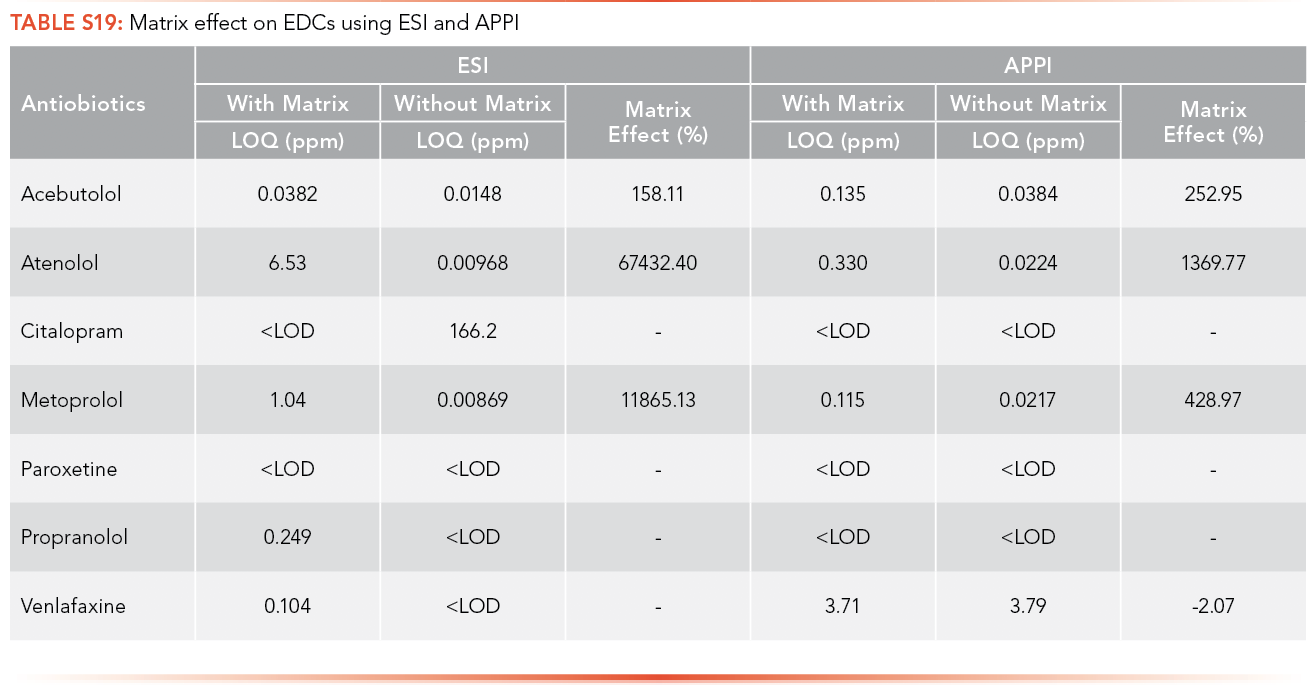
The matrix effects on antibiotics and EDCs using ESI and APPI was calculated using the LOQ obtained from calibration curves performed with and without matrix. The trends can be seen in Tables S18 and S19.
Real wastewater samples from the ERTC were analyzed for the detection of antibiotics and EDCs. Table IV shows the concentration of antibiotics in real wastewater samples and Table V shows the EDCs calculated using the calibration curve equation obtained from the calibration curve performed with and with- out synthetic matrix using ESI and APPI.
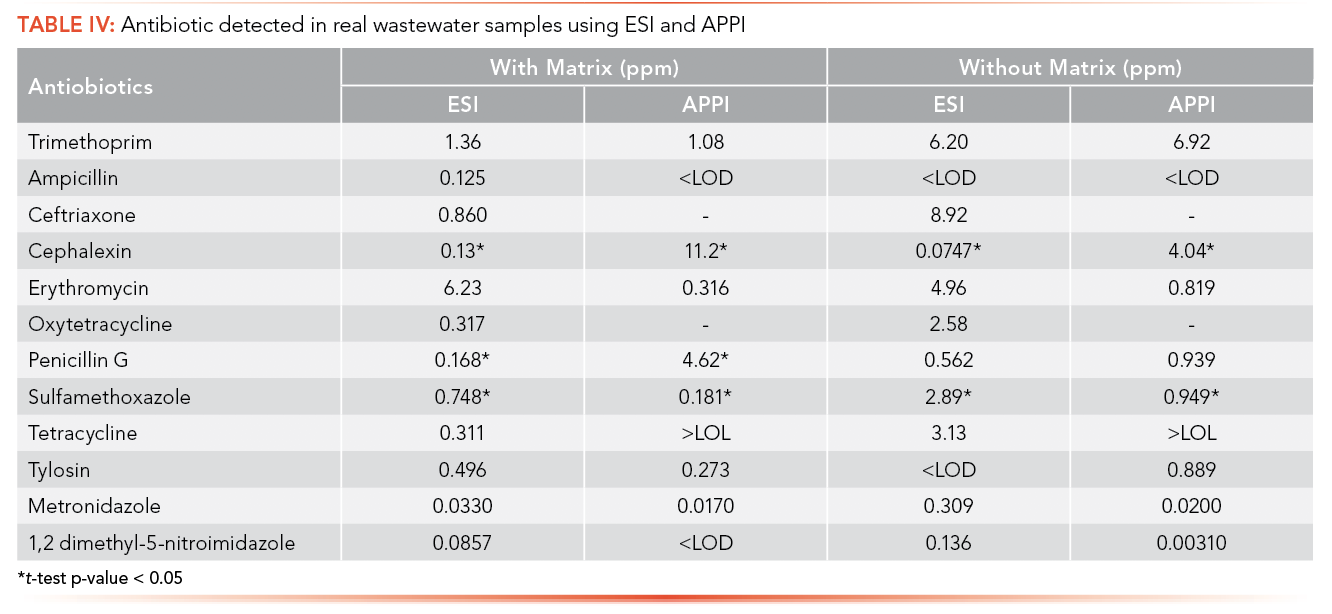
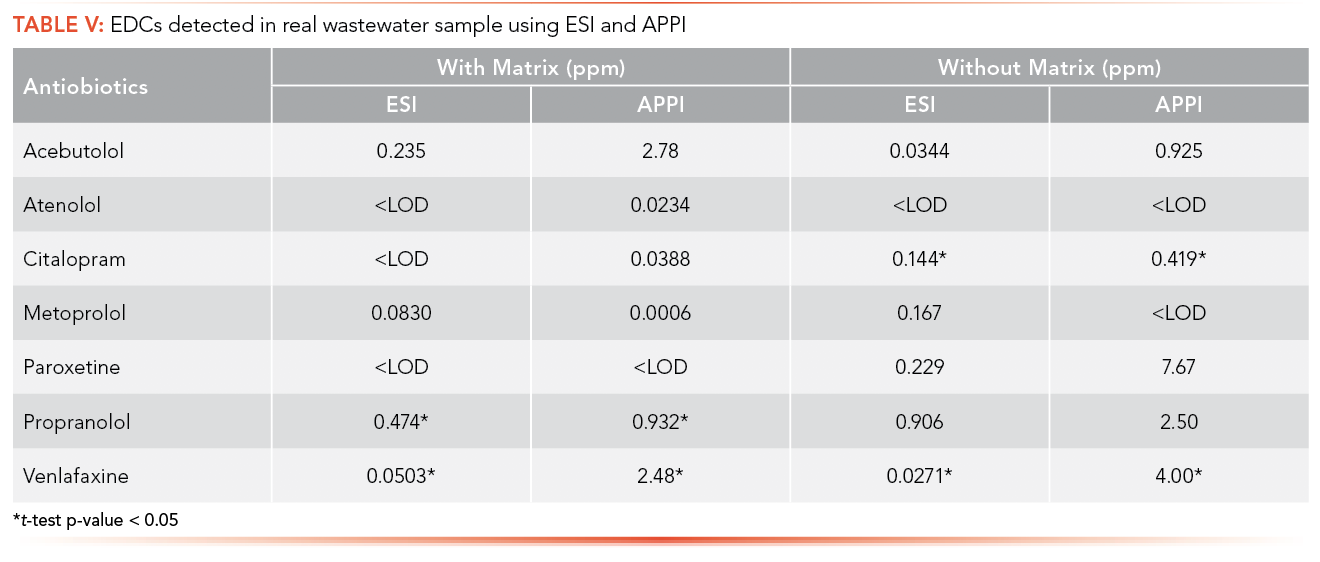
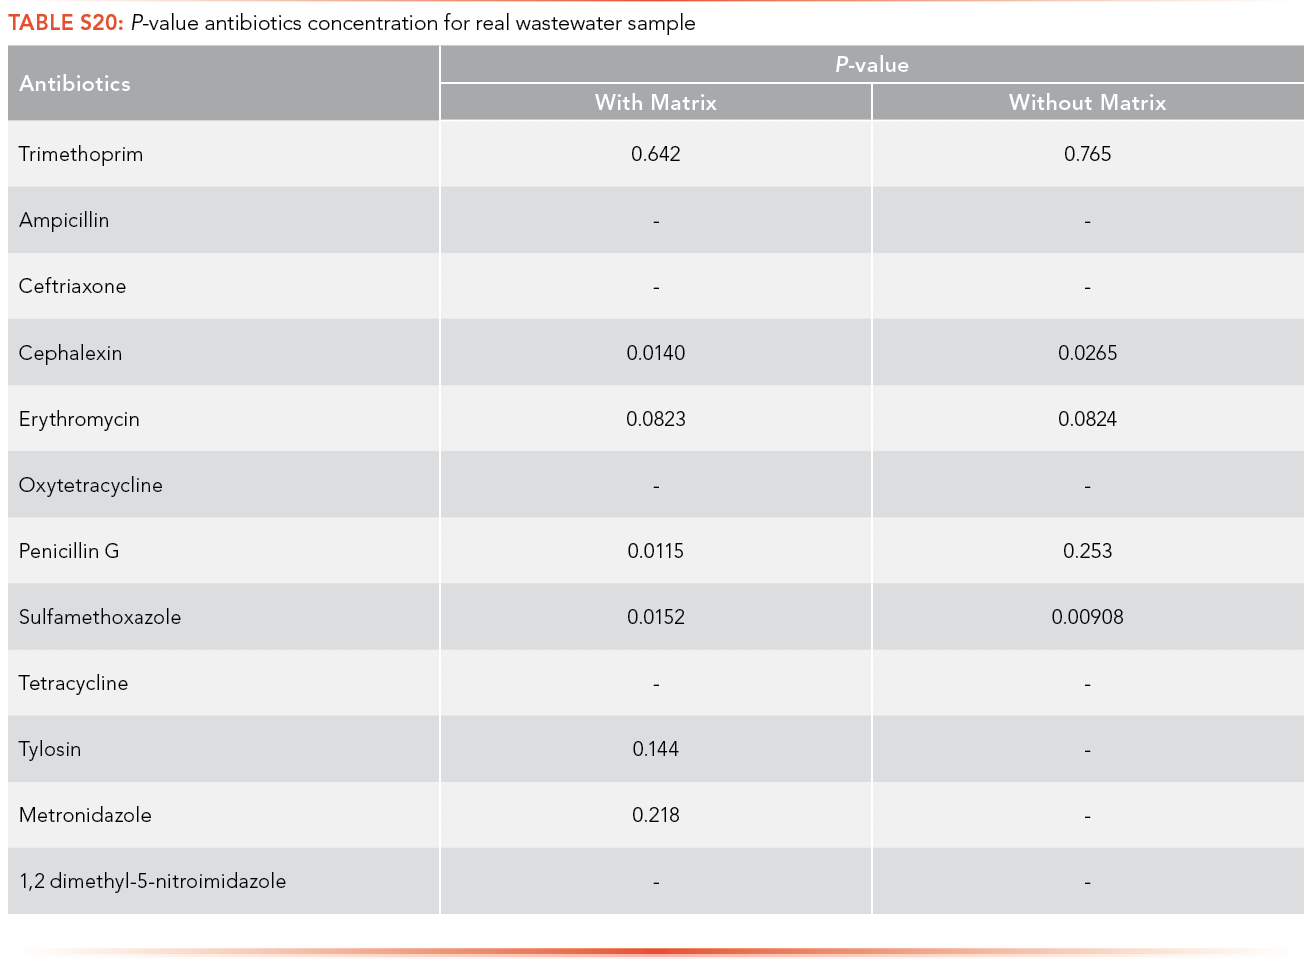
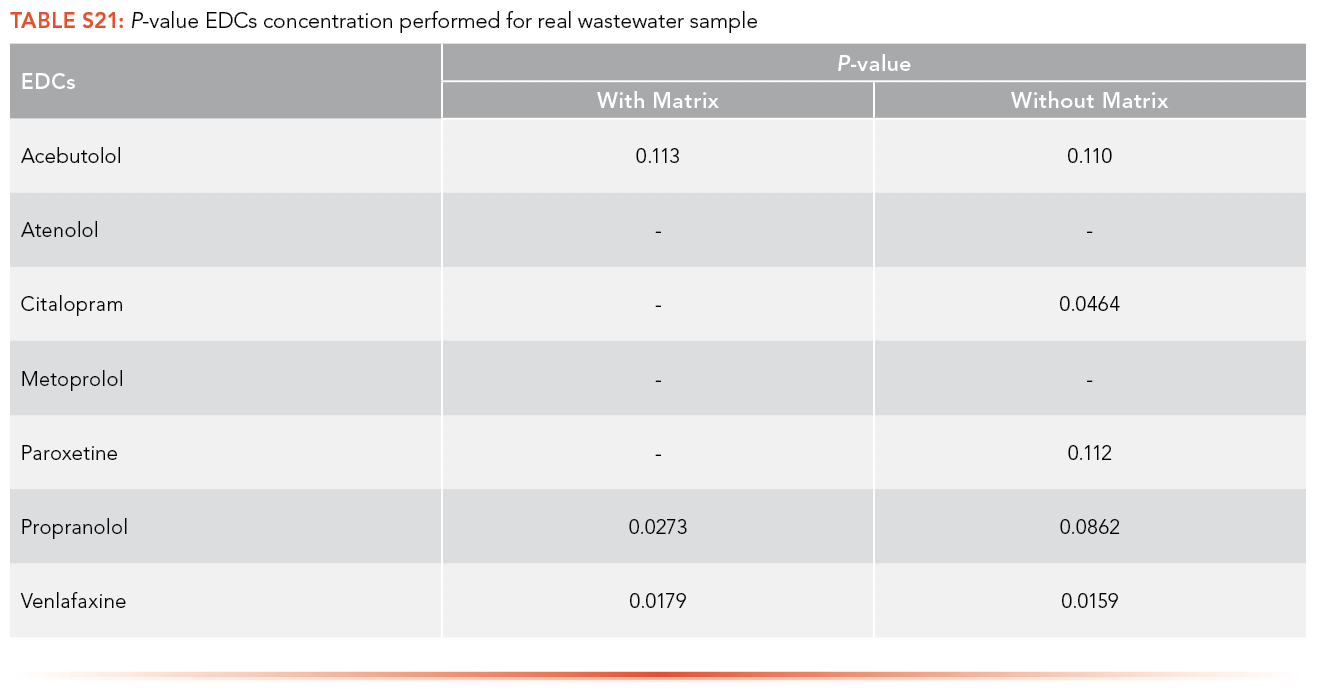
Paired t-tests were used to compare the concentration of antibiotics and EDCs in sample, calculated using the calibration curve performed with artificial matrix and without matrix. Paired t-tests were conducted at a significance level (α) of 0.05 to determine if there was a significant difference between the concentration of antibiotics and EDCs in the real wastewater samples collected from the ERTC wastewater treatment plant using the calibration equations obtained with artificial matrix and without matrix. Only three of the p-values, shown in S20 and S21, demonstrated a statistical difference between using the matrix calibration curve versus the water curve shown in S22, illustrating that while important for some analytes, overall it had insignificant effect in this specific study.
Conclusions
There are few studies comparing the efficiencies of ionization sources for the MS analysis of low MW pharmaceutical analytes. While many researchers are limited to using ESI as their only ionization source, the use of complementary ionization techniques produces better results for the quantitation of analytes, and should thus be considered for future studies. When purchasing an instrument costing $250,000 and up, the addition of a $25,000 additional ion source to improve analyte coverage in the analysis should be viewed as a reasonable added cost, considering that it nearly doubles the analytical capabilities of the instrument in terms of analyte coverage.
It was found that ESI is preferable for the analysis of pharmaceuticals, such as antibiotics, beta blockers, and SSRI anti-depressants. However, ESI is not suitable for the ionization of all the pharmaceuticals with high sensitivity. APPI is an excellent complement to ESI, as it is highly efficient in the ionization of analytes that ESI is unable to ionize.
There was no significant difference observed in the presence of matrix effects at very low analyte concentrations. With higher concentrations of analytes, however, matrix effects should be taken into consideration when using these methods due to the significant difference observed. Since the LOQ of most of the analytes was less than 1 ppt, further study is needed to determine the ionization efficiency of ESI and APPI for these compounds by calibrating at lower concentrations.
By determining the ionization energy of an analytes using the appropriate software, it can be predicted which compounds will ionize by APPI or ESI preferentially. This determination will aid in the analysis of other classes of environmental pollutants, including other groups of pharmaceuticals and pesticides.
Using ESI and APPI as complementary ionization techniques yields a more complete picture of what compounds are present when analyzing in full scan mode, as well as better quantitation of analytes when appropriately optimized. This information holds value because employing multiple ionization techniques is an easy fix that creates a cost-effective method for analyte detection that can improve the outcome of future research studies.
References
(1) S.D. Richardson, Anal. Chem. 80(12), 4373–4402 (2008).
(2) C.S. Ho, C.W.K. Lam, M.H.M. Chan, R.C.K. Cheung, L.K. Law, L.C.W. Lit, H.L. Tai, Clin. Biochem. Rev. (Ultimo, Aust.) 24(1), 3–12 (2003).
(3) S. Banerjee and S. Mazumdar, Int. J. Anal. Chem. 1–40 (2012).
(4) D.B. Robb and M.W. Blades, Anal. Chem. 78(23), 8162–8164 (2006).
(5) C. Wang, Austin Chrom. 2(2), 1–3 (2015).
(6) I. Marchi, S. Rudaz, and J.L. Veuthey, Talanta 78(1), 1–18 (2009).
(7) A. Leinonen, T. Kuuranne, and R. Kostiainen, J. Mass Spec. 37(7), 693–698 (2002).
(8) A. Garcia‐Ac, P.A. Segura, L. Viglino, C. Gagnon, and S. Sauvé, J. Mass Spec. 46(4), 383–390 (2011).
(9) A. Yamamoto, N. Kakutani, K. Yamamoto, T. Kamiura, and H. Miyakoda, Env. Sci. & Tech. 40(13), 4132–4137 (2006).
(10) E.Y. Klein, T.P. Van Boeckel, E.M. Martinez, S. Pant, S. Gandra, S.A. Levin, and R. Laxminarayan, PNAS 115(15), 3463–3470 (2018).
(11) C.S. Wiysonge, H.A. Bradley, J. Volmink, B.M. Mayosi, and L.H. Opie, Cochrane Database of Systematic Reviews (2017).
(12) S. Akbar and M.S. Alorainy, Saudi Med J. 35(11), 1307–1317 (2014).
(13) L.A. Pratt, D.J. Brody, and Q. Gu, NCHS Data Brief 283, 1–8 (2017).
(14) A.B. Boxall, M.A. Rudd, B.W. Brooks, D.J. Caldwell, K. Choi, S. Hickmann, and G.T. Ankley, Environ. Health Pers. 120(9), 1221–1229 (2012).
(15) M. Gros, D. Barcel, and S. Rodrs, J. Chrom. A 1248, 104–121 (2012).
(16) C.G. Daughton, Environ. Impact Assess Rev. 24(7–8), 711–732 (2004).
(17) J.W. Bennett, and K.T. Chung, Adv. App. Microbiol. 49, 163–184 (2001).
(18) G. Kapoor, S. Saigal, and A. Elongavan, J. Anaesthesiol. Clin. Pharmacol. 33(3), 300–305 (2017).
(19) C. Monneret, C. R. Biol. 340(9–10), 403– 405 (2017).
(20) M. Street, S. Angelini, S. Bernasconi, E. Burgio, A. Cassio, C. Catellani, F. Cirillo, A. Deodati, E. Fabbrizi, V. Fanos, and G. Gargano, Intl. J. Mol. Sci. 19(6), 1647–1691 (2018).
(21) H.E. Gray, “Laboratory Methods for the Advancement of Wastewater Treatment Modeling. M.S Theses and Dissertations,” (Comprehensive) [Online], Wilfrid Laurier University, Waterloo, Ontario, Canada, 2012.
(22) W. Zhou, S. Yang, and P.G. Wang, Bioanalysis 9(23), 1839–1844 (2017).
(23) L. Silvestro, I. Tarcomnicu, S. Rizea Savu, “Tandem Mass Spectrometry-Molecular Characterization, Chapter: Matrix Effects in Mass Spectrometry Combined with Separation Methods — Comparison HPLC, GC and Discussion on Methods to Control these Effects,” IntechOpen, London, United Kingdom, 2013.
(24) T.J. Kauppila, H. Kersten, and T. Benter, J. Am. Soc. Mass Spectrom. 26(6), 1036–1045 (2015).
ABOUT THE AUTHORS
Prakriya Shrestha, Katherine A. Maloof, Alayna Stephens, Clayton P. Donald, and Kevin R. Tucker are with the Department of Chemistry at Southern Illinois University Edwardsville, in Edwardsville, Illinois. Direct correspondence to: kevtuck@siue.edu

New Method Explored for the Detection of CECs in Crops Irrigated with Contaminated Water
April 30th 2025This new study presents a validated QuEChERS–LC-MS/MS method for detecting eight persistent, mobile, and toxic substances in escarole, tomatoes, and tomato leaves irrigated with contaminated water.
Accelerating Monoclonal Antibody Quality Control: The Role of LC–MS in Upstream Bioprocessing
This study highlights the promising potential of LC–MS as a powerful tool for mAb quality control within the context of upstream processing.
University of Tasmania Researchers Explore Haloacetic Acid Determiniation in Water with capLC–MS
April 29th 2025Haloacetic acid detection has become important when analyzing drinking and swimming pool water. University of Tasmania researchers have begun applying capillary liquid chromatography as a means of detecting these substances.
Prioritizing Non-Target Screening in LC–HRMS Environmental Sample Analysis
April 28th 2025When analyzing samples using liquid chromatography–high-resolution mass spectrometry, there are various ways the processes can be improved. Researchers created new methods for prioritizing these strategies.

.png&w=3840&q=75)

.png&w=3840&q=75)


.png&w=3840&q=75)


.png&w=3840&q=75)


