Aiding the Development of Extraction Procedures with Response Surface Methodology
LCGC North America
When developing analytical methods, several parameters are often considered, things like solvent type and amount, sample size, pH, sorptive phases, temperature, time, and more. While some of these considerations can be considered unimportant in a given situation and experience and chemical knowledge can guide us to appropriate starting points, extraction method development is often a one-parameter-at-a-time proposition. A family of statistical approaches, which fall under the category of response surface methodology, are available to screen and optimize several parameters simultaneously.
When developing analytical methods, parameters such as solvent type and amount, sample size, pH, sorptive phases, temperature, and time are often considered. Experience and chemical knowledge can guide us to appropriate starting points, but extraction method development is often a one-parameter-at-a-time proposition. A family of statistical approaches, which fall under the category of response surface methodology, are available to screen and optimize several parameters simultaneously. The resulting model provides a reasonable approximation of a suitable extraction, or analytical, method with minimal effort. Here we present an overview of response surface methodology and discuss its application to developing extraction methods.
Development of analytical methods involves monitoring parameters affecting the response in question to determine the optimal conditions. Traditionally, optimization is done by varying one variable at time while holding the rest of the independent variables constant. This method is time consuming considering the number of runs involved and does not consider the interactions among the variables. Therefore, it does not depict the true representation of the process.
Response surface methodology (RSM), a collection of mathematical and statistical techniques, is used in designing experiments in which the outcome of the experiment (that is, response) is influenced by several variables when the true relationship of the variables and the response is unknown. It involves fitting empirically obtained response data to an appropriate polynomial equation that expresses the behavior of various variables. In general, RSM is represented as a function as shown in equation 1 (1):

The variables x1 and x2 are independent variables where the response y depends on these and ε is a term denoting experimental error. In most cases, the true relationship of the variables and the response is not known. The approximation of the relation can be done by a first-order model whereby two independent variables can be expressed as

If there is a curvature in the response, a higher degree, second-order polynomial function is used:

The purpose of these equations is to establish the interaction among factors and the effect on the response. They also establish, through hypothesis testing, the significance of the factors. Finally, these functions are used to determine the optimum conditions that result in the maximum or minimum response over a given region.
Steps in RSM
There are five stages involved in the application of RSM in experimental design, as outlined below.
Selecting the Variables and Scale Range
The success of the optimization process is dependent on the choice of variables and their range. All important factors based on the objective of the experiment should be included, and the factor settings for impractical or impossible combinations like very low pressure and very high gas flows should be checked. We do not want to include values that degrade the sample or values that are not feasible. For instance, in optimizing an extraction process using plant samples, temperature values that are high enough to burn the sample are undesired. In another example, with supercritical fluids, temperatures and pressures that are within or above the supercritical region of the fluid are needed. It is also important to consider the operating limits of the instruments used for analysis.
Choosing the Experimental Design
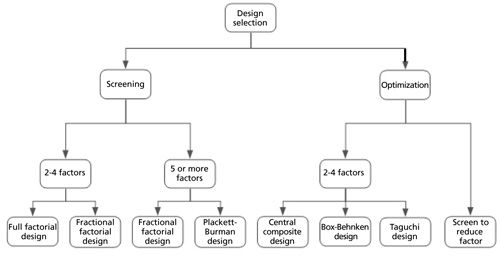
There are several types of designs, and the appropriate choice depends on the objective or goal of the experiment and the number of factors being investigated. The most commonly used designs are full and fractional factorial design, central composite, and Box-Behnken. These designs can be grouped according to purpose.
Figure 1 illustrates different designs chosen according to the number of factors (2).
Screening Designs
The level of significance of different factors varies. It is usually practically impossible to consider the effects of all parameters. Therefore, it is necessary to identify the main factors that significantly affect the response. Screening designs are used to select the main factors. When two to four factors are involved, full factorial in two levels is used. It combines high and low combinations of all of the output factors and the number of runs are 2k, where k is the number of factors. When more than four factors are involved, 2k can result in a large numbers of runs to be made, so two-level fractional factorial design is used.
Comparative Designs
Apart from the variables or factors that are of primary interest, there may be other nuisance factors that can affect the outcome of the experiment but are not of primary interest. For example, in the collection of volatile compounds in a solvent following supercritical fluid extraction, the primary factors are temperature, solvent polarity, and viscosity. There are other factors, such as depressurization rate, solvent volume, and position of the restrictor either in the headspace or inside the solvent; these can be referred to as nuisance factors. To avoid spending time deciding which nuisance factors are important to track, a randomized block design, which is a type of comparative design, is used. It is possible to assess the effect of different levels of the primary factors of interest without worrying about the nuisance factors, since in each block the nuisance factors are held constant and only the factors of interest vary.
Response Surface Design
Response surface design is used to estimate the interaction and quadratic effect and give an idea of response surface. It is mainly used to optimize or improve a process by either maximizing or minimizing a response. It is used in troubleshooting to reduce variation, and also it can be used to make a process robust by making it less sensitive to the influence of external and noncontrollable factors.
Coding the Independent Variable
Variables usually have different units and ranges. Coding usually involves transforming the real values into coordinates inside a scale with dimensionless values to normalize the values. Each of the coded value ranges from -1 to 1. Equation 4 (1) is used for coding:

where X is the coded variable, x is the natural variable, and xmax and xmin are the maximum and minimum values of the natural variable.
Statistical Analysis of Data
After the response data is acquired according to the chosen design, the regression coefficients βi, βii, and βij in equations 1–3, which are coefficients for linear, quadratic, and variable interactions, are determined using matrix notation. The matrix is solved by the method of least squares (MLS). This technique fits the experimental data to a mathematical model to generate the lowest difference between the observed response and the fitted response. This difference is referred as the residual. MLS assumes that random errors are independent and are equally distributed with a zero mean and common unknown variance. This makes the evaluation of significance of the model possible.
Evaluation of Model and Validation
Analysis of variance (ANOVA) is usually used for the evaluation of quality of the fitted model. It compares the variation caused by the changing combinations of variable levels and random errors because of response measurements. This comparison helps in the evaluation of significance of the model as sources of experimental variance are considered. The sources of variation are considered to be caused by regression, residual, lack of fit, and pure error. Division of the square of each source of variance by the respective degrees of freedom, referred to as the media of the square (MS), is used in this evaluation. To determine if the mathematical model is well fitted, the ratio of MS of regression with the MS of residual is compared using the Fisher distribution (F-test). If the ratio is higher than the tabulated value of F, the model is considered to be statistically significant. Another evaluation is testing lack of fit. The ratios of MS because of lack of fit and MS because of pure error are used. The ratio should be lower than the tabulated F value for a well-fitted model. A well-fitted model is one that has significant regression and nonsignificant lack of fit. It should be noted that the F-test is only valid for models with no evidence of lack of fit. The coefficient of determination R2 cannot be used alone in concluding the accuracy of the model. Because R2 is a measure of the amount of the reduction variability, adding a variable will always increase R2 even if the variable is not statistically significant. Therefore, it is possible to have models with large values of R2 that are not significant and give poor prediction. Evaluation of accuracy using the R2 value should be used together with the absolute average deviation (AAD), which describes the deviations directly. For predictive models that can be used for prediction, the R2 value must be close to 1 and the AAD between the predicted and observed must be as small as possible. Visual inspection of the residual graph should show normal distribution for a well-fitted mathematical model.
Steps of Design Analysis
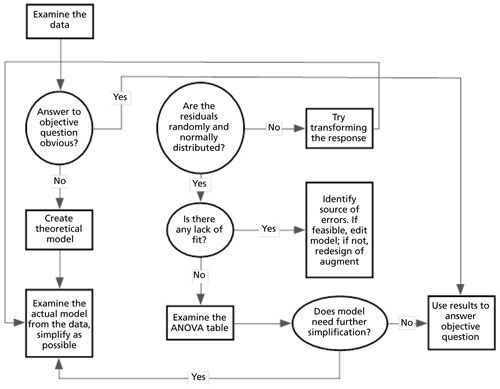
Commercial software, including Design-Expert (Stat-Ease), JMP (SAS Institute), DOE++ (Reliasoft Corporation), Statgraphics (StatPoint Technologies), and others can be used to design and analyze response surface experiments. Figure 2 illustrates the steps followed in analyzing the model.
Design Plots
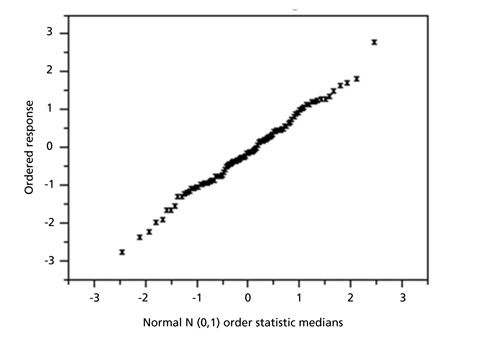
To examine outliers and other obvious problems, plots indicating the response distribution (histograms or box plots), scattering, main effect, and interactions can be used. Using normal distribution plots, as in Figure 3, the plot of ordered response versus normal order statistic medians is used to determine if data sets are well distributed. For a normal distribution, a straight line is expected. Deviation from a straight line indicates departure from normality. A normal distributed data set indicates that the model is good for the experimental data sets.
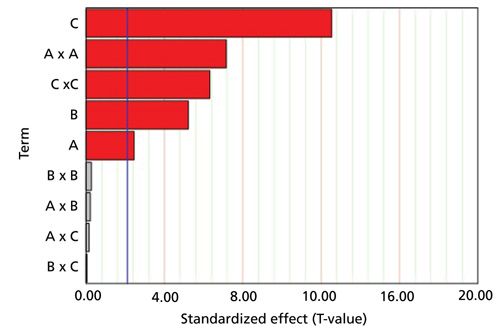
One of the goals of experiment design is to determine which factors are significant and to what extent and also to establish the interaction behavior among the variables. Interaction effect plots and Pareto charts are usually generated from empirically generated data to illustrate the significance level and interaction. Figures 4 and 5 are examples of Pareto charts, interaction effect plots, and the three independent variables of time, depressurization rate, and temperature during the collection of volatile compounds after supercritical fluid extraction.
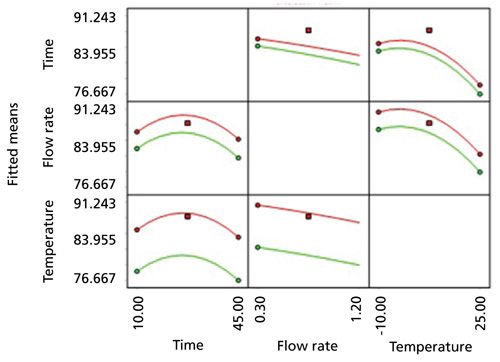
The interaction plots in Figure 5 show if there is a relationship between variables and the nature of interaction. The response surface, Figure 6, can be used to visualize the relation of response to variables.
Advantages of RSM
RSM offers a wide range of information ranging from the significance of independent variables to the interaction between variables. Compared to classical methods used to acquire the same information, fewer experiments are needed for RSM, lowering cost and time. Using RSM, variables can be screened and less significant variables can be dropped. RSM is able to generate model equations, which can be used to explain the behavior of a system as different levels of variables can be simultaneously optimized.
Application of RSM in Chemical and Biochemical Processes
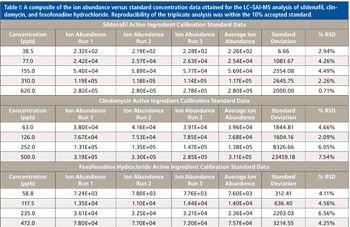
The experimental design approach has been used in determining optimum conditions during the optimization of extraction steps, derivatization reactions, separation steps, quantification processes, and robustness studies. Table I summarizes some applications of RSM in the optimization of different steps in chromatography and spectroscopic techniques (4–6).
Specific Examples of RSM Applied to Extraction Method Development
One example shows the RSM approach successfully applied to screen and optimize parameters for direct derivatization and dispersive liquid-liquid microextraction (DLLME) (7). This work involved converting cyanamide into a less polar compound before DLLME and subsequent high performance liquid chromatography (HPLC)-fluorescence analysis. A two-level 2k factorial design was used to screen the main variables and determine their level of significance. In the derivatization procedure, five variables were screened: temperature, time, derivatization agent concentration, buffer amount, and pH. Temperature, derivatizing agent amount, and pH were found to be statistically significant. In the DLLME step, the volume of disperser solvent, sodium chloride concentration, pH, and extraction time were screened. In the extraction procedure, pH, extraction solvent volume, and ionic strength were found to be significant. Using the three variables found to be important in each procedure, a central composite design (CCD) was used for optimization.
Another example is research done to optimize fermentation conditions for rapid and efficient accumulation of macrolactin A, which is a pharmacologically important marine antibiotic (8).
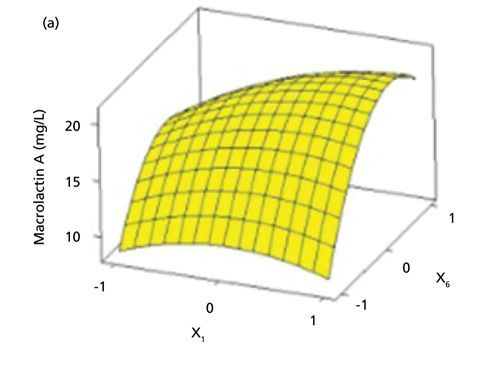
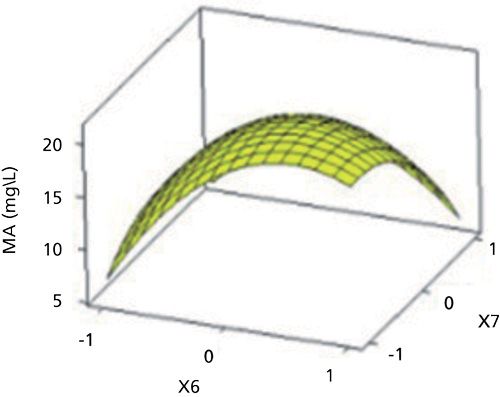
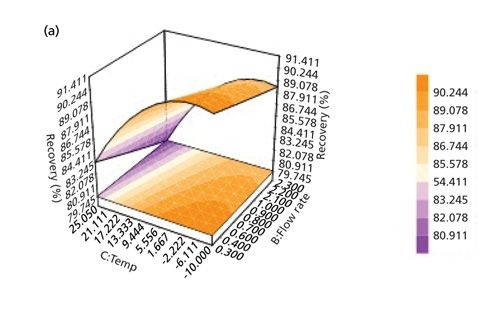
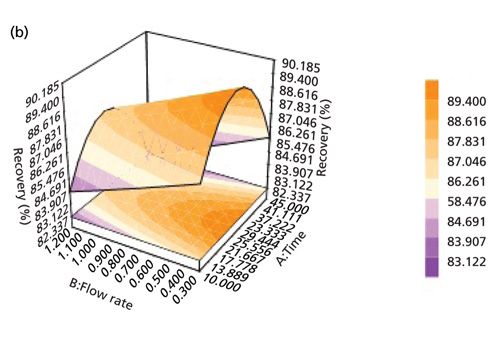
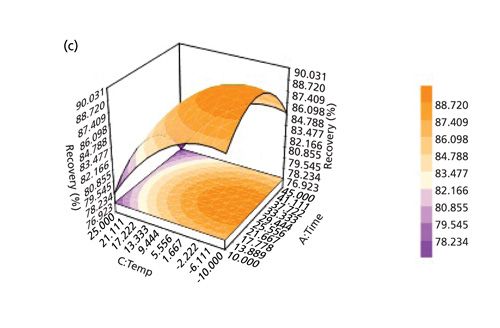
Plackett-Burman (PBD) factorial design was used to screen eight culture medium composition variables, namely peptone concentration, yeast concentration, beer extract concentration, glucose concentration, FePO4 concentration, temperature, and initial pH. PBD results indicated that peptone concentration and medium volume had positive effects while temperature had a negative effect. These three variables were selected and used in optimization of the fermentation process using a Box-Behnken design. Figure 7 shows three-dimensional surfaces resulting from the Box-Behnken design showing mutual interactions on macrolactin A production.
Conclusion
Response surface methodology is an important tool in the experimental design of analytical chemistry procedures. It not only saves time and money by reducing the number of runs involved, but also gives important information on the interaction between independent variables. Validation of RSM models involves visual and numerical inspection. Residue plots from the fitted model provides information on the adequacy of the model at a broader range than numerical methods. They readily illustrate the relation between the model and data as opposed to numerical methods, which tend to focus on a particular aspect of that relationship. In RSM, numerical methods are used for confirmation of the graphical techniques. Before applying RSM, it is necessary to choose the design that defines which experiments should be carried out in the experimental domain of interest. If the data does not have curvature, first-order design models like factorial designs can be used. If the experimental data does not follow a linear function, quadratic response surface experimental designs like Box-Behnken, central composite, and Doehlert experimental designs can be used.
References
(1) D. BaÅ and Ä°.H. Boyacı, J. Food Eng.78, 836–845 (2007).
(2) K. Sharif, M. Rahman, J. Azmir, A. Mohamed, M. Jahurul, F. Sahena, and I. Zaidul, J. Food Eng.124, 105–116 (2014).
(3) NIST/SEMATECHe-Handbook of Statistical Methods, http://www.itl.nist.gov/div898/handbook/pri/section4/pri42.htm, accessed April 2015.
(4) S.L.C. Ferreira, R.E. Bruns, E.G.P. da Silva, W.N.L. dos Santos, C.M. Quintella, J.M. David, J.B. de Andrade, M.C. Breitkreitz, I.C.S.F. Jardim, and B.B. Neto, J. Chromatogr. A 1158, 2–14 (2007).
(5) S.C. Ferreira, R. Bruns, H. Ferreira, G. Matos, J. David, G. Brandao, E.P. da Silva, L. Portugal, P. Dos Reis, and A. Souza, Anal. Chim. Acta 597, 179–186 (2007).
(6) M.A. Bezerra, R.E. Santelli, E.P. Oliveira, L.S. Villar, and L.A. Escaleira, Talanta76, 965–977 (2008).
(7) N. Junior, C. Augusto, A. Melo, C. Pinho, R.C. Coneglian, A.G. Soares, and I.M. Ferreira, J. Chemometrics28, 716–724 (2014).
(8) S. He, H. Wang, B. Wu, H. Zhou, P. Zhu, R. Yang, and X. Yan, Molecules 18, 408–417 (2012).

John KiratuJohn Kiratu is currently a graduate student at South Dakota State University, anticipating completing his degree in fall
2015. He has a M.S. in chemistry from the University of Nairobi (Kenya). His PhD research focuses on analyte collection following supercritical fluid extraction and the SFE of essential oils from natural products.

Douglas E. Raynie“Sample Prep Perspectives” editor Douglas E. Raynie is an Associate Research Professor at South Dakota State University. His research interests include green chemistry, alternative solvents, sample preparation, high resolution chromatography, and bioprocessing in supercritical fluids. He earned his PhD in 1990 at Brigham Young University under the direction of Milton L. Lee.
For more information on this topic, please visit www.chromatographyonline.com/column-sample-prep-perspectives

Thermodynamic Insights into Organic Solvent Extraction for Chemical Analysis of Medical Devices
April 16th 2025A new study, published by a researcher from Chemical Characterization Solutions in Minnesota, explored a new approach for sample preparation for the chemical characterization of medical devices.
Study Explores Thin-Film Extraction of Biogenic Amines via HPLC-MS/MS
March 27th 2025Scientists from Tabriz University and the University of Tabriz explored cellulose acetate-UiO-66-COOH as an affordable coating sorbent for thin film extraction of biogenic amines from cheese and alcohol-free beverages using HPLC-MS/MS.
Multi-Step Preparative LC–MS Workflow for Peptide Purification
March 21st 2025This article introduces a multi-step preparative purification workflow for synthetic peptides using liquid chromatography–mass spectrometry (LC–MS). The process involves optimizing separation conditions, scaling-up, fractionating, and confirming purity and recovery, using a single LC–MS system. High purity and recovery rates for synthetic peptides such as parathormone (PTH) are achieved. The method allows efficient purification and accurate confirmation of peptide synthesis and is suitable for handling complex preparative purification tasks.


