Variability - How to Control It
LCGC North America
Prompted by a recently reviewed manuscript and a question from a reader, John Dolan examines the variability of retention times observed in LC methods in this month's installment of "LC Troubleshooting."
The topic of this month's installment of "LC Troubleshooting" was prompted by a manuscript I recently reviewed and a question I received from a reader of this column. Both inputs related to the variability of retention times observed in liquid chromatography (LC) methods. Variable retention is a topic that has been touched on many times over the history of this column, sometimes just in passing, and other times in depth. Yet, it seems to be a problem that keeps recurring, so I think it is worth consideration again.

Sensitivity to Mobile Phase Composition
One case related to extreme sensitivity of the retention time to mobile phase composition. The method comprised a reversed-phase separation of two isomers with molecular weights of approximately 400 Da, no ionizable functional groups, and a mobile phase of acetonitrile and water. Normally, the two isomers were separated by approximately 1 min, giving a resolution value of >2. Under isocratic conditions, a 1% change in acetonitrile caused a 2-min shift in retention times. When a shallow gradient was used (5% change in B over 10 min), a 1% shift in the starting and ending percentage of acetonitrile resulted in a 1-min shift in retention times. It is easily seen that with either method, a small error in mobile phase composition could change retention enough to cause peak misidentification if peaks were identified only by retention time.

John W. Dolan
A similar problem: I encountered a similar problem in my laboratory more than 10 years ago and shared it in this column (1). Because the symptoms were almost the same as those reported here, it is worth reviewing the problem and its solution. Our separation was of a 1000-Da peptide on a 250 mm × 4.6 mm, 5-μm reversed-phase column operated at 1.5 mL/min and 35 °C. A gradient of 19–24% acetonitrile–0.1% trifluoroacetic acid in water was run over 30 min. Even with freshly serviced pumps (new check valves and pump seals), retention varied by approximately 1 min over three consecutive runs, as illustrated in Figure 1a.

Figure 1
The source of the problem was related to the ability of the LC system to blend solvents on-line. Note that the gradient program for this method called for a small gradient range, 5%, over a long time, 30 min, or ♠0.17%/min. Most LC pump manufacturers specify a proportioning accuracy of ±0.5–1%. It is easy to see that we were asking for a gradient that required better control of the mobile phase mixture than the system specification.
The solution — premixing: The solution to this problem was quite simple. We premixed the mobile phases so that the A-reservoir contained 10% acetonitrile and 90% 0.1% trifluoroacetic acid in water; the B-reservoir was filled with 30% acetonitrile and 70% of the trifluoroacetic acid mixture. The system controller was reprogrammed to deliver a gradient of 40–65% B over 30 min for an effective gradient of 18–23% acetonitrile–trifluoroacetic acid over 30 min (compared to the original 19–24% gradient). Under these conditions, the retention range for three consecutive injections was <0.1 min (see Figure 1b). From the standpoint of the LC system, the gradient was 25% over 30 min, or ♠0.8%/min, a fivefold reduction in the programmed gradient slope. Clearly, the system was able to produce this level of performance quite nicely.
We could have put 15% acetonitrile in A and 25% acetonitrile in B and adjusted the program accordingly for even better control. Why not start with 19% acetonitrile in A and 24% acetonitrile in B and just program a 0–100% gradient? When retention is so sensitive to small changes in the mobile phase composition, the normal errors made in hand-mixing the solvents can be large enough to cause the method to fail. So by selecting the A- and B-solvent concentrations to be outside the desired range, there was room to "tweak" the initial and final program settings if necessary to adjust the retention to the desired result. For example, with a small error in the A or B formulation, we might get the desired results with a program of 41–64% B over 30 min instead of 40–65% B. It just leaves a small margin of safety.
My guess is that this premixing trick would solve the retention variability issue encountered in the original problem. A 1-min retention change with a 1% change in mobile phase composition was excessive, but premixing should minimize this problem. So instead of putting water in the A-reservoir and acetonitrile in B, one could put 5% acetonitrile in A and 15% acetonitrile in B. Now instead of setting the controller to deliver 10% B with ± 0.5–1.0% accuracy, the program would be set to 50% B and the effective accuracy would be increased by an order of magnitude to ± 0.05–0.1%. The method could then be written to allow the operator to adjust the programmed concentration in 0.1% increments within specified limits until the correct retention times were observed. A similar strategy could be taken with the shallow gradient used for the same sample.
An added bonus: Premixing the mobile phase has an added bonus for both isocratic and gradient methods, even if the conditions are not as demanding as those presented here. For our peptide method, we observed a significant reduction in baseline noise when we premixed the mobile phase. This is illustrated by comparing the two baselines shown in Figure 2. An approximately fivefold reduction of noise is observed with premixing, which corresponds to the mobile phase ratio changes. That is, the original method used trifluoroacetic acid–water in A and acetonitrile–trifluoroacetic acid in B (100% range, Figure 2a) and the revised conditions used 10% acetonitrile in A and 30% in B (20% range, Figure 2b), for a fivefold reduction in range. Reduced baseline noise with mobile phase premixing is a very common observation and is certainly is not a newly discovered phenomenon (for example, see reference 2). Even premixing 5% of the B-solvent in A and 5% of the A-solvent in B will have beneficial results for many methods.

Figure 2
Initial Drift
The second problem relates to the observation that the retention time for the first few injections of a batch of samples drifts gradually until a constant retention time is obtained. The reader observed the problem with a preparative separation — the retention time drifted over the first 15 injections until it settled down to a constant value. This is one of those problems that cannot be classified as common, but occurs often enough that it is not uncommon, either. It occurs with analytical runs, too, and is fairly common with separations of proteins and peptides.
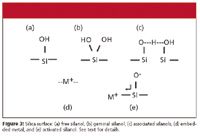
The silica surface: The source of the problem lies with the stationary phase. The silica particle that serves as the support material for the bonded phase columns used in reversed-phase LC comprises an amorphous polymer of silicon and oxygen. At the surface of the particles, the polymer terminates in silanol (-Si-OH) groups. We tend to think of these as individual silanols, as illustrated in Figure 3a, but the work of Kirkland (3) and others has shown that the surface is much more complicated. For example, the silanols also can exist in a geminal configuration (Figure 3b), or if spaced correctly, the proton can be shared between two adjacent silanols to form associated silanol groups (Figure 3c). Free silanols are more acidic than geminal and associated silanols. Older, Type A silicas contained significant amounts of metals (such as aluminum and iron, Figure 3d), which could supply ion exchange sites for acidic sample components, and, if positioned properly, could withdraw electrons from an adjacent silanol to make an ionized, or "activated" silanol (Figure 3e). The current generation of high-purity, Type B silica minimizes the metal content and the more acidic free silanols, so that the preponderance of the surface is represented by the geminal and associated silanols (Figure 3b and c). This makes the surface much less likely to cause peak tailing of basic compounds.

Figure 3
The bonded phase is attached to the surface via a silyl ether bond (-Si-O-Si-R, where R is the C18 or other bonded phase function). The bonded phase covers approximately half of the available silanol sites, so in its simplest description, the surface might contain 50% bonded phase and 50% unbonded silanol groups. It is likely that such descriptions of the silica surface are oversimplified, so other interactions are likely also.
The various surface characteristics (bonded phase, free silanols, metals, and so forth) have different capacities and equilibration rates, which can affect the appearance of the chromatograms. Many workers are familiar with the older Type A, acidic silicas that showed bad peak tailing for basic compounds. This was due to the interactions of basic functional groups with the ionic, activated silanol sites (Figure 3e). One widely used procedure to minimize tailing under these circumstances was to add triethylamine to the mobile phase (for example, 25 mM) to "swamp out" these ionic sites. The result was much better peak shape. This is no longer necessary with the higher purity, Type B materials, but these still contain surface characteristics with different equilibria and capacities.
So what?: The net result of the complex stationary phase surface is that every site does not equilibrate at the same rate for a given sample compound. Sometimes it is necessary to inject several times until the slowly equilibrating sites are saturated sufficiently with sample and no longer have a net change when a new sample is injected. This procedure is commonly referred to as "priming" or "doping" the column. Although one can prime the column by making injections of sample or standard until retention stabilizes, it usually is faster to inject one or more high-concentration samples to accomplish the same result more quickly. Usually it is the total mass of sample that is important, not the time of exposure, so you can inject several high-concentration samples one after the other, then wait for the method to run, rather than making several individual runs.
Priming requirements vary greatly with the sample and the column surface, so it usually is best to take an empirical approach to priming. In the case of the preparative separation that prompted this discussion, it appears that it took 15 injections or so to equilibrate the column fully. I would try to shorten this process by injecting twice at ten times the concentration to see if this would have the same effect.
Even when priming is not an obvious requirement, as in the present case, there usually are a sufficient number of changes happening when a method is first started that it is best to ignore the first injection or two. For example, in one laboratory I have contact with, most methods suggest making two or three injections at the high end of the standard curve before the first system suitability runs are made. These injections act as priming injections, and even if they are not needed, it is one of those cases where a little extra time invested up front never hurts and might help.
Summary: PPPPP
The two examples that prompted this month's discussion have a common theme in the solution. If you have a good understanding of the characteristics of the LC equipment and the separation process, you can make appropriate adjustments so that consistently good results are obtained. This reminds me of a saying of one of my friends who runs a small business. He's always telling his employees, "Remember the five P's." These stand for Prior Planning Prevents Poor Performance. And although his business supplies feed products for the local farms and dairies, his five P's make just as much sense for those of us working in analytical chemistry.
John W. Dolan "LC Troubleshooting" Editor John W. Dolan is Vice-President of LC Resources, Walnut Creek, California; and a member of LCGC's editorial advisory board. Direct correspondence about this column to "LC Troubleshooting," LCGC, Woodbridge Corporate Plaza, 485 Route 1 South, Building F, First Floor, Iselin, NJ 08830, e-mail John.Dolan@LCResources.com
For an ongoing discussion of LC trouble-shooting with John Dolan and other chromatographers, visit the Chromatography Forum discussion group at http://www.chromforum.com.
References
(1) D.H. Marchand, P.-L. Zhu, and J.W. Dolan, LCGC 14(12), 1028–1033 (1996).
(2) J.W. Dolan, LCGC 7(1), 18–24 (1989).
(3) J. Köhler, D.B. Chase, R.D. Farlee, A.J. Vega, and J.J. Kirkland, J. Chromatogr. 352, 275 (1986).

Common Challenges in Nitrosamine Analysis: An LCGC International Peer Exchange
April 15th 2025A recent roundtable discussion featuring Aloka Srinivasan of Raaha, Mayank Bhanti of the United States Pharmacopeia (USP), and Amber Burch of Purisys discussed the challenges surrounding nitrosamine analysis in pharmaceuticals.


