High-Throughput Quantitative LC-MS-MS Assays by On-Line Extraction Using Monolithic Support
LCGC North America
LC-MS-MS has become a widely used technique for the fast and sensitive quantitation of small molecules. In this article, this approach has been extended to high-throughput quantitative LC-MS-MS analysis under GLP applications for a drug candidate in development from preclinical animal studies through clinical development.
Today, due to its inherent specificity and sensitivity, the most prevalent bioanalytical technique in drug development is liquid chromatography tandem mass spectrometry (LC–MS-MS). This technique is regarded widely as the preferred tool for quantitative determination of drug and metabolites from biological matrices including plasma, blood, urine, and tissues (1). Samples from biological matrices usually are not compatible with direct LC–MS-MS analyses. Conventional sample preparation techniques for LC–MS-MS traditionally employ protein precipitation, liquid–liquid extraction, or solid-phase extraction (SPE). Manual operations associated with these processes are labor intensive and time-consuming. An alternative sample extraction method that has generated much interest in recent years is the direct injection of plasma using on-line extraction (2–9). A major advantage of on-line SPE over off-line extraction techniques is that the sample preparation steps are embedded into the chromatographic separation and, thus, it eliminates much of the time required for sample preparation. Different extraction supports have been developed, allowing direct injection of biological fluids or extracts for various applications. These extraction supports include restricted-access media (RAM) (2,3), large-size particle (4,5), monolithic material (6–8), and disposable cartridges utilizing traditional packings such as those used in Spark-Holland (Plainsboro, New Jersey) systems (9). In some techniques, a single column can serve as both the extraction and analytical column, but most on-line SPE approaches use column-switching to couple with the analytical columns.
Monolithic columns have attracted considerable interest in recent years for fast chromatographic separation (10–12). Because of their high permeability, separations on monolithic columns can be performed at a flow rate 5–10 times higher than that generally used with conventional supports. Monolithic phases produced by the sol-gel polymerization technology do not require frits at column extremities, thus, eliminating a main source of back pressure due to endogenous material adsorption. In addition to fast chromatographic separation, monolithic phases have been explored as extraction supports for on-line SPE (6,7). Plumb and colleagues (6) reported direct analysis of a candidate pharmaceutical compound in human plasma using a monolithic column with steep gradient and high flow rates. The monolithic columns showed robustness with nearly 300 injections of 20 μL of plasma (diluted 1:1 with water) onto one column without a significant deterioration in performance. A limit of quantification of 5 ng/mL was achieved by this system. Resolution was maintained but some anomalous results and a high variation at the low end of the standard curve were observed. Hsieh and colleagues (7) developed an LC–MS-MS method using monolithic silica column for the high-speed direct determination of a drug candidate and its major circulating metabolite in rat plasma. This method made use of flow programming on a monolithic silica column for removal of protein and chromatographic separation without the need for significant sample preparation. After 200 plasma injections, consistent column efficiency of close to 39,000 theoretical plates/m and reproducible retention times for the analytes were reported. The method was demonstrated to be reproducible, sensitive, and applicable for high-throughput PK screening applications.
We previously described an automated procedure using on-line extraction with monolithic sorbent for pharmaceutical component analysis in human plasma by LC–MS-MS (8). A short monolithic C18 cartridge was used for high-flow extraction at 4 mL/min. Plasma samples were subjected to a simple protein precipitation by acetonitrile, before the supernatant was diluted and loaded directly onto the monolithic cartridge. Sample elution was accomplished with a narrow-bore LC–MS-MS system. A method for determination of amprenavir and atazanavir in human plasma was developed. With this approach, a total analysis time of 4 min/sample was achieved.
In this article, an on-line extraction approach using a monolithic support was applied to LC–MS-MS analysis of a drug candidate, Compound A, which is currently under development by Abbott Laboratories. Three separate assays in rat, monkey, and human plasma have been validated under GLP regulations for preclinical and clinical applications.
Experimental
Chemicals: Acetonitrile, methanol, acetic acid, and dimethyl sulfoxide (DMSO) were purchased from EMD Chemicals (Gibbstown, New Jersey). Compound A and its internal standard, d5 -labeled Compound A, were synthesized by Abbott Laboratories (Abbott Park, Illinois). Normal rat plasma, monkey plasma, and human plasma with potassium EDTA as anticoagulant were purchased from Biological Specialties Corporation (Colmar, Pennsylvania) or Lampire Biological Laboratories (Pipersville, Pennsylvania).
Standard and quality control solutions: Stock solution was prepared in DMSO and working solutions were prepared by diluting the stock solution with DMSO. Standard samples and quality control (QC) samples were prepared from separate weighing. Both standard and QC samples were prepared by adding the appropriate volume of stock solution or working stock solution into a 25-mL class A volumetric flask and diluting to the mark with plasma. Standard and QC samples were then aliquoted into polypropylene tubes and stored in a freezer maintained at approximately -20 °C.
Sample preparation for on-line extraction: All steps of sample preparation were handled in a semia-utomated fashion. Sample transfer steps were performed by a liquid handler with positive displacement capability (Hamilton Lab AT 2 Plus, Reno, Nevada). Plasma sample was loaded into the appropriate well of a clean 2.0-mL polypropylene 96-well plate. After addition of internal standard (IS) solution, acetonitrile was added to the plate. The plate was sonicated, vortexed, and centrifuged to sediment plasma protein. A portion of supernatant was transferred from each well to a clean 96-well plate and diluted with 0.01% acetic acid. After mixing, a portion of the solution was injected into LC–MS-MS system configured for on-line extraction. Table I summarizes volumes for sample, acetonitrile, supernatant transferred (transfer volume), diluent, and injection used in rat, monkey, and human plasma assays.

Table I: A summary of volumes for sample, acetonitrile, supernatant transferred, diluent, and injection in rat, monkey, and human plasma assays
LC–MS-MS instrumentation: An Agilent 1100 pump (Hewlett-Packard, Waldbronn, Germany) with a two-way solvent selector (Parker Instrumentation, Fairfield, New Jersey) was used to deliver a high flow through the extraction column to load and wash the sample and subsequently to flush and equilibrate the extraction column. A Shimadzu LC-10ADvp pump (Shimadzu, Columbia, Maryland) was used to deliver mobile phase. The mobile phase was used to elute the analytes from the extraction column and to perform separation on the analytical column, as well as to wash both the syringe and the autosampler injector. A Shimadzu SIL-HTC autosampler–controller was used to inject samples. A 10 mm × 4.6 mm Chromolith RP-18e cartridge (Merck KGaA, Darmstadt, Germany) was used as the extraction column. A Valco 10-port valve (Valco Instruments, Houston, Texas) was used to control on-line extraction and liquid flow to the mass spectrometer as shown in Figure 1.
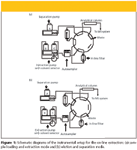
Figure 1
A 100 mm × 2.1 mm, 3.5-μm Agilent Zorbax SB-C18 column was used as the analytical column. An isocratic LC method was employed for separation. Mobile phase (solvent A) composition was approximately 80:20:0.5% (v/v/v) methanol–water–acetic acid. The flow rate for this program was set to 0.25 mL/min. The analytical column was maintained at room temperature. LC–MS-MS detection was performed using an API 4000 (Applied Biosystems) triple-quadrupole mass spectrometer with an electrospray ionization source operated in the positive ion mode. The computer control system was Analyst version 1.3.2, Applied Biosystems, Totonto, ON, Canada. The selected reaction monitoring (SRM) detection channel for Compound A was m/z 349.2 to 173.1with collision energy setting at 25 V. The SRM detection channel for IS was m/z 354.2 to 178.1 with collision energy setting at 25 V.
System operation for the on-line extraction procedure: After the diluted supernatant from the plasma precipitation was injected by the autosampler, the sample was loaded onto the extraction column using solvent B, 40:60:0.1% (v/v/v) methanol–water–acetic acid, at a flow rate of 4 mL/min. After loading, the valve was switched to the elution position, which positioned extraction and analytical columns in tandem in the flow path of the separation pump (Shimadzu). The separation pump, running an isocratic flow of mobile phase (A), eluted the analytes to the mass spectrometer without the need of diverting. After the elution step, the switching valve was switched back to the original position (configuration (a) in the Figure 1). The extraction pump (Agilent) then delivered solvent C, 95:5:0.1% (v/v/v) methanol–water–acetic acid, at a flow rate of 4 mL/min to flush the extraction column. For the rest of the run cycle, the extraction pump delivered solvent B at 4 mL/min to reequilibrate the extraction column for the next sample. The runtime for the assay of one sample was 4 min. An example of the time program of the Agilent 1100 pump for the on-line extraction is listed in Table II.

Table II: An example of a timing program on an Agilent 1100 pump for on-line extraction
The autosampler–controller sent the signal to inject the sample and to start the program on the extraction pump. It also sent out a signal to the mass spectrometer to start the data acquisition. For overnight operation, a contact-closure signal was sent from the autosampler–controller to the extraction pump to shut down the pump at the end of sample analysis.
Calibration curves and quantitation of samples: AnalystTM version 1.3.2 was used for the data acquisition, peak area integration, regression analysis, and quantitation. For each analytical batch, a calibration curve was derived from the peak area ratios (analyte/internal standard) using weighted linear least-squares regression of the area ratio versus the concentration of the standards. A weighting of 1/x2 (where x is the concentration of a given standard) was used for curve fitting. The regression equation for the calibration curve was used to back-calculate the measured concentration at each standard level and the results were compared with the theoretical concentration to obtain the accuracy, expressed as a percentage of the theoretical value, for each standard level measured.
Results and Discussion
The on-line extraction approach using the monolithic support described here stems from a dilute-and-shoot scheme. Sample preparation with protein precipitation is a commonly used technique in bioanalysis for plasma samples because of its simplicity. However, when analyzing supernatant from a plasma sample using protein precipitation, salts and endogenous materials that are still present can cause ion suppression or enhancement leading to higher sample-to-sample variation in results. Our approach simply combines protein precipitation and solid-phase extraction. On-line extraction efficiently adds another dimension of sample purification to protein precipitation by taking advantage of high speed loading, extraction, and washing on the monolithic support. The extra dimension is added without additional sample preparation time or procedures because it is highly automated. During method development for Compound A, loading and washing solutions were selected to ensure retention of analyte and IS on the monolithic support during the loading cycle and to eliminate or minimize carryover after the washing cycle.
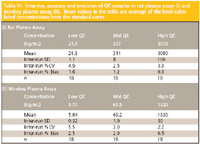
Table III: Inter-day accuracy and precision of QC samples in rat plasma assay (I) and monkey plasma assay (II). Mean values in the table are average of the back-calculated concentrations from the standard curve
For validation purposes, three consecutive analytical runs, each containing a calibration curve and QC samples, were used to assess precision and accuracy. The precision and accuracy results for QC samples from the rat and monkey plasma assays are summarized in Table III. The data show that this method is consistent and reliable with low %CV and %bias values. The interday bias and CV of the quality control samples were ≤2.9% and ≤5.5%, respectively, for both assays. Figure 2 shows representative ion chromatograms of an extracted blank sample, a mid QC sample, and a lower limit of quantitation (LLOQ) sample from the rat plasma assay.
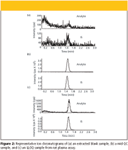
Figure 2
Both rat plasma assay and monkey plasma assay performed well in preclinical studies under GLP regulations. In a rat one-month toxicology study with 1080 samples analyzed, 23 96-well runs were performed without failed runs. Mean bias for all standards was between –2.6% and 2.6% and CV was less than 4.1%. Coefficient of determination (r2 ), a measurement of linearity, was greater than 0.997 for all runs. Mean bias for all QC levels was between –1.3 and 2.2 % with CV ≤ 11%. In a monkey one-month toxicology study with 644 samples analyzed, 12 runs were completed without a failed standard or QC sample. Mean bias for all standards was between –3.2% and 1.8% and CV was less than 5.8%. The r2 value was greater than 0.996 for all runs. Mean bias for all QC levels was between 0.5 to 4.9 % with CV ≤ 4.8%.
The on-line extraction with monolithic silica support works well at reduced flow rates. In contrast with turbulent flow chromatography SPE using large particles, the flow inside monolithic columns remains laminar at either low or high flow rates. When the flow rate for loading and washing on the monolithic cartridge was dropped from 4 mL/min to 2 mL/min in the rat plasma assay, no noticeable difference in assay performance was observed.
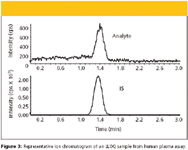
Figure 3
When Compound A was moved forward to clinical development, a much lower quantitation limit was required due to the efficacy and safety profile of the compound in development. Dosage level selection in a first-in-human study called for analyte concentration to be in the range of mid-picogram per milliliter to upper nanogram per milliliter. A human plasma assay with a dynamic range of 0.077–130 ng/mL was developed to satisfy the clinical needs. The increased "mass on column" required for the low level of quantitation was accomplished by on-line concentration of analyte on the monolithic extraction column. As summarized in Table I, an injection volume of 385 μL was used in the human plasma assay. Loading this large volume at a flow rate at 4 mL/min takes about 6 s, which is negligible in the total run time of 4 min. A representative chromatogram of an LLOQ sample is shown in Figure 3. Estimated signal-to-noise ratio at LLOQ was greater than 20:1 for the analyte, which demonstrated that sufficient sensitivity was achieved. A summary of calibration curves obtained from three precision and accuracy runs of human plasma assay is shown in Table IV. The r2 value was greater than 0.999. The precision and accuracy results for QC samples in human plasma assay are summarized in Table V. The inter-day bias and CV of the quality control samples were ≤10.8% and ≤6.8%, respectively.

Table IV: Summary of calibration curves obtained for the human plasma assay. Mean values in the table are average of the back-calculated concentrations from the standard curve
In high-throughput LC–MS-MS analysis, matrix effect is one of the major issues to be addressed in method development and validation due to its unpredictable characteristics (13–15). To demonstrate that the assay performance is independent from the sample matrix, low QC evaluation samples were prepared in six different matrix lots. The accuracy and precision of these low QC evaluation samples, in replicates of six, were determined with the same calibration curve. The accuracy (%bias) of these evaluation samples for Compound A was ≤8.0% and the precision (%CV) was ≤3.4% for rat, monkey, or human plasma assay. The results, summarized in Table VI, suggested that matrix effect for the assay was well within the measurement errors. Extraction recovery was determined by comparing the response factors (area/on-column amount) of the appropriate peaks of extracted QC samples with those of neat control samples at similar concentrations. Almost 100% extraction recovery was determined for all three assays as summarized in Table VI. Carryover has been monitored routinely in assay validation and sample analysis. It is evaluated as the ratio of peak area of the analyte in a blank injection to that from a previous high concentration sample. In most cases, carryover has been maintained below 0.1% for Compound A. Over time, minor autosampler and injection valve maintenance was required to keep carry-over in check. Overall, the on-line system was found to be very rugged for the analysis of plasma samples after a simple protein-precipitation treatment. Because of the highly-porous nature of monolithic extraction column, the back pressure generated at 4 mL/min was very low (approximately 175 psi). The back pressure on the extraction column and the analytical column remained constant after more than 400 injections of samples from rat, monkey, or human plasma. In our experience, at least four 96-well runs could be analyzed without any degradation of performance with human plasma and the column appeared to be much more robust in the rat and monkey plasma assays.

Table V: Inter-day accuracy and precision of the QC samples for human plasma assay. Mean values in the table are average of the back-calculated concentrations from the standard curve
Conclusion
The on-line extraction approach with a monolithic support has been applied successfully to method validation and sample analysis for a drug candidate to satisfy preclinical and clinical development needs. The approach provides high-throughput, on-line concentration, and rugged performance to multiple studies performed in a GLP-regulated laboratory. The approach can be generic for method development of other drug candidates if the compounds of interest can be retained on the monolithic support. Due to limited commercial availability of different monolithic materials, the full potential of using monolithic-phases as extraction supports remain to be explored. New types and dimensions of monolithic sorbents will further expand the capability of the approach.

Table VI: A summary of matrix effect and extraction recovery results for rat, monkey, and human plasma assays
Raymond Naxing Xu, Grace E. Kim, Brian Boyd, Jill Polzin, Matthew J. Rieser, and Tawakol A. El-Shourbagy
Abbott Laboratories, 100 Abbott Park Road, Abbott Park, IL
Please direct correspondence to Raymond Xu at Raymond.Xu@abbott.com
Reference
(1) M. Jemal and Y.-Q. Xia, Curr. Drug Metab. 7, 491–502 (2006).
(2) J.L. Veuthey, S. Souverain, and S. Rudaz, Ther. Drug Monit. 26, 161–166 (2004).
(3) A. Vintiloiu, W.M. Mullett, R. Papp, D. Lubda, and E. Kwong, J. Chromatogr A. 1082, 150–157 (2005).
(4) X.S. Xu, K.X. Yan, H. Song, and M.W. Lo, J. Chromatogr B Analyt Technol Biomed Life Sci. 814, 29–36 (2005).
(5) X. Zang, R. Luo, N. Song, T.K. Chen, and H. Bozigian, Rapid Commun Mass Spectrom. 19, 3259–3268 (2005).
(6) R. Plumb, G. Dear, D. Mallett, and J. Ayrton. Rapid Commun. Mass Spectrom. 15, 986–993 (2001).
(7) Y. Hsieh, G. Wang, Y. Wang, S. Chackalamannil, and W.A. Korfmacher. Anal. Chem. 75, 1812–1818 (2003).
(8) R.N. Xu, L. Fan, G.E. Kim, and T.A. El-Shourbagy, J. Pharm. Biomed. Anal. 40, 728–736 (2006).
(9) Y. Alnouti, M. Li, O. Kavetskaia, H. Bi, C.E. Hop, and A.I. Gusev, Anal Chem. 78, 1331–1336 (2006).
(10) T. Ikegami and N. Tanaka, Curr. Opin. Chem. Biol. 8, 527–533 (2004).
(11) K. Cabrera, J. Sep Sci. 27, 843–852 (2004).
(12) H. Zeng, Y. Deng, and J.T. Wu, J. Chromatogr B Analyt Technol Biomed Life Sci. 788, 331–337 (2003).
(13) B.K. Matuszewski, J. Chromatography B 830, 293–300 (2006).
(14) S. Zhou, H. Zhou, M. Larson, D.L. Miller, D. Mao, X. Jiang, and W. Naidong, Rapid Commun. Mass Spectrom. 19, 2144–50 (2005).
(15) E. Stokvis, H. Rosing, L. Lopez-Lazaro, J.H. Schellens, and J.H. Beijnen, Biomed. Chromatogr. 18, 400–402 (2004).
Common Challenges in Nitrosamine Analysis: An LCGC International Peer Exchange
April 15th 2025A recent roundtable discussion featuring Aloka Srinivasan of Raaha, Mayank Bhanti of the United States Pharmacopeia (USP), and Amber Burch of Purisys discussed the challenges surrounding nitrosamine analysis in pharmaceuticals.


