Utility of the Summation Chromatographic Peak Integration Function to Avoid Manual Reintegrations in the Analysis of Targeted Analytes
LCGC North America
We present an empirical assessment of summation integration involving 490 low-pressure GC–MS/MS analyses of 70 pesticides in 10 common fruits and vegetables over the course of 10 days.
Conventional chromatographic peak integration functions rely on complex software and settings, but untrustworthy integrations still routinely lead to time-consuming manual review and reintegrations. Current rugged gas chromatography–tandem mass spectrometry (GC–MS/MS) and liquid chromatography (LC)–MS/MS methods typically only need milligram or microgram amounts of equivalent injected sample to achieve <10-ng/g limits of quantification (LOQ) and identification (LOI), while also yielding very consistent retention times (tR) and peak widths. This reliability permits use of the summation peak integration function, which simply draws a baseline from preset start and stop times and records the signal (or noise) above that line. Then analyte identification is made automatically via postrun data processing by taking defined criteria into account (for example, concentrations greater than the LOQ with the correct ion peak ratios). In this study, an empirical assessment of summation integration (using the lowest baseline point in user-defined tR windows) was conducted involving 490 low-pressure GC–MS/MS analyses of 70 pesticides in 10 common fruits and vegetables over the course of 10 days.
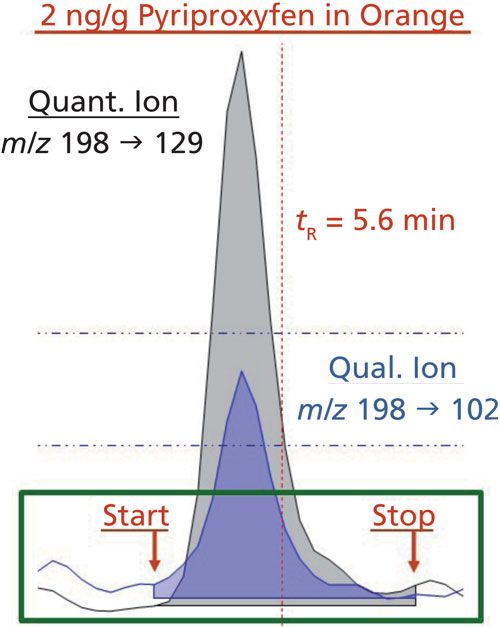
Peak integration is a fundamental aspect of universal importance in chromatography for analytical purposes (1–3). Many publications for decades have described theory and propose new practices for chromatographic peak integration using different algorithms (4–13). Despite long-standing efforts to devise automatic, consistent, and accurate peak integration tools, current instrument software programs still routinely require human review and manual reintegrations. In many applications, no analyst should blindly trust instrument software programs to integrate all peaks perfectly, and review of integration results has remained a standard quality control (QC) practice since the development of electronic peak integrators more than 50 years ago.
In the past, applications typically involved relatively few analytes and a limited number of samples, thus data review and reintegrations were not too onerous. Also, sample preparation and chromatographic separations used to limit sample throughput, but newer techniques permit automated high-throughput sample preparation followed by gas chromatography–mass spectrometry (GC–MS) or liquid chromatography (LC)–MS analysis of hundreds of targeted analytes in 10 min each (14–16). It is not uncommon in pesticide residue analysis in foods, for example, to monitor 175–650 analytes (17–19). Parallel GC–MS and LC–MS sequences of more than 100 samples each may be analyzed in less than 24 h, generating >100,000 peak integrations including additional ions needed for analyte identification purposes (14–22). Even though human judgment has been shown to outperform instrument integration software in practice (22), human review of this amount of data is simply too time-consuming and impractical in routine applications. Even so, the data review task involves mind-numbing tediousness, and all humans make misteaks (20). Therefore, fully automated and reliable peak integration methods are an essential ingredient for multianalyte high-throughput applications.
Another drawback with current practices is that each manual reintegration requires notation in the report, justification by the analyst, and additional review by a quality assurance officer. Otherwise, an unethical analyst can manipulate peak integrations in any way needed to achieve a desired outcome, such as improved calibrations. Regulatory entities prefer standardization of protocols, including data handling, to achieve consistently reproducible outcomes, which calls for as few manipulations as possible, even if they can be justified.
A fundamental problem is that increasingly sophisticated and complex software programs tend to involve many options and parameters that need to be understood, chosen, and optimized, including baseline factors, smoothing, signal and noise thresholds, retention time (tR) windows, peak splitting, and tailing factors. In multiresidue applications involving diverse ultratrace analytes and sample types, variables change from analyte to analyte, matrix to matrix, day to day, and even injection to injection that often do not permit a single set of integration settings to work consistently. All practicing chromatographers have the common experience of spending many frustrating hours trying to optimize integration conditions for their analyses, only to find that manual reintegrations are still needed when they implement their methods.
Summation Function Integration
Rather than relying on sophisticated software programs to integrate chromatographic peaks, a simpler and more reliable way to make integrations of known analytes with known tR and peak width is to set the integrator start and stop times to cover the time window where the peak is expected to appear. That tR window is integrated whether an actual peak is present or not, and integrated area or peak height may be used as the analytical signal. This approach is generally known as summation integration because it is often used when more than one peak is integrated together. The same integration concept may also be called by other names, but it is widely available in software packages for implementation by analysts in situations when their more sophisticated integrator functions fail. If summation integration is the foolproof backup approach, why shouldn’t it be used all the time?
Figure 1 (top) demonstrates the problem with conventional integrations in a high-throughput isocratic ultrahigh-pressure liquid chromatography–tandem mass spectrometry (UHPLC–MS/MS) analysis of duplicate 10-ng/g matrix-matched calibration standards for aldicarb in cucumber. Although chromatographic separation is decidedly poor in this example, misintegration of peaks in similar ways is a daily occurrence in real-world analyses at ultratrace levels. In the case of summation integration (Figure 1, bottom), the exact same duplicate chromatograms are integrated consistently at the known tR and peak width for the targeted analyte. A human could not be more consistent at integration than this, and manual reintegrations would be purely subjective tinkering unless the start and stop times are adjusted equally for all injections. Furthermore, the summation approach integrates all MS/MS ion transitions at the same start and stop times, which is essential for qualitative purposes because coelution of different ion peaks for the same analyte is a precondition for identification (20,21). In quantitative and qualitative analysis of targeted analytes, which covers the vast majority of chromatographic and capillary electrophoretic applications, the summation integration function is the simplest and most reliable approach provided that the tR and peak widths are consistent. In fact, setting user-defined integrator start and stop times was the norm in the early days of chromatography instruments when electronics had greatly limited capabilities (23).
Figure 1: Isocratic UHPLC–MS/MS analysis in a high-throughput application of replicate A and B matrix-matched calibration standards of 10-ng/g aldicarb in cucumber extracts integrated using a traditional software peak integrator with typical settings as shown (top) compared with the simpler and more consistent summation integrator (bottom). In the traditional approach, no single set of adjusted parameters will lead to consistent integrations in the duplicate injections.
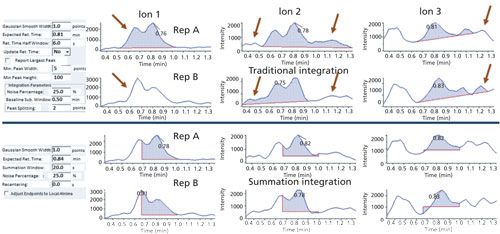
If summation integration works so well, why didn’t it remain the standard approach to the present day? Of course, summation integration is not a panacea, as can be observed in Figure 1 where the apex of an interferant is taller than the analyte peak, but this is also the case with more sophisticated integrators. Two major problems with summation integration led to more advanced integrator functions as computers and software improved:
- First, the tR and peak shapes (for example, tailing) varied too greatly when older instruments and methods were used, which required frequent adjustment of start and stop times to cover only the analyte peaks.
- Second, the selectivity of the detectors, including low-resolution MS, was insufficient to avoid interferences, which made it very difficult to integrate only the analyte peak and not nearby interfering peaks.
In ultratrace applications using instruments that lacked sensitivity, the first problem was exacerbated by the injection of rather large amounts of equivalent sample generated using complicated sample preparation methods. The coextracted matrix components would dirty the chromatographic systems, leading to greater maintenance needs and higher limits of quantification (LOQs) and limits of identification (LOIs).
For general purposes, LOQ is the concentration at which the quantification ion in MS or MS/MS yields a signal-to-noise ratio (S/N) of 10, and LOI is the concentration at which the least sensitive qualifier ion also yields S/N of 10. Depending on the application, LOI may also be defined as the concentration at which the rate of false negatives is <5–10% provided that false positives are also acceptably low (20,21). In summation integration, peak area or height may be used as signal, and noise is the standard deviation (σ) of the signal from replicate injections (ideally ≥16) of diverse matrix or reagent blanks. If the integrated signal exceeds the average background response by a factor of 10σ, then it may be reported as a determined concentration, and if predefined identification criteria (for example, matching ion ratios) are also met, then the analyte is identified.
Consistency of tR and Peak Width
Nowadays, highly sophisticated techniques, electronics, and high-quality manufacturing, including very consistent chromatographic and sample preparation materials, enable exceptional method performance in precision, sensitivity, selectivity, and ruggedness. UHPLC, multidimensional chromatography, MS/MS, high-resolution MS, and a host of other technologies have revolutionized analytical chemistry, and they allow adequately low LOQs and LOIs for ultratrace purposes while injecting merely milligram or microgram amounts of equivalent sample into the instruments. This decreased sample requirement not only serves to increase instrument reliability (reduced maintenance and downtime), but it also enhances analytical performance and method ruggedness. For instance, recent studies of fast, low-pressure GC–MS/MS and UHPLC–MS/MS have demonstrated tR for hundreds of analytes to fall within ±2 s and ±4 s, respectively, from the average over the course of hundreds of injections in several days (14–16).
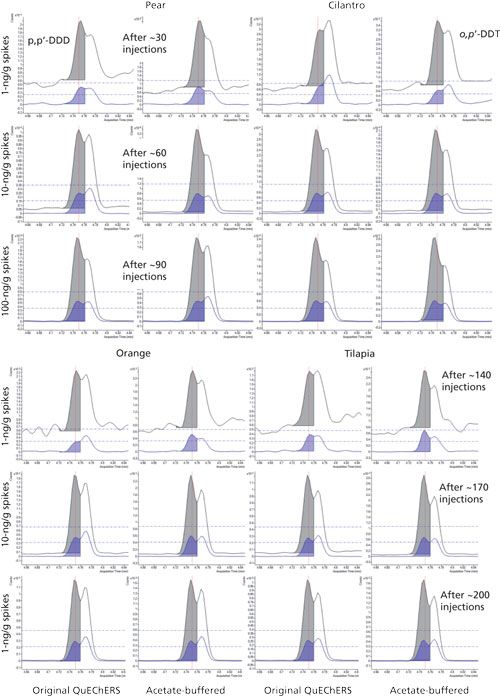
Figure 2 demonstrates the consistency of tR in the low-pressure GC–MS/MS analysis of coeluted p,p′-DDD and o,p′-DDT using split injection (100 µg sample equivalent) of different food matrices and sample preparation conditions. Very consistent integrations were achieved using the same preset start and stop times for ~200 injections over two days. Even though each analyte with the same ion transitions was not fully separated chromatographically, they were consistently integrated separately, leading to correlation coefficients (R2) > 0.995 in calibration curves for each compound. In this manner, summation integration not only provides trustworthy automatic integrations, but also reduces the degree of separation efficiency needed to yield acceptable quality of results in faster analyses.
Figure 2: High-throughput low-pressure GC–MS/MS analysis of p,p’-DDD and o,p’-DDT in spiked food samples using different QuEChERS extraction methods integrated by the summation function with the same start and stop times over the course of ~200 injections in two days. Isobaric ion transitions for different analytes in MS/MS do not need to be fully resolved chromatographically to still achieve consistent results for each analyte via summation integration.
When analyte peaks are known to only occur at a very narrow tR window with low chance of interferences, then the simplistic summation integration function best meets the need in high-throughput applications for automatic, accurate, and trustworthy data processing methods. If not for chemical interferences, summation integration could have been the default integrator for many years in methods using tR-locking (24). In cases when interferences are present, then all peak integrators (including human judgment) have difficulties, but at least summation has the advantage to most consistently integrate the same tR overlap of chemical noise in the result. Unlike traditional integrators that are easily fooled by indirect matrix effects or misshapen peaks, summation integration works reliably even if chromatographic peak shape is poor.
The aim of this work is to reintroduce the practical value of the summation chromatographic peak integration function through an empirical assessment of LOQs, LOIs, and rates of false positives and negatives in the low-pressure GC–MS/MS analysis of 70 targeted pesticides in 490 samples consisting of 10 common food matrices over the course of 10 days. Furthermore, a comparison of results using peak heights and areas was made to test the hypothesis that peak area signals would yield more precise results, leading to lower LOQs and LOIs.
The 70 targeted pesticides and 10 commodities chosen for study were selected according to findings in the Pesticide Data Program (25), and the original QuEChERS (quick, easy, cheap, effective, rugged, and safe) method was used for extraction (26). Please see the supplemental online information for full description of the methods and experiments (www.chromatographyonline.com/supplementary-information-Lehotay-July2017).
Calculation of LOQs and LOIs
LOQs for each unspiked and nonincurred analyte in each matrix were calculated from equation 1:

in which slope (or sensitivity) is the linear best-fit slope from the matrix-matched calibration curve (based on peak height or area,) and σ is the standard deviation of the summation function integrated signals (peak height or area) for the MS/MS quantitative ion transition from the analyses of the 33 blank matrix samples (n = 21 for diazinon, tetraconazole, and pyriproxyfen). The LOI in matrix was calculated using the same equation for the qualitative ion transition. Spiked pesticides were excluded from the LOQ and LOI calculations in all matrices except banana, and incurred pesticides present in the samples were excluded from the results for those matrices in which they were identified. Reagent-only calibration slopes were used to determine LOQs and LOIs in acetonitrile, and σ was calculated from six different injections of reagent solutions spread throughout the sequence.
Identification criteria were met if the qualitative–quantitative ion ratios (integrated peak heights or areas) fell within ±10% absolute (14,15,20) from the average ion ratio for the three highest concentration calibration standards in acetonitrile in each sequence. The quantitative ion was always set as the ion with the higher intensity.
Summation Integration in Practice
Procedurally, the summation integration using the vendor’s current software was set by eye during the first analytical sequence using the highest concentration standards in acetonitrile to adequately cover the full peak for each analyte plus ~0.01 min additional time on both sides of the peaks. The tR and peak widths were always nearly exactly the same within a sequence, but the extra room in the time windows was added to cover day-to-day variations. Using the Agilent software, the lowest level between the start and stop times served as the baseline, always leading to a positive signal in the integrated result. After the start and stop times were set in the first sequence, only the high standard needed to be checked in subsequent sequences. Calibration curves were also checked, but R2 values were always ~1.000 and no reintegrations were conducted. Over time, the tR of the analytes became slightly shorter, especially for those that were eluted later. For example, indoxacarb had shifted by -0.011 and -0.012 min in the third (green bean) and ninth (potato) sequences, respectively. In all, little adjustments were made to 56 analytes in the third sequence and 37 in the ninth sequence (245 injections and 24 days later). Increased peak tailing was not observed in the study.
These small adjustments were made manually, which was rather fast and easy for the 74 targeted peaks in this analysis, but this becomes more onerous for hundreds of analytes using the current Agilent software. It is possible to automatically define tR from the analyte peak apexes (albeit care must be taken for isobaric peaks). As shown in Figure 1 with the Sciex software, an automatic tR update of integration start and stop times can be input universally or manually from ± tR rather than having to enter all start and stop times by hand.
Keys in the Analysis
In practice, this study took advantage of several helpful aspects leading to the improved ability to use accurate summation integration without analyst review:
- A state-of-the-art commercial triple-quadrupole GC–MS instrument provided high-speed, sensitive, selective, and precise detection of targeted analytes.
- Low-pressure GC–MS/MS is a faster and more rugged technique shown to give taller peaks with less tailing (and lower LOQs) than conventional GC–MS/MS (27).
- The microbore restrictor was inserted ~1 cm into the megabore analytical column, achieving zero dead volume, and the connection was made carefully using metal ferrules. Air and water checks at method operating conditions were also conducted before each sequence, and fittings were tightened, if needed, to ensure a leak-free system.
- A 1-m uncoated capillary integrated with the analytical column was placed into the continually hot transfer line, which avoids damage to the stationary phase because of coinjection of water and oxygen in every extract, even when the oven is cool. This approach improves long-term chromatographic performance and reduces column bleed.
- MS/MS dwell times were set to achieve at least seven points across analyte peaks to yield greater analytical accuracy than with fewer points (2).
- The column oven was reduced in volume by an oven pad, and it was controlled using the 220-V rapid heating option rather than the 110-V standard option in the Americas. Also, the column oven program was set to ensure that the temperature ramp rate never exceeded the instrument control capabilities.
- Each sequence began with an injection of acetonitrile to cycle the oven once before analyzing samples because tR is more consistent after the instrument electronics warm up.
- The ion source temperature and final oven temperature were 320 °C, the latter for 4.6 min at the end of each run, which helps sweep potential ghost peaks from the column and keep the ion source clean. After sequences, the oven was also kept at 250 °C for several hours to reduce the chance of ghost peaks.
- Split injection into an inert liner with glass wool was used, which is superior in chromatographic performance over splitless or programmable temperature vaporization methods of injection.
- Analyte protectants were incorporated in all injected samples, which have been shown to greatly reduce tailing of peaks in GC–MS/MS for analytes susceptible to the matrix-induced response enhancement effect (15,16,26–28). The analyte protectants also extend performance life of the GC–MS system by continuing to coat the active sites in the injection liner (including glass wool), columns, transfer line, and ion source, even if contaminating material has built up from previous injections.
- Final extracts contained 0.1% formic acid to improve stability of base-sensitive pesticides, such as chlorothalonil in this study.
- Sample preparation used minicartridge SPE to provide better cleanup than the more common dispersive-SPE approach after batch extraction.
Calibration and Identification
The LOQ and LOI calculations depend on the accuracy of the calibration slopes, and only standards that met identification criteria were included in the calibrations. In the case of peak area results, 89% of the analytes in the 10 matrix-matched extracts or daily-prepared acetonitrile calibration solutions (700 calibrations each) yielded R2 > 0.995 and only 1% had R2 < 0.990, whereas in the case of heights, 84–86% of calibrations had R2 > 0.995 and 2% gave R2 < 0.990. Despite the fact that peak areas provided better precision in the summation integrations at higher concentrations, peak heights were more consistent at lower concentrations.
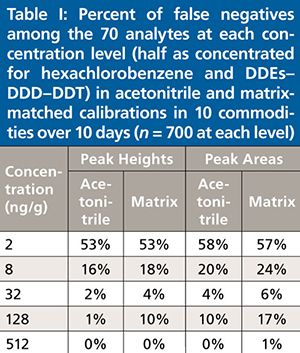
In terms of identification, the rates of false negatives in calibration standards can be used to assess the method performance in terms of both sensitivity and selectivity, which relates to the concept of detectability (21). Table I lists the percentage of false negatives versus concentration of the analytes in the acetonitrile and matrix-matched calibration standards based on the identification criteria stated in the experimental section. In the setting of reference ion ratios, nearly exactly the same result and precision was obtained whether peak heights or peak areas were used. Using peak height integration signals, however, led to appreciably fewer false negatives at all standard concentrations in solvent reagent or matrix extracts. The results in Table I show that 82% of the analyte–matrix combinations at 8 ng/g were identified accurately via peak height data, whereas using peak areas led to 76% correctly positive identifications (a difference of ~40 false negatives out of ~700 calibrations). This result supports the conclusion that peak heights yield lower LOIs than peak areas in the automatic summation integration approach used in this study.
False positives were more difficult to assess because of potentially real positives or carryover at low concentrations, but both approaches gave 4–5% positives for samples thought to be blank. Ion ratio was the only consideration in the identification criterion in this study, but in practice, essentially all false positives would be eliminated by setting a reporting level of 10 ng/g, for example (14,15,20,21).
Comparison of LOQs and LOIs Calculated from Peak Heights and Areas
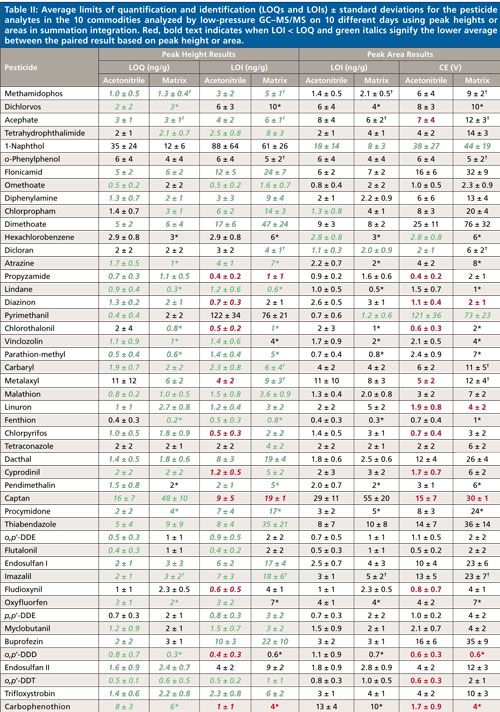
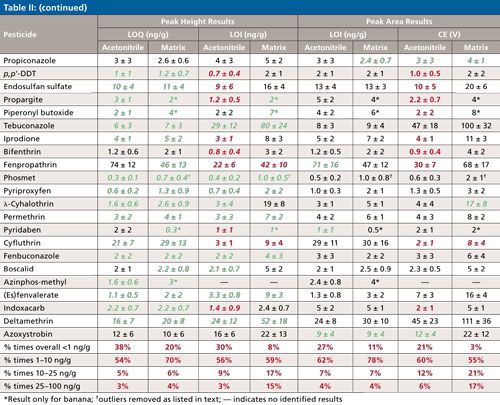
Table II lists the calculated averages ± σ of the LOQs and LOIs based on peak heights and areas for each pesticide from 10 days of analyses in acetonitrile and the 10 matrices. Italics (in green) indicates when the calculated average is lower than the LOQ or LOI acetonitrile-matrix matched counterpart from the height or area integration data. The bottom of the table compiles the percentage of times among all calibrations that the LOQ and LOI result fell within the listed concentration ranges. In acetonitrile, the total number of calibrations was 700 (70 pesticides in 10 sequences), and in the case of matrices, n ≈ 500 accounting for removal of spiked and incurred pesticides from the data sets. Altogether, the LOQ and LOIs were lower 82–86% of the times when using peak height data in the calculations versus peak areas. The peak area results were >5 ng/g lower than the peak height results only 1–2% and 2–5% of the time in terms of LOQs and LOIs, respectively. Due to excessively noisy baselines for its quantitative and qualitative ion transitions, only 1-naphthol gave consistently lower LOQs and LOIs by using peak areas rather than peak heights.
CLICK TABLE TO ENLARGE
CLICK TABLE TO ENLARGE
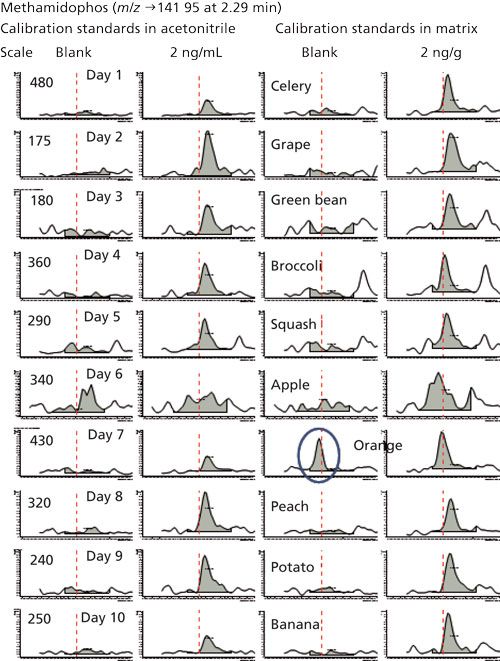
This finding that peak heights yield lower LOQs and LOIs makes sense because of the greater amount of potential noise integrated in the ~0.01-min regions to the left and right of the actual peak when using area in the low-point baseline summation integration approach. Figure 3 shows this situation in the example of the quantitative ion for methamidophos in the study. The LOQ averaged 1.0 ± 0.5 ng/g in acetonitrile by peak height and 1.4 ± 0.5 ng/g via peak area in this case, and the average LOQs in matrix were 1.3 ± 0.4 ng/g and 2.1 ± 0.5 ng/g when using peak heights and areas, respectively. The LOI differences were even greater, as shown in Table II. A qualitative ion interferant in orange, however, led to a LOI of ~470 ng/g, which was excluded from the average. Interestingly, the LOQ remained ~2 ng/g for methamidophos in orange because the quantitative ion interferant was smaller and more consistent than for the qualitative ion.
Figure 3: Summation function integrations of the quantitative ion transition for methamidophos in acetonitrile and matrix-matched calibration standards from the 10 batches of low-pressure GC–MS/MS analyses. An interferant in orange is circled.
Interfering matrix noise also occurred in the cases of acephate, metalaxyl, dicloran, and imazalil in celery (LOIs ≈ 40, 45, 22, 59 ng/g), and o-phenylphenol, carbaryl, and phosmet in broccoli (LOIs ≈ 26, 135, and 23 ng/g), respectively. The matrix also interfered with the quantitative ions of acephate and phosmet in celery and broccoli, leading to LOQs ≈ 20 ng/g in both cases. In several instances as shown using bold (red) text in Table II, LOI was less than LOQ because of less or more consistent noise, which allows the analyst to switch the quantitative and qualitative ions if desired, especially to avoid chemical interferences. Cyfluthrin in particular gave threefold lower LOI in the matrices than LOQ, and the metalaxyl quantitative ion was periodically affected by a chemical interference not associated with the food samples. Even if the quantitative and qualitative ions are switched, the reference ion ratio for identification still entails dividing the signal from the less intense ion by the more intense ion. Furthermore, the use of an additional qualitative ion, such as shown in Figure 1, would lead to easier and better identifications (14,20,21).
Few other examples of ion interferences were notable, demonstrating the exceptional sensitivity and selectivity of the low-pressure GC–MS/MS method, even when introducing merely 0.1 mg equivalent extract to the column. As shown at the bottom of Table II, LOQs < 10 ng/g were achieved for 89–90% of the analyte–matrix pairs using peak heights or areas, and LOIs < 10 ng/g was met 67% and 55% of the times by height and area, respectively. In pesticide residue analysis in the United States and Europe, identified analyte concentrations of ≥10 and ≥20 ng/g (29), respectively, effectively serve as the default enforcement action levels when the pesticide is not registered for use on the analyzed commodity.
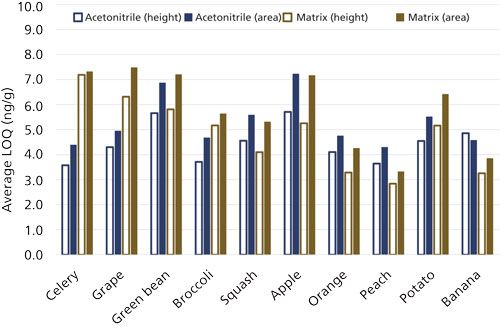
Figure 4 exhibits average LOQs in the 10 sets of analyses and matrices, comparing peak height versus area results. This chart further supports the conclusion that peak heights led to measurably lower calculated LOQs in acetonitrile and matrix extracts than peak areas. The day-to-day variations in instrument performance can be observed from the acetonitrile results, and interestingly, these findings track relatively well with higher or lower LOQs in the matrices on the same day. This indicates that day-to-day instrument performance variations contribute more to the quality of results on average than typical matrix-to-matrix variations.
Figure 4: Average LOQs for the 70 analytes in different matrices over the course of 10 days (listed in order of analysis over time) when using peak heights or areas as the signal.
Methods in which the analytes consistently meet identification criteria at 10–20 ng/g are desirable in this application, and although nontargeted methods of analysis have conceptual advantages over targeted MS/MS methods (21), potentially nontargeted MS-based methods still involve targeting of knowns to yield optimal results. Even then, identification criteria require comparison of results to a reference standard, which can then be added to the target list with known tR for integration using the summation function, for instance.
Lowest-Baseline-Level Summation Integration
As already mentioned, the extra noise contributions in the ~0.01-min integrated wings to the side of peaks is the probable reason that the LOQs and LOIs were lower in this study when using summation integrated peak heights versus areas. The extra integration regions only interfere with peak height results if the noise exceeds the maximum analyte intensity, but integrated area always includes this extra noise. However, the empirical finding in this study mainly originates from the Agilent software in which all signals are forced to be positive by setting the integration baseline to the lowest point, rather than integrating from a midpoint of the baseline noise. Differences in summation integration approaches can be compared between Figure 1 (bottom) and Figures 2 and 3. The former approach from Sciex allows the analyst to input a %baseline setting (25% in the figure), whereas it is only practical in the latter approach to use the low-point (0%) baseline setting.
In theory, a baseline setting of 50% leads to an integrated signal (peak height or area) of zero by definition for a true blank. However, flicker noise or trending or shifting baselines, taking into account the sections of time from which the front and rear baseline noises are determined, cause integrated signal fluctuations in real-world circumstances (3,7,11). In any case, true baseline drift is a very small contribution to noise, and chemical noise from the sample, or indiscriminate molecules reaching the detector (30), are much greater sources of noise that affect baselines and detection limits. Thus, more care must be taken to adjust the %baseline setting in this approach compared with the simpler default approach that uses the low-point (0%) baseline setting.
As the results of this study show, the use of peak height rather than peak area better avoids this baseline problem in the first place. Peak height signals also give the advantage that if the peak drifts, height will be the same provided that the apex of the analyte peak still falls within the integration window (and an interfering peak is not taller which occurred in Figure 1). Thus, theoretical considerations and empirical findings thus far indicate that using low-point baseline summation integration and peak height signals is the better approach, leading to more reliable and accurate quantification and identifications at lower levels without analyst review of peak integrations.
Conclusions
A high-throughput robotic method of sample preparation and rapid low-pressure GC–MS/MS analysis for quantitative and qualitative monitoring of pesticide residues in foods was developed and reported previously (15). The method is so rugged that hundreds of samples can be injected without the need for instrument maintenance. Normally, data handling would be the most time-consuming and labor-intensive step to limit sample throughput, but this method involves the use of summation integration to reliably and automatically integrate chromatographic peaks without the need for manual reintegrations. Clear “yes–no” analyte identifications are then made using pre-defined criteria in which MS/MS ion ratios are compared with the contemporaneous reference value from high-level standards in reagent solutions.
In this study involving 490 analysis of 70 pesticides in 11 matrices (including acetonitrile) over 10 days, an empirical comparison of peak height and area signals demonstrated that the use of heights led to lower LOQs and LOIs at lower signal levels, albeit peak areas were slightly more consistent at moderate concentrations. Recent studies have shown that peak widths can be used to extend the quantitative analytical range even further when the peak saturates the detector (31). Lower rates of false negatives were also achieved using peak height data, without a concomitant increase in the rate of false positives.
These findings are applicable to many applications, not just pesticide residue analysis. All practicing chromatographers have the shared experience that results from common commercial chromatographic peak integrators can rarely be trusted without personal review of the integrations. Despite >30 years of research and development using many sophisticated algorithms, some investigators still believe that the ultimate trustworthy integrator can be devised using even more sophisticated software, but in the case of targeted analytes, the simple, easy, and reliable summation integrator already meets that need.
Acknowledgment
The author thanks Limei Yun for conducting sample processing and extractions in the study.
Disclaimer
Mention of brand or firm name does not constitute an endorsement by the U.S. Department of Agriculture above others of a similar nature not mentioned. The USDA is an equal opportunity provider and employer.
References
- C.F. Poole, The Essence of Chromatography (Elsevier, New York, 2003), pp. 63–70.
- N. Dyson, J. Chromatogr. A842, 321–340 (1999).
- L.D. Asnin, Trends Anal. Chem. 81, 51–62 (2016).
- E. Grushka and I. Atamna, Chromatographia24, 226–232 (1987).
- B. Spangenberg, Fresenius J. Anal. Chem. 360, 148–151 (1998).
- B. Schirm and H. Wätzig, Chromatographia48, 331–346 (1998).
- J. Li, Anal. Chim. Acta388, 187–199 (1999).
- H.M. Hill, J. Smeraglia, R.R. Brodie, and G.T. Smith, Chromatographia55, S79–81 (2002).
- M. Fredrikssson, P. Petersson, B.-O. Axelsson, and D. Bylund, J. Sep. Sci.32, 3906–3918 (2009).
- P.G. Stevenson, H. Gao, F. Gritti, and G. Guiochon, J. Sep. Sci.36, 279–287 (2013).
- L.G. Johnsen, T. Skov, U. Houlberg, and R. Bro, Analyst138, 3502–3511 (2013).
- Y. Vanderheyden, K. Broeckhoven, and G. Desmet, J. Chromatogr. A1364, 140–150 (2014).
- X. Tong, Z. Zhang, F. Zeng, C. Fu, P. Ma, Y. Peng, H. Lu, and Y. Liang, Chromatographia79, 1247–1255 (2016).
- M.J. Schneider, S.J. Lehotay, and A.R. Lightfield, Anal. Bioanal. Chem. 407, 4423–4435 (2015).
- S.J. Lehotay, L. Han, and Y. Sapozhnikova, Chromatographia79, 1113–1130 (2016).
- L. Han, Y. Sapozhnikova, and S.J. Lehotay, Food Control66, 270–282 (2016).
- J. Wang, W. Chow, J. Chang, and J.W. Wong, J. Agric. Food Chem. 65, 473–493 (2017).
- G.-F. Pang, C.-L. Fan, Y.-Z Cao, F. Yan, Y. Li, J. Kang, H. Chen, and Q.-Y. Chang, J. AOAC Int.98, 1428–1454 (2015).
- A. Lozano, B. Kiedrowska, J. Scholten, M. de Kroon, A. de Kok, and A.R. Fernandez-Alba, Food Chem. 192, 668–681 (2016).
- S.J. Lehotay, K. Mastovska, A. Amirav, A.B. Fialkov, T. Alon, P.A. Martos, A. de Kok, and A.R. Fernandez-Alba, Trends Anal. Chem. 27, 1070–1090 (2008).
- S.J. Lehotay, Y. Sapozhnikova, and H.G.J. Mol, Trends Anal. Chem.69, 62–75 (2015).
- S.J. Lehotay, U. Koesukwiwat, H. van der Kamp, H.G. Mol, and N. Leepipatpiboon, J. Agric. Food Chem. 59, 7544–7556 (2011).
- K. Elkin, L. Pierrou, U.G. Ahlborg, B. Holmstedt, and J.-E. Lindgren, J. Chromatogr.81, 47–55 (1973).
- L.M. Blumberg and M.S. Klee, Anal. Chem. 70, 3828–3839 (1998).
- US Dept. of Agriculture, Agricultural Marketing Service, Pesticide Data Program Annual Reports (www.ams.usda.gov/datasets/pdp).
- M. Anastassiades, S.J. Lehotay, D. Štajnbaher, and F.J. Schenck, J. AOAC Int. 86, 412–431 (2003).
- Y. Sapozhnikova and S.J. Lehotay, Anal. Chim. Acta899, 13–22 (2015).
- K. Maštovská, S.J. Lehotay, and M. Anastassiades, Anal. Chem. 77, 8129–8137 (2005).
- A. Valverde, A. Aguilera, and A. Valverde-Monterreal, Food Control71, 1–9 (2017)
- A.B. Fialkov, U. Steiner, S.J. Lehotay, and A. Amirav, Int. J. Mass Spectrom. 260, 31–48 (2007).
- A. Kadjo, P.K. Dasgupta, J. Su, S.-Y. Liu, and K.G. Kraiczek, Anal. Chem. 89, 3884–3892 (2017).
Steven J. Lehotay is with the United States Department of Agriculture’s Agricultural Research Service at the Eastern Regional Research Center in Wyndmoor, Pennsylvania. Direct correspondence to: Steven.Lehotay@ars.usda.gov

University of Rouen-Normandy Scientists Explore Eco-Friendly Sampling Approach for GC-HRMS
April 17th 2025Root exudates—substances secreted by living plant roots—are challenging to sample, as they are typically extracted using artificial devices and can vary widely in both quantity and composition across plant species.
Miniaturized GC–MS Method for BVOC Analysis of Spanish Trees
April 16th 2025University of Valladolid scientists used a miniaturized method for analyzing biogenic volatile organic compounds (BVOCs) emitted by tree species, using headspace solid-phase microextraction coupled with gas chromatography and quadrupole time-of-flight mass spectrometry (HS-SPME-GC–QTOF-MS) has been developed.
Common Challenges in Nitrosamine Analysis: An LCGC International Peer Exchange
April 15th 2025A recent roundtable discussion featuring Aloka Srinivasan of Raaha, Mayank Bhanti of the United States Pharmacopeia (USP), and Amber Burch of Purisys discussed the challenges surrounding nitrosamine analysis in pharmaceuticals.


