Supplementary Information: Utility of the Summation Chromatographic Peak Integration Function to Avoid Manual Reintegrations in the Analysis of Targeted Analytes
LCGC North America
This information is supplementary to the article “Utility of the Summation Chromatographic Peak Integration Function to Avoid Manual Reintegrations in the Analysis of Targeted Analytes” that was published in the June 2017 LCGC North America issue (1).
This information is supplementary to the article “Utility of the Summation Chromatographic Peak Integration Function to Avoid Manual Reintegrations in the Analysis of Targeted Analytes” that was published in the June 2017 LCGC North America issue (1).
Experimental
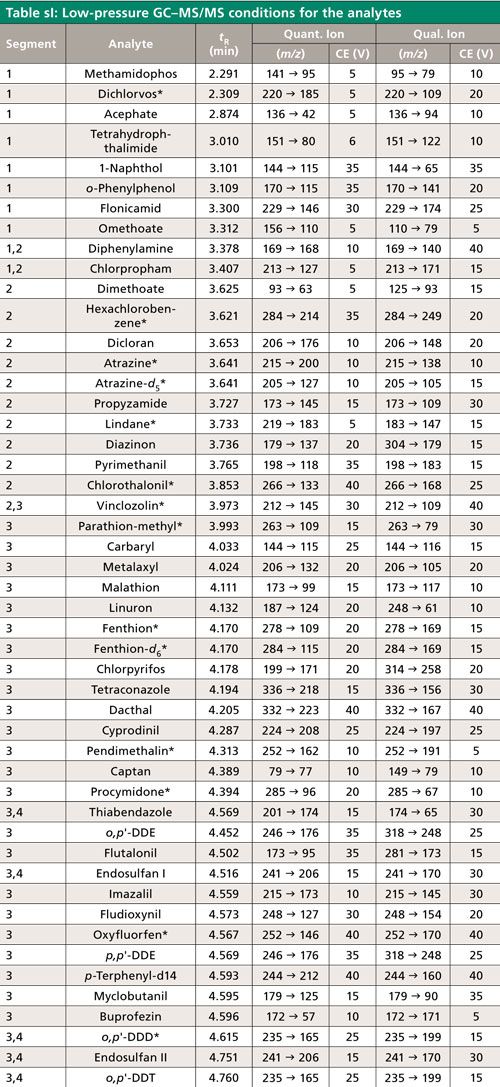
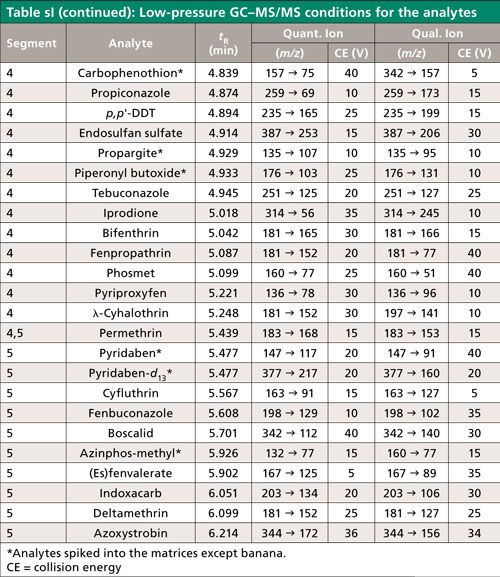
The list of 70 pesticide analytes, three internal standards, and a QC standard appears in Table sI along with aspects of their analysis by low-pressure GC–MS/MS. The pesticide analytes include many commonly found residues according to the United States Department of Agriculture (USDA) Pesticide Data Program (25), particularly in the 10 chosen fruits and vegetables for this study. Each batch of samples (obtained from a local store) was prepared and analyzed within the same day on 10 different days in the following order: 1, celery; 2, grape; 3, green bean; 4, broccoli; 5, squash; 6, apple; 7, orange; 8, peach; 9, potato; and 10, banana. Each sequence consisted of 49 injections.
Sample Preparation
Sample preparation was conducted using the original QuEChERS (quick, easy, cheap, effective, rugged, and safe) extraction method (26) followed by instrument top sample preparation (ITSP) for automated minicolumn solid-phase extraction (SPE) cleanup, as described previously (15). QuEChERS kits were purchased from UCT, and minicartridges containing 20 mg of anhydrous magnesium sulfate (MgSO4), 12 mg each of C18 and primary secondary amine (PSA), and 1 mg of CarbonX sorbents were purchased from ITSP Solutions.
In each batch, 33 replicates of different test portion sizes, plus a reagent blank consisting of water, were extracted in polypropylene centrifuge tubes after adding 1 mL acetonitrile per gram of sample and shaking for 10 min and then shaking for another 3 min after adding 0.4 g of anhydrous MgSO4–NaCl (4:1, w/w) per gram of sample, using a GlasCol platform pulsing vortex mixer, followed by centrifugation for 3 min at 3711 rcf. Except in the case of banana, the 17 pesticides and three internal standards marked by an asterisk in Table sI were added to 32 of the samples before analysis yielding 100 ng/g (except 500 ng/g for pyridaben-d13 and 50 ng/g each for hexachlorobenzene and o,p′-DDD). Diazinon, tetraconazole, and pyriproxyfen were spiked into 12 of the replicates, including banana. The 33rd sample in each batch was the matrix blank used for matrix-matched calibration standards.
For mini-SPE cleanup, ~600 μL of initial extract was transferred to autosampler vials, and 300 μL was added by syringe to the cartridges at 2 μL/s via a Gerstel MPS robotic liquid handler (also known as a Pal3-RTC from CTC Analytics). On average, 220 μL of cleaned extracts passed through the cartridge into an autosampler vial containing a microvial insert, to which 25 μL was robotically added of a mixed QC and analyte protectant solution (containing 0.88 ng/μL p-terphenyl-d14 and 25, 2.5, 2.5, and 1.25 mg/mL of ethylglycerol, gulonolactone, sorbitol, and shikimic acid, respectively) in 2:1 (v/v) acetonitrile–water and 1.1% formic acid.
For samples, 25 μL of acetonitrile make-up volume was added by the liquid handler, which compensated for the addition of 25 μL of appropriate solutions used to make reagent-only (acetonitrile) and matrix-matched (blank final sample extracts) calibration standards. The six-point calibrations consisted of 0-, 2-, 8-, 32-, 128-, and 512-ng/g (ng/mL) levels, except hexachlorobenzene and DDEs–DDD–DDT were half as concentrated.
Analysis
An Agilent 7890A/7010 GC–MS/MS system fitted with a multimode inlet (MMI) was used for analysis. A Restek Sky Precision liner with glass wool was used in split (1:9) injection of 1 µL. To avoid carryover and sticking of the plunger because of analyte protectants, the 5-µL syringe was washed 10 times with aqueous mixture of acetonitrile, methanol, and acetone followed by another 10 times with acetonitrile.
Low-pressure GC–MS/MS was used similarly as before (15,16,27) with a 5 m x 0.18 mm Restek Hydroguard capillary restrictor-guard column connected via an Agilent Ultimate union to a 15 m x 0.53 mm, 1-µm df Restek Rtx-5MS analytical column. An additional 1 m of an integrated guard column on the analytical column extended into the transfer line, which was kept at 280 °C. A constant flow rate of helium (99.999%) carrier gas was 2 mL/min based on a calculated virtual column dimensions of 5.5 m x 0.18 mm. The GC oven temperature program was 75 °C for 0.5 min, ramped at 50 °C/min to 320 °C, and held for 4.6 min (10 min total). Cool-down and re-equilibration time was 3 min. The ion source and quadrupoles were kept at 320 °C and 150 °C, respectively. Agilent Mass Hunter version B07 software was used for instrument control and data processing.
Table sI lists some of the conditions used in the study. MS/MS segments 1–5 had start times of 2, 3.5, 3.9, 4.7, and 5.35 min and ion transition dwell times of 11, 9, 4, 6, and 15 ms, respectively, which led to ~250 ms cycle times (~4 Hz data acquistion rates) for all analytes. Peak widths at the baseline in low-pressure GC–MS/MS are typically 2 s, which gave approximately eight data points across each peak. Agilent’s summation integration function was used with the lowest point as the baseline offset, which is further described in the main text.


Reference
- S.J. Lehotay, LCGC North Am. 35(6), 391–402 (2017).

New Method Explored for the Detection of CECs in Crops Irrigated with Contaminated Water
April 30th 2025This new study presents a validated QuEChERS–LC-MS/MS method for detecting eight persistent, mobile, and toxic substances in escarole, tomatoes, and tomato leaves irrigated with contaminated water.
Accelerating Monoclonal Antibody Quality Control: The Role of LC–MS in Upstream Bioprocessing
This study highlights the promising potential of LC–MS as a powerful tool for mAb quality control within the context of upstream processing.
University of Tasmania Researchers Explore Haloacetic Acid Determiniation in Water with capLC–MS
April 29th 2025Haloacetic acid detection has become important when analyzing drinking and swimming pool water. University of Tasmania researchers have begun applying capillary liquid chromatography as a means of detecting these substances.

.png&w=3840&q=75)

.png&w=3840&q=75)


.png&w=3840&q=75)


.png&w=3840&q=75)


