Using GC–MS to Observe Changes in the Essential Oil Concentrations in Cedar Tree (Juniperus virginiana) Leaves During a Drought Year
Special Issues
A look at how the concentration of essential oils in cedar leaves is affected by changes in temperature and the amount of rainfall
Essential oils were extracted from the leaves of cedar trees using ~50 mL of methylene chloride with an internal standard, m-xylene. The extract was then concentrated to ~2.0 mL by boiling off the solvent and analyzed by gas chromatography–mass spectrometry (GC–MS). Samples were collected monthly and the results were compared to weather data for an entire year, during a drought. By far, the compound in greatest abundance was β-pinene, comprising 25 ± 9% of the total essential oils. Total essential oils were found to comprise 0.7 ± 0.3% of the mass of the cedar leaves. It was found that during the summer, the concentration of essential oils was five times that of the concentration in the winter with sufficient rainfall. The concentration of essential oils in the cedar leaves increases with temperature, but is inversely proportional to the rainfall.
The red cedar tree (Juniperus virginiana) is commonly found over most of North America and has needle-like leaves (1). Both the wood and leaves of the red cedar contain essential oils. The wood is most commonly used for making chests and dressers to keep moths and other insects away from valuables and clothing. Cedar essential oils serve many functions, such as insect and fungus defense (2). The concentration of these essential oils in cedar trees fluctuate throughout the year depending on the season (2). Essential oils are also used in disinfectants, soaps, and candles because of their concentrated aroma (3). This study was performed to identify the essential oils found in cedar leaves and to determine how the concentrations of these essential oils varied through an entire year. This study was also performed during a period of drought and the results are interesting to determine how the lack of rainfall affected these concentrations.
The most common method for extracting essential oils from cedar is by gathering a wood sample, grinding it up, and distilling the sample using steam distillation. There are other methods using supercritical carbon dioxide, liquid carbon dioxide, and pressurized water (1). In this study, the solvent methylene chloride (CH2Cl2) was used to extract oils from cedar leaf samples.
There are a large number of essential oils that are found in cedar wood. Some of these chemicals include: α-pinene, β-pinene, limonene, safrole, α-cedrene, β-cedrene, thujopsene, cuparene, cedrol, widdrol, sabinene, caryphyllene oxide, and many other oils (3,4). These oils are also expected to be found in cedar leaves.
Different seasons bring a different amount of insects as well as different temperatures. The warmer seasons, spring and summer, are expected to present warmer temperatures and more insects. In comparison to the warmer seasons, the colder seasons, winter and fall, bring cooler temperatures and fewer insects. When the weather is warmer and the insects are present, it is expected that essential oil concentrations will increase as opposed to cooler weather and the absence of insects.
This work is a preliminary study of the effect of the seasons, temperature, and rainfall on the essential oils found in red cedar leaves. Data have been collected over the period of a year. During that time the cedar trees under study experienced abnormally warm weather and less rainfall than normal. The study is continuing to this day to determine what the essential oil concentrations are in a "normal" year.
Experimental Methods
A random selection of 12 cedar trees were chosen on the campus of Tabor College, in Hillsboro, Kansas. On a monthly basis, 3.0-g leaf samples were collected from the outer leaves of each tree. The leaves were then placed in ~50 mL of methylene chloride for a month. A separate study showed that the essential oils were removed from the leaves after one week of extraction. Then 3.0 mL of 0.010% m-xylene in methylene chloride was added to the extract. Next, each sample was filtered through filter paper and concentrated to a total volume of ~2.0 mL by boiling off the solvent on a hot plate and placing it in an autosampler vial. If samples were not analyzed immediately they were stored in a freezer at -20 °C. Finally, the extract was analyzed using a Shimadzu GC-17A gas chromatograph and GCMS-QP5000 mass spectrometer. The analysis conditions were as follows:
- GC column: 30 m × 0.25 mm, 0.25-µm df ZB-5
- Initial oven temperature: 40 °C (initial hold time of 1.00 min)
- Initial rate: 10 °C/min
- Final temperature: 300 °C (final hold time of 5.00 min)
- Injector temperature: 280 °C
- Split ratio: 1:50
- Interface temperature: 300 °C
- Helium flow: 0.29 mL/min
Masses from 50 to 250 Da were recorded. Each sample analysis took approximately 45 min. A similarity search of mass spectra was done to identify the peaks using a National Institute of Standards and Technology (NIST) library. Peak identities were confirmed using Kovats indexes and authentic samples where possible.
Results and Discussion
Figure 1 shows a typical total ion chromatogram (TIC) obtained in this study. Approximately 90 different peaks could be observed in a typical chromatogram. However, in most cases, 75% of the essential oils were found in the 10 most abundant chemicals. Some of the major peaks observed include: 3,3-dimethylpentene, 3,3-dimethylbutene, α-pinene, β-pinene, myrcene, limonene, safrole, α-cedrene, β-cedrene, thujosene, and cuparene. The majority of peaks were very minor, but because of the sensitivity of the instrument and method they could be quantitated as well as the major peaks.
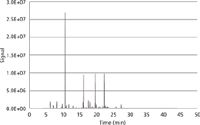
Figure 1: A typical total ion chromatogram of the extract from red cedar leaves.
One of the first peaks in the chromatogram is that of the internal standard, m-xylene. The largest peak in most samples was β-pinene and, on average, it comprised 25% of the total essential oils extracted from the leaves. This is in contrast to other literature that mentions β-pinene as a minor component monoterpene (5). Many other terpenes were found in the leaves, but in much smaller concentrations than β-pinene. The next three major peaks shown in Figure 1 are safrole, α-cedrene, and cuparene. As shown in Figure 1, there were numerous smaller peaks, and most of these comprised less than 1% of the total area and were primarily essential oils. Some of these compounds include camphene, myrcene, p-cymene, citronellol, aromadendrene, and many unidentified compounds. Some trees tended to consistently have a certain distribution of essential oils and other trees had a rather different distribution of oils. For instance, some trees consistently had a fairly high percentage of safrole, but others had no detectable safrole.
Figure 2 shows the mass percent of essential oils in the leaves as a function of month. Depicted are the average mass percent of all 12 samples for each month. The error bars in the figure represent one standard deviation of the results. The x-axis is the month in 2012, and zero represents December 2011. The y-axis represents the mass percent of the compound. In many cases, the standard deviations of the data points are as great as 50% of the values of the data points. We very much wish that we had started this study a few months earlier so that we could have seen what the mass percent of the essential oils was before the drought.
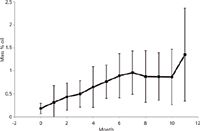
Figure 2: Total mass percent oil extracted from the red cedar leaves as a function of month. The x-axis is the month in 2012 and zero represents December 2011. The y-axis represents the mass percent of the compound.
It was expected that the concentration of essential oils in the leaves would increase in the summer with the temperature, then decrease as the temperature cools. However this was not what was observed. Unexpectedly, the mass percent of essential oils increased almost linearly throughout the entire study. A maximum occurred in July, the hottest month of the year, and it would then be expected that as the temperature cooled off that the mass percentage of essential oils would drop. That was observed for August, but at that point the total mass percentage basically held constant, and then abruptly increased in November. By itself this data seems very contradictory. However, Table I shows the average temperature and measured rainfall for Wichita, Kansas, during the time at which samples were collected. (Wichita is the closest major weather station where continuous measurements are recorded.) Although the temperature follows a periodic cycle of warm weather in summer and cooler weather in winter, the amount of rainfall per month seems almost random with some months having more than 5 in. of rain while other months have less than one-tenth that amount. The average annual rainfall in Wichita, Kansas, is about 32 in. (6). At the beginning of the study, rainfall was close to that average. However, by the end of the study the annual rainfall was as much as 8 in. (20 cm) below average. It is believed that the cumulative lack of water is primarily responsible for the increased concentration in essential oils. Reductions in rainfall have been shown to have a positive effect on the mass percentage of essential oils in plants (7).
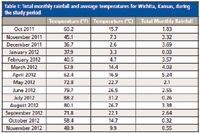
Table I: Total monthly rainfall and average temperatures for Wichita, Kansas, during the study period
The very last data point for November 2012 is unusual in two respects. First, the mass percentage of essential oils in those samples was higher than any other in the study. This is somewhat expected because there had been almost no rain for two months. Second, the standard deviation of those samples was much higher than any other samples. This tends to imply that the drought affected some plants more than others.
Figure 3 shows how the mass percentage of three different compounds changed as the study was conducted. As in Figure 2, the error bars represent one standard deviation in the data. Figure 3a shows a plot of β-pinene concentration as a function of month. As the study was conducted the concentration of β-pinene dropped to one-half of its initial value. Figure 3b shows a plot of safrone concentration as a function of month. This concentration also decreased, but not as much as the β-pinene. Finally, Figure 3c shows a plot of cuprene as a function of month. In this case, the concentration increased with time and almost doubled the initial concentration.

Figure 3: The area percent of total ion chromatogram due to (a) β-pinene, (b) safrole, and (c) cuprene as a function of month.
A very interesting, minor inflection in Figure 3a is that there is a dip in the graph in February 2012 which follows directly from the relatively wet November and December, a dry January, and then a relatively wet February and March. Normally, January is the coldest month in Kansas. However, as shown in Table I, December was the coldest month of the entire study and the temperature was abnormally warm for the state and continued to rise until July 2012. In hindsight, it is rather serendipitous that we happened to start our study in the coldest month of the winter. As the temperature rose, the % area of βpinene declined. However, after July the temperature dropped, and the % area of β-pinene continued to decline. This decrease is attributed to insufficient rainfall, especially at the end of the study, and the cedar trees were producing other essential oils instead of β-pinene
Holzinger and colleagues showed that monoterpene emissions from pine trees varied dramatically with the seasons (8). In the summer, emissions were 4–5 times greater than in the fall. Therefore, it is easy to explain decreases in β-pinene concentrations during the summer. However, at this point the continual decrease in β-pinene concentration under the conditions of lower temperatures and lower rainfall are harder to explain.
Safrole generally follows the same trends as β-pinene as shown in Figure 3b. Over the course of the study the safrole concentration decreased. However, the decrease was not as pronounced as that of β-pinene. While the area percent of β-pinene decreased to less than 50% of the initial amount, the area percent of safrole decreased to about 30%. Also, after a dry month when the area percent of β-pinene decreased, so did the area percent of safrole. However from July to the end of the study the area percent of safrole was essentially unchanged. Safrole is a larger molecule than β-pinene with a higher boiling point, a higher heat of vaporization, and lower vapor pressures. Therefore, higher temperatures are expected to have less effect on safrole concentrations than β-pinene concentrations. Apparently, reduced rainfall had little effect upon the area percent of safrole produced as shown at the end of the study.
In contrast to the β-pinene and safrole which decreased as the study progressed, the area percent of cuparene increased (Figure 3c). Cuparene is a larger molecule than β-pinene or safrole. Therefore, higher temperatures would be expected to have less effect upon cuparene vaporizing from the leaves than smaller molecules. If the tree is then suffering from lack of water, it is therefore not surprising for the concentration of cuparene to increase because of evaporation of water, but not cuparene.
In summary, these results show that α-pinene and safrone concentrations decrease with water stress while cuparene concentrations increase with water stress. These results are similar to those found by Bahr and colleagues when they induced water stress upon plants of Satureja hortensis L. (7). In their results, carvacrol concentrations increased with moderate water stress while γ-terpinene concentrations decreased. In another study by McGimpsey and colleagues, the essential oil yield and composition of Thymus vulgaris L. changed with the seasons (9). During the winter, some essential oils increased in concentration and some decreased. The opposite effect was seen in the summer.
Safrole concentrations varied widely from tree to tree. A few trees would consistently have more than 10% of the total peak area due to safrole, and a few other trees would consistently have no safrole at all or an extremely small peak. Therefore, the effects seen in Figure 3b are aggregate effects with standard deviations in these values as large as the values themselves. The standard deviations in Figure 3c are smaller, comprising about 50% of the average values and the standard deviations in Figure 3a are even smaller, comprising about 30% of the average values.
In a final analysis of the data, the authors attempted to see if a model could be determined to fit the data relating mass percent of essential oils with the temperature and total rainfall. Initial efforts to fit only temperature or monthly rainfall to the mass percent of essential oils were unsuccessful. A reasonable fit was obtained by combining both temperature and cumulative rainfall over the previous two months into a weather index which is defined as follows:

At this point the logarithm of the weather index is taken and a reasonably good fit was obtained with the data (Figure 4). Although the weather index is an odd function, it does make sense. As the temperature increases, the stress on the tree also increases. Likewise, as the rainfall increases, the stress on the tree decreases. The best fit to the data occurred with the sum of two months of rainfall. Using one month or three months gave much worse fits to the data. This sum of two months of rainfall probably is indicative of the ability of the tree to store water, the ability of the ground around the tree to store water, or probably a combination of the two. All of the trees in the study were approximately the same size and in ground that is relatively the same. If the trees were of different size, then it could be reasoned that size could affect the ability of the tree to store water. Also, if the trees were in sandy soil that quickly drained compared to soil with a lot of clay that could hold water, then this would affect the water stress of the trees. The data shown in Figure 4 are quite interesting. However, the number of data points is small and the true test of the model is to see if it holds during a time of abundant rain. Future research will also compare trees of different size or trees planted in different soil types.
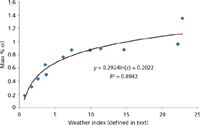
Figure 4: The mass percent oil as a function of weather.
Conclusions
Throughout this study the total concentration of the essential oils in the cedar trees increased. This effect primarily occurred through an increase in concentration and the number of higher molecular weight essential oils. Less rainfall appears to have a greater effect on essential oil concentrations than temperature. The effects of temperature and rainfall were combined into a weather index, which is a reasonable predictor of the total mass percentage of essential oils in the cedar leaves. Further study needs to determine whether this same model works in a year with higher rainfall.
Acknowledgments
The authors would like to thank the Chemistry Department of Tabor College and the Tabor College HOPE scholarship fund for the funding necessary to conduct this research. The assistance of Bruce Heyen and Andrew Sensenig in editing this manuscript are also gratefully acknowledged.
References
(1) F.J. Eller and S.L. Taylor, J. Agric. Food Chem. 52 (8), 2335–2338 (2004).
(2) R.P. Adams, Biomass 12 (2), 129–139 (1987).
(3) R.P. Adams in Essential Oils and Waxes (Springer-Verlag Berlin Heidelberg, 1991).
(4) S. Cheng, H. Lin, and S. Chang, J. Agric. Food Chem. 53 (3), 614–619 (2005).
(5) E. von Rudolff, Canadian J. Chem. 39, 1200–1206 (1961).
(6) National Weather Service Records for Wichita, Kansas, http://www.crh.noaa.gov/ict/climate/f6form.php. Accessed April 15, 2013.
(7) Z.F. Baher, M. Mirza, M. Ghorbanli, and M.B. Rezaii, Flavour Fragrance J. 17, 275–277 (2002).
(8) R. Holziner, A. Lee, M. McKay, and A.H. Goldstein, Atmos. Chem. Phys. 6, 1267–1274 (2006).
(9) J.A. McGimpsey, M.H. Douglas, J.W. Van Klink, D.A. Beauregard, and N.B. Perry, Flavour Fragrance J. 9, 347–352 (1994).
Norman E. Schmidt and Nikol M. Sandoval are with the Department of Chemistry at Tabor College in Hillsboro, Kansas. Direct correspondence to: normans@tabor.edu
New Method Explored for the Detection of CECs in Crops Irrigated with Contaminated Water
April 30th 2025This new study presents a validated QuEChERS–LC-MS/MS method for detecting eight persistent, mobile, and toxic substances in escarole, tomatoes, and tomato leaves irrigated with contaminated water.

.png&w=3840&q=75)

.png&w=3840&q=75)


.png&w=3840&q=75)


.png&w=3840&q=75)


