Using Comprehensive GCxGC–TOF-MS for Enhanced Detection and Separation in Antidoping Control Screening
Special Issues
The misuse of androgenic anabolic steroids in sports was banned in 1976 by the International Olympic Committee and global sports community. The illegal use of anabolic steroids has reached disturbing levels worldwide. This worldwide problem is fueled partially by an ever-increasing demand for better athletic performance. The World Anti-Doping Agency has formulated strict guidelines for minimum allowable concentrations of exogenous anabolic steroids and their metabolites. The standard test methods for doping control are analyzed in urine samples with trimethyl-silyl derivatization. Urine is a complex and difficult biological matrix. This research shows the advantages of using comprehensive two-dimensional gas chromatography–time-of-flight-mass spectrometry (GCÃ-GC–TOF-MS) and illustrates the capability of GCÃ-GC-TOF-MS to be an effective instrumental option for antidoping control screening.
Anabolic steroid screening analysis in urine is complex and labor intensive requiring sensitive instrumentation and optimized chromatographic separations. This research presents the practical application of comprehensive two-dimensional gas chromatography–time-of-flight-mass spectrometry (GC×GC–TOF-MS) for the identification and quantification of five androgenic anabolic steroids in urine. Conventional methods for steroid analysis in urine rely heavily on one-dimensional GC separations and selected ion monitoring (SIM) MS methods. This study utilizes GC×GC to increase peak capacity and resolution in combination with time-of-flight mass spectrometry (TOF-MS) detection followed by data processing with deconvolution software algorithms for positive confirmation of anabolic steroids in urine.
A steroid mixture containing stanozolol (Winstrol), 4-hydroxystanozolol, boldenone, 19-norandrosterone, 17α-methylandrostan-3α-17β -diol, and 3-hydroxystanozolol was prepared from commercial standards. Experimental results for the identification of 3-hydroxystanozolol at the 2-ppb level are presented. The illegal anabolic steroid stanozolol and metabolites are known to be particularly difficult to detect and separate chromatographically. Methyltestosterone was used as an internal standard (ISTD). Stanozolol was not included in the calibration curve development due to poor chromatographic response below 10 ppb. Although urine sampling is simple and easy to obtain, it poses a variety of challenges for the laboratory analyst. Sample preparation is labor intensive, complex, and difficult to reproduce consistently. Urine is a complicated biochemical mixture. The matrix effects from urine often can obscure detection of trace-level steroids and their metabolites. Instrumentation must be able to provide absolute confirmation of the analytical results. Sample preparation followed a well established extraction and derivatization procedure for antidoping control. Results from this study show significant improvements in chromatographic resolution and peak capacity, as well as the enhanced detectability that GC×GC–TOF-MS provides for antidoping control screening. Successful trace level identifications of the five steroid standards mixture will be shown at the 2-ng/mL (2-ppb) level. This exploratory research investigation demonstrates favorable and practical applicability of GC×GC–TOF-MS for the positive identification of anabolic steroids at the lowest allowable concentration limits which meet the strict guidelines set by the World Anti-Doping Agency (WADA). The increased peak capacity and enhanced chromatographic resolution of GC×GC coupled with a fast acquisition TOF-MS, up to 500 Hz, is essential for the successful acquisition and analysis of the data density needed to characterize low levels of steroids fully in complex sample matrices such as urine. These data-rich files are processed with deconvolution algorithms, which deliver qualitative identification as well as a multiple compound quantification in a single run. The results show limit-of-detection values at or below 2 ppb for five anabolic steroids with a calibration linearity of greater than 99.9%.
Experimental
Initial studies focused on the development of the sample acid hydrolysis and derivatization procedure, in addition to chromatographic (GC×GC) and MS (TOF-MS) method optimization. Sample preparation was conducted with established protocols for steroid analysis in urine (1). Steroid reference standards were purchased from (Cerilliant, Round Rock, Texas) and (Alltech-Applied Science Labs, Deerfield, Illinois). A five-component steroid standards mixture was prepared in methanol. Serial dilutions were made from the steroid standards mixture and then spiked into 2-mL urine aliquots to create a working five point calibration at 2, 10, 20, 50, and 100 ng/mL. Methyltestosterone was spiked into the urine matrix at 200 ng/mL as an internal standard. Acid hydrolysis with beta-glucuronidase was carried out before solvent extraction with methyl-tert-butyl-ether. Extracts were dried completely using nitrogen evaporation. Trimethylsilyl-derivatization was conducted with a commercially available MSTFA-ammonium-iodide-ethanethiol mixture from (Sigma-Aldrich, Saint Louis, Missouri). A 3-µL pulsed splitless injection was used to analyze each sample immediately after derivatization.
GC×GC–TOF-MS results were generated with a Pegasus 4D time-of-flight mass spectrometer (LECO, St. Joseph, Michigan). The Pegasus 4D GC×GC–TOF-MS instrument was equipped with a model 7890 gas chromatograph (Agilent Technologies, Santa Clara, California) featuring a two-stage cryogenic modulator and a secondary oven (LECO). ChromaTOF software (LECO) was used for all acquisition control, data processing, and calibration curve development. A 30 m × 0.25 mm, 0.25-µm df Rxi-5ms, (Restek Corp., Bellefonte, Pennsylvania) GC capillary column was used as the primary column for the GC×GC–TOF-MS analysis. In the GC×GC configuration, a second column (1.2 m × 0.18 mm, 0.20-µm df BPX-50, (SGE Analytical Science, Austin, Texas) was placed inside the secondary GC oven after the thermal modulator. The helium carrier gas flow rate was set to 1.5 mL/min at a corrected constant flow via pressure ramps. The primary column was programmed with an initial temperature of 140 °C for 0.20 min then ramped at 20 °C/min to 170 °C, next ramped at 5 °C/min to 260 °C for 2.0 min, with a final ramp at 10 °C/min to 315 °C for 12.0 min. The secondary column temperature program was set to an initial temperature of 145 °C for 0.20 min then ramped at 20 °C/min to 175 °C, next ramped at 5 °C/min to 265 °C for 2.0 min, with a final ramp at 10 °C/min to 320 °C for 12.0 min. The thermal modulator was set to +20 °C relative to the primary oven and a modulation time of 4 s was used. The GC×GC–TOF-MS analysis total run time was 39.2 min. The MS mass range was 45–750 m/z with an acquisition rate of 100 spectra/s. The ion source chamber was set to 230 °C and the detector voltage was 1950 V with electron energy of –70 eV. GC×GC–TOF-MS analysis was conducted immediately after sample derivatization. Subsequently, calibration curves were developed and loaded into the software for automated data processing and quantification purposes. Method development achieved an optimized GC×GC–TOF-MS analysis capable of effectively separating the five anabolic steroids in complex urine matrix at or below 2-ppb detection limits.
Results and Discussion
Anabolic Steroid Identification: Successful trace level identifications of the five steroid standards mixture was achieved at 2 ng/mL with library search matches of greater than 60%. Calibration curve linearity of 99.9% or greater was attained. Over 5000 peaks per sample were detected for this analysis. Figure 1 displays the two-dimensional contour plot chromatogram of the 20-ng/mL standard GC×GC–TOF-MS analysis. The highlighted peaks show the labeled spiked steroids in urine throughout the chromatographic plane. The two-dimensional contour plot chromatogram clearly shows the ability of GC×GC to maximize separation and resolution of anabolic steroids from the complex urine matrix in both the first and second dimensions.
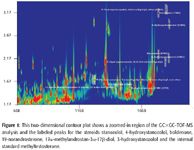
Figure 1
The three-dimensional surface plot chromatogram in Figure 2 shows a zoomed-in portion of the 20-ng/mL steroid GC×GC–TOF-MS analysis where stanozolol, 3-hydroxystanozolol, and 4-hydroxystanozolol are eluted. This figure is an excellent example of the increased peak capacity available with comprehensive two-dimensional chromatography. The stanozolol and hydroxystanozolols derivatize with one, two, or three trimethylsilyl groups. Each of the compounds, stanozolol, 3-hydroxystanozolol, and 4-hydroxystanozolol are eluted in the same first-dimension retention time modulation periods shown by the arrows in Figure 2. However, the same stanozolol and stanozolol-metabolites that are derivatized with fewer tri-methylsilyl groups are separated completely in the second dimension designated by the stars in Figure 2. This example illustrates how comprehensive two-dimensional GC×GC fully resolves analytes that would otherwise be coeluted by one-dimensional chromatography.
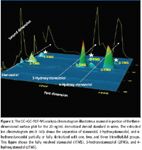
Figure 2
Meeting WADA Minimum Required Performance Levels for Detection of Prohibited Substances
Table I shows the five steroid standards and the internal standard results of the low-level standards at 2 ng/mL, which is the WADA cut-off limit (2). The column labeled (QUANT S/N) lists the quantitative signal-to-noise ratio (S/N) for each steroid. S/N values for the five steroids ranged from 85 to 1353 at the 2 ppb concentration. The low-level cut-off guidelines are achieved and exceed the limits set by WADA. Limits of detection at a 10:1 S/N were calculated from the 2 ng/mL standard quant S/N results shown in Table I. The calculated limits of detection extend from 15 to 235 pg/mL in the part per trillion range.

Table I: Peak table for five steroids and steroid metabolites for the low level WADA cut-off limits at 2 ppb
Calibration Curve Development
A five point calibration curve was developed in the software in the concentration range of 2–100 ng/mL for each of the five derivatized steroid standards. Figure 3 illustrates the calibration curve developed in the software for 3-hydroxystanozolol (3TMS) with a first order linear correlation coefficient value of 0.99911. Calibration curve development for all GC×GC results for the 2-, 10-, 20-, 50-, and 100-ng/mL steroid standards was achieved with greater than 99.9% linearity. The generation of quantitative calibration curves for the five steroid standards used in this study demonstrates the practical application of utilizing GC×GC–TOF-MS for anti-doping control screening.
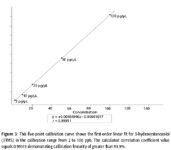
Figure 3
The column headings in Table II show the steroid analyte name, absolute first and second dimension retention time, minimum and maximum concentration range for the calibration, the analyte type, curve fit, the first-order equation, and the calculated correlation coefficient for each standard. The calibration table developed for this research produced excellent linearity for all five steroids. Results for the calibration curve development yielded linearity of greater than 99.9% for the five TMS-derivatized steroid standards.
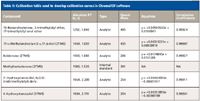
Table II: Calibration table used to develop calibration curves in ChromaTOF software
Mass Spectral Deconvolution
Figure 4 displays a deconvolution example for the trace level concentration of the derivatized anabolic steroid (19-norandrosterone) at 2 ppb. It is coeluted and buried under the endogenous anabolic steroid peak, 5α-androst-16-EN-3α-OL. The chromatogram in Figure 4 shows the extracted ion traces for the masses at m/z 315, 241, 57, and 117. The peak markers for the unique masses m/z 315 and 241 are separated by approximately 20 ms. The mass spectrum labeled A is the Caliper or (total ion mass spectra) before deconvolution. The mass spectra labeled B is the Peak True deconvoluted mass spectrum. The mass spectra labeled C is the library search match for the deconvoluted mass spectrum. A library match similarity hit of 749 out of 1000 was made for the 19-norandrosterone 2 ppb derivatized standard peak. This illustration clearly shows the deconvolution of a trace anabolic steroid even when it is buried in and masked under heavy sample matrix.
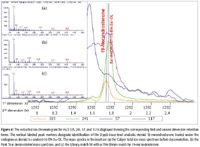
Figure 4
Conclusion
This challenging work accomplished the goals set for this research. Calibration linearity for quantitation was attained for all analytes at greater than 99.9%. Limits of detection were calculated from acquired data that achieved part per trillion sensitivity. This research demonstrated the ability of GC×GC–TOF-MS to provide improved and enhanced analyte detection, deconvolution of trace level concentrations of steroids from heavy sample matrices, as well as exceptional quantitation capabilities for the analysis of illegal anabolic steroids in complex urine sample matrix. The experimental results of this work established that significantly increased analytical performance was accomplished by utilizing comprehensive GC×GC–TOF-MS for anti-doping screening control. In conclusion the research outcome shows favorable and practical applicability of GC×GC–TOF-MS for the positive identification of anabolic steroids in urine at or below the lowest allowable concentration limits in compliance with the guidelines set by WADA.
John Heim and Doug Staples are with LECO Corporation, St. Joseph, Michigan.
References
(1) Recent Advances in Doping Analysis (12), W. Schanzer, H. Geyer, and A. Gotzmann, U. Mareck, Eds. (Sport und Buch Straub, Koln, 2004), pp. 65–68.
(2) World Anti-Doping Agency (WADA) Technical Document – TD2009MRPL The World Anti-Doping Code: The 2009 Prohibited List; International Standard.
Analysis of Pesticides in Foods Using GC–MS/MS: An Interview with José Fernando Huertas-Pérez
December 16th 2024In this LCGC International interview with José Fernando Huertas-Pérez who is a specialist in chemical contaminants analytics and mitigation at the Nestlé Institute for Food Safety and Analytical Sciences at Nestlé Research in Switzerland, In this interview we discuss his recent research work published in Food Chemistry on the subject of a method for quantifying multi-residue pesticides in food matrices using gas chromatography–tandem mass spectrometry (GC–MS/MS) (1).
The Use of SPME and GC×GC in Food Analysis: An Interview with Giorgia Purcaro
December 16th 2024LCGC International sat down with Giorgia Purcaro of the University of Liege to discuss the impact that solid-phase microextraction (SPME) and comprehensive multidimensional gas chromatography (GC×GC) is having on food analysis.


