Troubleshooting Basics, Part II: Pressure Problems
LCGC North America
A look at ways to estimate what normal system pressure should be and some likely causes of various pressure abnormalities
What do you do when the system pressure is not what it is supposed to be?
The first installment of this series on troubleshooting basics (1) was an overview of classifying a troubleshooting problem, and considered some rules of thumb that may be useful to isolate the source of various problems.
This month we'll be more specific, with a look at pressure. Often the first sign that something isn't right with your liquid chromatograph is an abnormal pressure reading — the pressure is too high, too low, cycling, or erratic. In this column, we'll look at ways to estimate what normal system pressure should be, as well as some likely causes of various pressure abnormalities.
What Is Normal?
Before we can determine if there is a pressure problem, we need to know what the normal system pressure is for a given configuration of hardware, column, and mobile phase. Pressure is a result of the resistance to flow of the mobile phase through the system, and the column is the major cause of resistance. Thus, the length, diameter, and particle size of the column are important. The mobile phase viscosity and flow rate are the other main factors. For conventional liquid chromatography (LC) systems (<6000 psi; <400 bar), the hardware (pump, autosampler, tubing, and detector) contributes little to the pressure and usually can be ignored. With ultrahigh-pressure LC (UHPLC, >6000 psi), however, narrow-bore tubing and in-line frits can result in 1000 psi or more of pressure in addition to the column, so the hardware cannot be ignored.
The easiest way to identify a pressure problem is to compare the current pressure to the normal value. I like to use two kinds of normal reference values. The first is a method-independent pressure measurement, which I'll call the "system reference pressure." To check this, install a new column that is typical of what you normally use, such as a 150 mm × 4.6 mm, 5-µm particle size (dp ) C18 column, and an easy-to-replicate mobile phase, such as 50:50 (v/v) methanol–water. Set the flow rate and column temperature at, for example, 2 mL/min and 30 °C, respectively, and allow the system to equilibrate. Record the pressure under these conditions and you can use it in the future as a reference point. To be thorough, I would also progressively disconnect the fittings at the column outlet, column inlet, in-line filter inlet (if used), and pump outlet; record the pressure after each step. Now you should have a list of pressures at various places in the flow path under these standard conditions. These reference pressures may be handy to help track down pressure abnormalities in the future.
The second reference value, which I'll call the "method reference pressure," is obtained in a similar manner, but using the normal method settings. If a gradient method is used, record the pressures under the starting conditions. You may want to shortcut the process and just record the pressure with all components installed, the column inlet disconnected, and the in-line filter (if used) disconnected; this approach will isolate the most common sources of system blockage for future reference. Because method pressure rises normally over time as frits and filters collect debris, I like to track the pressure. A convenient way to do this is to add a "starting pressure" item to the data recorded at the beginning of each batch of samples (column serial number, sample batch number, notebook reference, and so forth). These data can be used for future reference or plotted over time as a control chart to help anticipate pressure problems before they occur.
Estimating Pressure
You may want to have an estimate of what the normal system pressure should be, just as a cross-check. The technique I like for this uses equation 2.13a from reference 2:

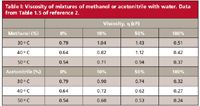
where the pressure, P (psi), is a function of the column length L (mm), diameter dc (mm), and particle size dp (µm), as well as the mobile phase viscosity η (cP) and flow rate F (mL/min). For pressure in bar, divide by 14.5. The mobile phase viscosity will depend on the components in the mobile phase and the temperature. Methanol and acetonitrile are the most common organic mobile phase components for reversed-phase LC, mixed with water or buffer. Both methanol and acetonitrile are more viscous when mixed with water, with a maximum viscosity for methanol of 50% methanol in water and for acetonitrile of 10% acetonitrile in water. I have summarized the viscosities of mixtures of methanol and acetonitrile with water at several compositions and temperatures in Table I. For a more complete listing, see Table 1.5 in reference 2.

Table I: Viscosity of mixtures of methanol or acetonitrile with water. Data from Table 1.5 of reference 2.
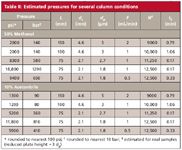
Now we can use equation 1 to estimate the pressure for a selected method. Several examples are given in Table II. I have chosen maximum-viscosity mobile phases (50:50 methanol–water and 10:90 acetonitrile–water) and 30 °C. For example, a 150 mm × 4.6 mm, 5-µm column run at 2 mL/min with the methanol mobile phase will generate approximately 2000 psi (140 bar) under these conditions. Pressure estimates, such as these, are just that — estimates — and in my experience they may be off by ±20% in many cases, and ±50% in some cases. This is because the resistance to flow of some columns may differ because of packing techniques, and the quoted nominal particle size may not be the true value. For example, a 0.1-µm difference in a nominally 2-µm particle will make a 10% difference in the calculated pressure.

Table II: Estimated pressures for several column conditions
I have included the pressure calculated for the above example and several other common column configurations in Table II; in each case the columns are selected to give approximately the same plate number, N, so a similar separation should be obtained in each case (assuming identical column chemistry). A few general observations are in order. Acetonitrile generates approximately 60% of the pressure of methanol, which is one reason it is favored for UHPLC mobile phases. This is highlighted by comparing the last two rows of each section of Table II: 1 mL/min with a 75 mm × 2.1 mm, 1.8-µm column generates too much pressure (18,800 psi) with methanol to operate even under UHPLC conditions, whereas the 11,800 psi with acetonitrile makes this flowrate feasible. For comparison, I have also included a shell-type particle. The particle size (2.7 µm) dictates the pressure, but the efficiency of the shell configuration makes them behave like a 2-µm particle in terms of plate number. The right-hand column of Table II lists the column dead-time, t0 , which can be used to compare run times for the various columns. For example, it may come as a surprise, but a separation on the 100 mm × 4.6 mm, 3-µm column takes approximately one third longer than the 150 mm × 4.6 mm, 5-µm column at the same pressure. Also, a 1.8-µm UHPLC column will cut the run time by about fourfold compared with a 3- or 5-µm column on a conventional LC system when all columns are run at reasonable system pressures. And finally, the shell-type 2.7-µm particle column shortens the run time by twofold when compared with a 1.8 µm UHPLC column when both are operated at the same pressure.
Now that we have a technique to approximate the column pressure, we can see how calculated values compare with the observed values under the system reference or method reference conditions. If you are using a UHPLC system, you'll need to add to the calculated value the system pressure observed when the column is removed, which may be 500–1000 psi.
High Pressure
A gradual increase in pressure over time is a normal symptom of column aging, and excessive pressure is often the first indicator that something is wrong with the system. In some cases, the pressure increase may be large enough to trigger the upper-pressure limit, and system shutdown may occur. High pressure is a symptom that something in the flow path is partly or completely blocked. The most common location for this will be the first frit after the autosampler because it accumulates debris from the sample or other sources. This is one of the reasons I strongly recommend using an in-line frit just downstream from the autosampler. Use a 0.5-µm porosity frit when columns with particles >2 µm are used; a 0.2-µm porosity frit is used with ≤2-µm columns. This frit has smaller porosity than the frit at the head of the guard column or column, so it will become blocked first. The frit in the in-line filter is easy and inexpensive to change, making it a quick fix for the most common high-pressure problems and a simple way to protect the expensive column from damage.
Isolate the location of the blockage by progressively loosening fittings, as described earlier, until you find the source of the pressure increase. Remember that when the column is removed, conventional systems (<6000 psi; ≤400 bar) should have negligible pressure, but UHPLC systems may normally have measurable back pressure.
If the frit at the head of the column becomes blocked, you may be able to correct the problem by back-flushing the column; this is effective about one-third of the time. Just reverse the column direction and pump 20–30 mL of mobile phase through the column to waste (not to the detector). If the pressure drops, you can leave 5-µm columns reversed. Check with the column care and use sheet for ≤3-µm columns to see if they can be safely reversed for extended use. If backflushing does not restore the column, replace the column with a new one. It may be wise to add an in-line filter or guard column (or both) if column blockage is common.
If some other component apart from the column, guard column, or in-line filter is the source of the blockage, sequentially remove connections until you isolate the location of the blockage. If the tubing is blocked, replace it. Other parts, such as injection valves, may require disassembly and reconditioning.
Low Pressure
Low pressure usually results from air in the pump, a faulty check valve, or a leak. First, check for the obvious: make sure the flow rate is set properly and that there is sufficient mobile phase in the reservoirs. Purge the pump of any bubbles by opening the purge valve and increasing the flowrate to flush 5–10 mL of mobile phase through the pump. If this does not correct the problem, verify that the pump is working properly. Perform a simple check of pump delivery by doing a timed collection of 10 mL of mobile phase in a volumetric flask; the flowrate should be within ±1% of the set point. If the pump still doesn't deliver properly, check to be sure there is sufficient solvent at the inlet to the pump. Remove the supply tubing at the pump inlet (or with a low-pressure mixer, the tubing at the proportioning manifold) and measure the flow in a graduated cylinder. Siphon flow should deliver at least 10 times as much solvent to the pump inlet as you need. For example, if you normally run 1–2 mL/min, expect to see at least 20 mL/min of siphon flow to the pump. If there is insufficient solvent at the pump, check for blocked frits in the reservoir or blocked tubing. Still another possible pump problem is a leaky pump seal; replacement of pump seals every 6–12 months should prevent this from happening for most applications.
After you are happy with the pump operation, check for leaks elsewhere in the system. You may have been alerted by a leak detector. If this is the case, the leak location should be easy to identify. Otherwise, check each fitting, especially upstream from the column, where the connections are under the most pressure. Look for visible signs of leaks, such as drops of mobile phase or white buffer residues left when leaked mobile phase evaporates. Sometimes a scrap of paper can be useful to help probe for leaks; thermal printer paper works best for this, but it is hard to come by today, so copier paper can be used instead. Cut a triangle of copier paper ≈1 cm across the base and ≈5 cm along the sides. Touch the narrow end to any suspect fittings and it will act as a wick and soak up any small leak, which should be easily visible (thermal paper will turn black). If fittings need to be tightened, it is good practice to do this with the flow off. This is especially true with finger-tightened polyether ether ketone (PEEK) fittings, because the tubing can slip in the fitting if there is pressure in the system when the fitting is adjusted. Any fittings that still leak after being tightened a quarter turn or so past their normal setting should be replaced with new parts.
Cycling or Erratic Pressure
Pressure readings that bounce around are usually the result of a faulty check valve or air in the pump. Cycling pressure usually coincides with the piston stroke of one or more pumps. The fixes to this problem are to purge the pump, clean or replace the check valves, and replace the pump seals. Persistent problems may be associated with inadequate mobile phase degassing.
Although most of us now use automatic in-line degassers, these can fail, too. I have had several cases reported to me in the last few months where in-line degasser failure caused system shut-down, pressure fluctuations, or erratic retention times.
If you are running gradients, don't forget that the pressure will increase during a gradient. For example, with a methanol–water gradient of 0–100% methanol, the setup for the first line of Table II would give a starting pressure of ≈1100 psi, which would rise to ≈2000 psi mid-gradient and would end up at ≈700 psi for 100% methanol.
Summary
We have looked at several pressure-related aspects of the LC system. First, we saw the importance of having a record of normal system pressures that can be used for comparison when a change in pressure is encountered. Equation 1 can be used to estimate the pressure produced by columns of different dimensions and particles sizes. We looked at some of the causes of, and corrections for, high, low, and cycling or erratic pressures. These should help you to isolate and eliminate the most common sources of pressure problems. But as one of my colleagues used to say, "Don't forget to check stupid!" It is amazing how often problems are related to something silly that we've done, such as letting the reservoir run dry or misprogramming the controller.

John W. Dolan
John W. Dolan"LC Troubleshooting" Editor John Dolan has been writing "LC Troubleshooting" for LCGC for more than 25 years. One of the industry's most respected professionals, John is currently the Vice President of and a principal instructor for LC Resources, Walnut Creek, California. He is also a member of LCGC's editorial advisory board. Direct correspondence about this column via e-mail to John.Dolan@LCResources.com.
References
(1) J.W. Dolan, LCGC Europe 24(7), 386–389 (2011).
(2) L.R. Snyder, J.J. Kirkland, and J.W. Dolan, Introduction to Modern Liquid Chromatography (Wiley, Hoboken, New Jersey, 3rd ed., 2010).

New Study Reviews Chromatography Methods for Flavonoid Analysis
April 21st 2025Flavonoids are widely used metabolites that carry out various functions in different industries, such as food and cosmetics. Detecting, separating, and quantifying them in fruit species can be a complicated process.
Extracting Estrogenic Hormones Using Rotating Disk and Modified Clays
April 14th 2025University of Caldas and University of Chile researchers extracted estrogenic hormones from wastewater samples using rotating disk sorption extraction. After extraction, the concentrated analytes were measured using liquid chromatography coupled with photodiode array detection (HPLC-PDA).

.png&w=3840&q=75)

.png&w=3840&q=75)


.png&w=3840&q=75)


.png&w=3840&q=75)


