Analysis of Psilocybin and Psilocin in Urine Using SPE and LC-Tandem Mass Spectrometry
LCGC North America
An SPE procedure is described that isolates both psilocybin and psilocin from urine samples for LC–MS-MS analysis.
In this study, a solid-phase extraction (SPE) procedure is described that isolates both psilocybin and psilocin from urine samples. Extraction was performed using a mixed-mode SPE column. Samples of urine were diluted with aqueous phosphate buffer (pH 6). After the sample was applied to the SPE column, the sorbent was washed with deionized water and methanol. The analytes were eluted from the SPE column with 3 mL of ethyl acetate containing 2% ammonium hydroxide followed by 3 mL of methanol containing 4% ammonium hydroxide. The individual eluates were collected, evaporated to dryness, and dissolved in mobile phase (50 µL) before being combined for analysis by liquid chromatography–tandem mass spectrometry (LC–MS-MS). Chromatography was performed in gradient mode using a C18 column and a mobile phase consisting of acetonitrile and 0.1% aqueous formic acid. The total run time for each analysis was <5 min. The limits of quantitation or detection for this method were determined to be 10 ng/mL and 5 ng/mL for both psilocybin and psilocin, respectively. The method was found to be linear from 10 ng/mL to 1000 ng/mL (r2 > 0.995) for both compounds (psilocybin and psilocin). Recoveries of the psilocybin and psilocin were found to be greater than 85%.
In many forensic laboratories, requests for testing urine samples for hallucinogenic compounds involves an analysis for psilocybin and psilocin. This testing is usually performed using methods developed for gas chromatography (GC) and GC–mass spectrometry (MS) (1). The major problem with this procedure is that the phosphate group is cleaved from the parent compound (psilocybin) leaving only the psilocin moiety. With these data, analysts are presented with only a value for the total psilocin content of the mushroom material and no indication of psilocybin levels.
Other methods have been reported using high performance liquid chromatography with ultraviolet detection (HPLC–UV) (2), or HPLC coupled to tandem mass spectrometry (LC–MS-MS) (3). These previously reported methods have used a liquid–liquid extraction (LLE) before injection. Liquid–liquid methods are known to generate matrix effects (4) that can have a significant impact on LC–MS-MS analyses. This new method utilizes the benefits of solid-phase extraction (SPE) to remove interfering materials and present a clean extract for analysis by tandem MS, thus reducing matrix effects.
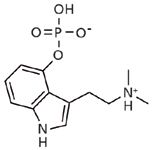
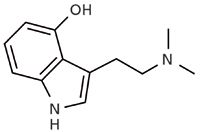
Mushrooms that contain or are suspected to contain the hallucinogenic indole alkaloids psilocybin and pscilocin (Figures 1 and 2) are commonly referred to as "magic mushrooms." These include Psilocybe cubensis, P. mexicana, P. subcubensis, P. semilanceata, and P. argentipus. These naturally occurring mushrooms have been used as traditional medicines for centuries in the religious ceremonies by shamans (or other religious persons) in Central and South America (3). Currently, they are used extensively for recreational purposes as hallucinogenic substances in various countries, including Europe, America, and Japan (5).

Figure 1: Structure of psilocybin.
The hallucinogenic ingredients psilocybin and psilocin were isolated by Hofmann and colleagues in 1958 (6). The mushrooms were found to have structural similarity to the neurotransmitter serotonin, and their highly hallucinogenic potency is thought to result from their influence on the serotoninergic nervous system (7). The contents of psilocin and psilocybin in "magic mushrooms" have been reported to vary over a wide range, from 0.14% to 0.42% and 0.37% to 1.30% by mass, respectively, in the dried mushroom (8). This wide variation has sometimes resulted in hallucinogenic intoxication by overdosing on "magic mushrooms" (9) by subjects that were unaware of the concentrations of the drugs contained in the mushroom.

Figure 2: Structure of psilocin.
Following oral ingestion of materials containing psilocybin (in other words, "magic mushrooms"), psilocybin is metabolized to psilocin via a dephosphorylation process. Psilocin undergoes deamination to produce 4-hydroxyindoleacetic acid, and it also forms a glucuronide by reaction with glucuronic acid at the 4-hydroxy group on the psilocin molecule. The specific enzymes involved in these reactions are unknown (10). Data have been reported for psilocin concentrations in biofluids (11), but not for psilocybin. This method overcomes the limitations of GC–MS and LLE by offering forensic analysts a method of quantification of both drugs in a single analysis.
Experimental
Chemicals and Reagents
Psilocybin and psilocin were obtained from Alltech Associates (Deerfield, Illinois) as 1-mg/mL methanolic solutions. The internal standard (ethyl morphine) was purchased from Cerilliant (Round Rock, Texas) as a 1-mg/mL acetonitrile solution. Acetonitrile, concentrated ammonium hydroxide solution (32% by volume), ethyl acetate, formic acid, and methanol were obtained from Fisher Scientific (Pittsburgh, Pennsylvania). The SPE columns (CSDAU206) were purchased from UCT Inc. (Bristol, Pennsylvania). Deionized (DI) water was laboratory grade, and it was generated in the Massachusetts State Police Crime Laboratory (MSPCL). The water was produced by passing water through mixed-bed ion-exchange filters followed by UV light radiation; the resulting deionized water had 18-MΩ resistivity. All chemicals were of ACS grade.
Formic acid was prepared as a 0.1% (v/v) solution by the addition of 1 mL of the acid to 900 mL of DI water and dilution to 1 L. Acetonitrile containing 0.1% formic acid (v/v) was prepared by adding 1 mL of formic acid to 900 mL of acetonitrile and diluting to 1 L. Phosphate buffer (pH 6, 0.1 M) was purchased from Fisher Scientific as a ready-to-use solution.
Chromatographic Analysis
Analysis was performed using an API 3200 Q-Trap instrument supplied by Applied Biosystems (Foster City, California). The chromatographic system consisted of a Shimadzu CBM 20 A controller, two Shimadzu LC 20 AD pumps including a degasser, a Shimadzu SIL 20 AC autosampler, and a Shimadzu CTO AC oven (set at 10 °C) (Shimadzu Scientific Instruments, Columbia, Maryland). The instrument was fitted with a 50 mm × 2 mm, 5-µm dp Imtakt US-C18 column from Silvertone Sciences (Philadelphia, Pennsylvania) and was attached to a 50 mm × 2 mm Unison US- C18 guard column that was obtained from the same supplier. The LC column oven was maintained at 40 °C throughout the analyses. The injection volume was 10 µL. The mobile phase consisted of solvent A (DI water containing 0.1% formic acid) and solvent B (acetonitrile containing 0.1% formic acid) delivered at a flow rate of 0.5 mL/min. The mobile phase gradient program was 5–90% solvent B in 4.0 min, followed by a return of the solvent B percentage to 5.0%. The instrument was readied for reinjection after 5.1 min.
MS was performed using multiple reaction monitoring (MRM) mode. The following transitions were monitored (quantification ions underlined): m/z 284.9 → 205.2, 240.0, for psilocybin and m/z 205.6 → 116.1, 115.1 for psilocin. The internal standard (ethyl morphine) was monitored at the following transitions: m/z 314.2 → 152.2, 128.3. This compound is in regular use at MSPCL as an internal standard and is unlikely to be observed in any urine samples, and the deuterated analogs of psilocybin and psilocin were unavailable from many commercial outlets at the time of writing. Tandem MS was performed under the following conditions: curtain gas setting = 15, collision gas setting = medium, ion spray voltage setting = 5000 V, temperature setting = 650 °C, ion source gas 1 setting = 50, ion source gas 2 setting = 50. Tandem MS conditions are shown in Table I. The analytical data were collected using Analyst Software Version 1.5 supplied by Applied Biosystems.

Table I: Tandem MS conditions
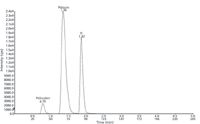
The retention times for psilocybin, psilocin, and the internal standard (ethyl morphine) were: 0.79, 1.36, and 1.87 min, respectively (Figure 3).

Figure 3: Chromatogram of drug-free urine extract spiked with psilocybin and psilocin at LOQ (10.0 ng/mL).
Sample Preparation for Analysis
Calibrators and Controls
A solution of psilocybin and psilocin was prepared at concentrations of 1 µg/mL by the dilution of 10 µL of stock solution with methanol to 10 mL in a volumetric flask. A solution of the internal standard (ethyl morphine) was prepared by diluting 10 µL of the stock solution to 10 mL with methanol in a volumetric flask. The internal standard has not been observed in any toxicological case samples at MSPCL.
Calibrators were prepared by the addition of 10, 50, 100, 100, 250, 500, and 1000 ng of psilocybin and psilocin to 1.0 mL samples of drug-free urine. To these samples 50 ng of the internal standard was added. Control samples were prepared by the addition of 10 ng and 250 ng of psilocybin and psilocin to drug-free urine in addition to 50 ng of the internal standard. All determinations were performed in duplicate. A negative control sample was prepared by the addition of only the internal standard (50 ng) to a sample of drug-free urine (1 mL).
As part of investigating the efficiency of the procedure, experiments were carried out on a qualitative basis in which DI water and 0.1 M phosphate buffer were chosen as diluents for the urine. In this part, 1 mL of DI water containing the analytes was diluted with 3 mL of DI water and 3 mL of phosphate buffer (0.1 M, pH 6), respectively. These samples were applied to conditioned SPE columns.
To assess the performance of the procedure, calibration curves were constructed twice daily over five consecutive days using the spiked controls and from those data intraday and interday values were obtained.
Solid-Phase Extraction
SPE columns were conditioned by the sequential addition of 1 × 3 mL of methanol, 1 × 3 mL of DI water, and 1 × 1 mL of 0.1 M phosphate buffer (pH 6). Each liquid was allowed to percolate through the sorbent using gravity without allowing the sorbent to dry out between steps.
Following the passage of the DI water and 0.1 M phosphate buffer (pH 6) through the SPE columns, each diluted sample (for example, calibrator, control) was loaded on to an individually marked SPE tube and flowed through the sorbent using gravitational flow. The columns were then washed with 1 × 3 mL of DI water followed by 1 × 3 mL of methanol.
The analytes were eluted from the SPE columns by the addition of 1 × 3 mL of a solution containing 2% (v/v) ammonium hydroxide in ethyl acetate, followed by 3 mL of a 4% (v/v) ammonium hydroxide in methanol solution. Both elution solvents were flowed through the sorbent with the aid of gravity and collected in separate glass tubes (75 mm × 125 mm). Glass tubes were chosen as these are standard laboratory materials in this toxicology laboratory.
The eluates from the SPE columns were evaporated to dryness using a gentle stream of nitrogen at 35 °C, after which the samples were dissolved in 250 µL of a solution consisting of 95% mobile phase A and 5% mobile phase B and combined. A representative chromatogram is shown in Figure 3.
Recovery Studies
To determine the recovery values across the dynamic range of the analysis, the results of the SPE extractions of the urine extracts (as duplicate analyses) were compared to those values obtained from unextracted standards at corresponding concentrations. The unextracted standards were prepared by evaporation of methanolic solutions of psilocybin and psilocin (containing 50 ng of the internal standard). The dried residues were dissolved in mobile phase (500 µL) before analysis by LC–MS-MS.
Matrix Effects
Studies into the matrix effects were performed according to procedures described by Matuszewski and colleagues (12). In this process, samples of drug-free urine were spiked with psilocybin and psilocin before the SPE methodology was carried out. A second set of drug-free urine extracts were analyzed according to the SPE method. Following elution from the SPE columns, the extracts were spiked with psilocybin and psilocin. Both sets of samples were evaporated to dryness under a gentle stream of nitrogen at 35 °C. The residues were dissolved in 500 µL of a solution consisting of 95% mobile phase A and 5% mobile phase B, following which the samples were combined for analysis by LC–MS-MS.
Psilocybin and psilocin solutions (concentration: 50 ng/mL of each) were infused into the tandem mass spectrometer using the on-board syringe pump (controlled by Analyst 1.5 software) via a Hamilton syringe (model 1001TLL, 1-mL volume, supplied by Fisher Scientific) at a flow rate of 5 µL/min. At the same time as the psilocybin and psilocin solution was flowing into the mass spectrometer, a 10-µL aliquot of the SPE-extracted urine matrix (drug-free urine, in other words, free of psilocybin and psilocin) was injected using the autosampler syringe on the liquid chromatograph using Analyst 1.5 software. The liquid chromatograph and mass spectrometer were arranged so that samples from the liquid chromatograph were mixed into the flow of psilocybin and psilocin via a three-port T section before the total flow entered the mass spectrometer. Any suppression effects on the psilocybin and psilocin could be monitored at the MRM transitions for these drugs.
Selectivity
In analyzing samples of urine extracts via SPE and LC–MS-MS it is essential to ensure that the interfering effects of other drug compounds can be eliminated. In this procedure, samples of methanolic mushroom extracts were spiked with 50 drugs at a concentration of 100 ng/mL (bupropion, lidocaine, methadone, amitriptyline, nortriptyline, thioridazine, trazodone, mesoridazine, pethidine, diphenhydramine, phenyltoloxamine, imipramine, desipramine, benztropine, trimethoprim, diltiazem, haloperidol, strychnine, morphine, codeine, 6-acetylmorphine, oxycodone, oxymorphone, hydrocodone, noroxycodone, hydromorphone, diazepam, nordiazepam, oxazepam, temazepam, alprazolam, α-hydroxyalprazolam, lorazepam, triazolam, α-hydroxytriazolam, flunitrazepam, 7-aminoflunitrazepam, chlordiazepoxide, midazolam, α-hydroxymidazolam, flurazepam, desalkyl-flurazepam, cocaine, ecgonine methyl ester, ecgonine ethyl ester, benzoylecgonine, cocaethylene, clonazepam, 7-aminoclonazepam, and bufotenine) and extracted according to the SPE method. The interfering effects of these compounds were not found to be significant.
Results and Discussion
Recovery
It was found that the recovery of psilocybin and psilocin from drug-free urine was 92% ± 2% and 88% ± 2%, respectively. This is an excellent indicator of the efficiency of the extraction procedure of both psilocybin and psilocin. This procedure was performed twice daily during a period of five days.
Imprecision of Analysis
The spiked control samples (10.0 ng/mL and 250.0 ng/mL) were determined to be 9.7 ng/mL ± 0.3 ng/mL and 246 ng/mL ± 3.8 ng/mL for psilocybin, and 9.2 ng/mL ± 0.4 ng/mL and 240.0 ng/mL ± 6.1 ng/mL for psilocin, respectively.
Intraday variation for psilocybin and psilocin was found to be 3% and 4%, respectively. The interday variation for psilocybin and psilocin was found to be 5% and 7%, respectively. Ion suppression studies revealed that suppression of monitored ions was <2%. This method was found to be linear (r2 > 0.995) over the 10.0–1000.0 ng/mL dynamic range for psilocybin and psilocin.
LOD and LOQ
The limit of detection (LOD) of a particular method can be defined as the level at which the signal-to-noise ratio for the particular analyte is greater than or equal than 3:1. The limit of quantification (LOQ) for a method is the level at which the signal-to-noise ratio for a particular analyte is greater than or equal to 10:1. In this study, LOD values were determined empirically by analyzing extracted samples of drug-free urine fortified with psilocybin and psilocin by LC–MS-MS according to the SPE method. This analysis was performed until the lowest level at which each of the respective analytes just failed to meet the signal-to-noise ratio of 3:1. This level was observed to be 5.0 ng/mL. In terms of LOQ, samples of drug-free urine were spiked with psilocybin and psilocin at concentrations below 250 ng/mL and extracted according to the SPE procedure until the analytes just failed to meet a signal-to-noise ratio of 10:1; this value was found to be 10.0 ng/mL.
Solid-Phase Extraction
It was observed from qualitative experiments that spiked aqueous samples diluted with 0.1 M phosphate buffer (pH 6) recovered both psilocibin and psilocin better than other diluents (such as DI water), thus urine samples were buffered before SPE. Previous experiments in this study were performed using various solvents including DI water and phosphate buffer; those experiments were conducted to optimize the sample loading conditions for urine. It was also found that omission of the acid (for example, 0.1 M acetic acid) in the wash step did not impair the extraction of either compound, and thus the SPE columns were washed with only DI water and methanol, respectively. The acid wash step is common to many mixed-mode SPE procedures (13). This acid wash step protonates the analyte for attraction onto the cation-exchange part of the SPE stationary phase. In experiments where a change in ammonium hydroxide content from 2% by volume to 4% by volume in ethyl acetate was considered, it was found that it did not improve the recovery of psilocin, whereas the increase in ammonium hydroxide in methanol did enhance the recovery of psilocybin. This part of the study was performed because the authors had encountered difficulties in the elution of psilocybin and investigated changes in ammonium hydroxide contents of the elution solvents.
An interesting phenomenon occurred in the elution stage when the analytes were eluted from the SPE columns with elution solvents A and B and the solvents were collected separately. All three compounds were confirmed (psilocin and ethyl morphine in A and psilocybin and ethyl morphine in B); if the elution solvents were collected in the same glass tube then psilocin was found to be absent. For this reason, the analytes were eluted separately, evaporated, and dissolved in individual 1-mL portions that were later combined.
Tandem MS
This project was aimed at introducing a more efficient methodology to the forensic community for the analysis of psilocybin and psilocin in urine materials. Selectivity and sensitivity (that is, the ability to detect both compounds from a complex mixture at low levels) is a highly desired quality in a new procedure, especially if it can lead to shorter turnaround times and an increase in laboratory efficiency.
Sample Stability
After the final set of urine extracts was analyzed, the sample extracts were left in the closed and cooled autosampler compartment for a period of five days. The samples were reinjected on day 3 and day 5. The values obtained were compared with those obtained from day 1. It was observed that the cooled sample kept in the dark showed no significant breakdown of psilocybin or psilocin (<5%).
Conclusion
This study demonstrates a highly efficient procedure using a novel SPE extraction method coupled to LC–MS-MS. The use of this process should greatly assist analysts in drug-related cases to quickly resolve the issues involved in reporting values for both psilocin and its parent compound (psilocybin) in biological samples.
In light of frequent acetonitrile shortages, this LC method runs for less than 5 min per sample, thus making it a very attractive prospect for laboratories engaged in the analysis of psilocybin and psilocin in forensic laboratories because it consumes only small amounts of acetonitrile and is fast.
Albert A. Elian is with the Massachusetts State Police Crime Laboratory in Sudbury, Massachusetts.
Jeffery Hackett and Michael J. Telepchak are with UCT Inc., in Bristol, Pennsylvania. Direct correspondence to: jhackett@unitedchem.com
References
(1) Controlled Substances Procedures Manual, Virginia Department of Forensic Sciences (2009) p. 83–84. Uncontrolled copy: http://www.dfs.virginia.gov/manuals/controlledSubstances/procedures/221-D100%20Controlled%20Substances%20Procedures%20Manual.pdf (accessed April 2010).
(2) B.M. Thompson, J. Forensic Sci. 25, 779–785 (1980).
(3) T. Kamata, M. Nishikawa, M. Katagi, and H. Tsuchihashi, J. Forensic Sci. 50, 1–6 (2005).
(4) E. Chambers, D.M. Wagrowski-Diehl, Z. Lu, and J.R. Mazzeo, J. Chromatogr. B. 852, 22–34 (2007).
(5) A. Hofmann, R. Heim, A. Brack, and H. Kobel, Experientia 14, 107–9 (1958).
(6) R. Kikura-Hanajiri, M. Hayashi, K. Saisho, and Y. Goda, J. Chromatogr. B. 825, 29–37 (2005).
(7) G.K. Aghajanian and G.J. Marek, Neuropsychopharamacology 21, 16S–23S (1999).
(8) K. Tsujikawa, T. Kanamori, Y. Iwata, Y. Ohmae, R. Sugita, H. Inoue, and H Kishi, Foren. Sci. Int. 138, 85–90 (2003).
(9) T. Kamata, M Nishikawa, M. Katagi, and H. Tsuchihashi, Foren. Toxicol. 24, 36–40 (2006).
(10) A.M. Yu, AAPS Journal 10, 242–253 (2008).
(11) G. Sticht and H. Kaferstein, Foren. Sci. Int. 113, 403–407 (2000).
(12) B.K. Matuszewski, M. Constanzer, and C.M. Chavez-Eng, Anal. Chem. 75, 3019–3030 (2003).
(13) UCT Solid Phase Extraction Applications Manual (2009), UCT Inc., Bristol PA (www.unitedchem.com) (accessed January 2011).

Altering Capillary Gas Chromatography Systems Using Silicon Pneumatic Microvalves
May 5th 2025Many multi-column gas chromatography systems use two-position multi-port switching valves, which can suffer from delays in valve switching. Shimadzu researchers aimed to create a new sampling and switching module for these systems.
Studying Cyclodextrins with UHPLC-MS/MS
May 5th 2025Saba Aslani from the University of Texas at Arlington spoke to LCGC International about a collaborative project with Northwestern University, the University of Hong Kong, and BioTools, Inc., investigating mirror-image cyclodextrins using ultra-high performance liquid chromatography–tandem mass spectrometry (UHPLC–MS/MS) and vibrational circular dichroism (VCD).

.png&w=3840&q=75)

.png&w=3840&q=75)


.png&w=3840&q=75)


.png&w=3840&q=75)


