Trends in Sample Preparation
LCGC North America
The results obtained from a new survey on sample preparation techniques were compared with the results of previous surveys from 1991 to March 2013. The survey investigated trends in technologies currently being used, sample loads, sample sizes, automation, the use of solid-phase extraction (SPE) devices (cartridges, disks, plates, tips), SPE chemistries, selection criteria, and problems encountered. Respondents were also asked about sample preparation technologies on the horizon.
This installment of “Sample Prep Perspectives” compares the results obtained from a new survey on sample preparation techniques with the results of previous surveys from 1991 to March 2013. The survey investigated trends in areas such as technologies currently being used, sample loads, sample sizes, automation, the use of solid-phase extraction (SPE) devices (cartridges, disks, plates, tips), SPE chemistries, selection criteria, and problems encountered. Respondents were also asked about sample preparation technologies on the horizon.
While the field of sample preparation has languished behind advances in modern chromatography, significant advances have been made in the past generation. These advances and the trends emanating from them have been the subject of periodic surveys reported in this column (1–5). While a great many laboratories are hanging on to older, traditional methods of sample preparation, others are adopting newer techniques developed over the past generation. Here not only do we assess the current state of the field, but the timing of the current survey allows us to look at longer trends over the past quarter century.
As in previous iterations of the survey, LCGC North America sent an internet-based survey to a statistically representative group of readers during the last quarter of 2015, nearly two years after the most recent survey (5). The survey used a similar set of questions to those administered previously. Although the response rate was down from the 2013 survey (5), it is still sufficient to yield useful conclusions. This installment summarizes the survey results and observes trends in sample preparation for chromatography.
Survey Audience and Sample Types
The makeup of survey respondents in the current survey is similar to that of the 2013 survey (5). Nearly half (48%) of respondents came from private industry, roughly one in seven came from academia (14.7%), a similar amount came from government (16.0%), 9.3% of those responding were from independent analytical companies, and the balance came from research institutes, hospitals and medical centers, utility companies, and others. Figure 1 compares the breakdown of the fields of work for the 2013 and 2015 survey respondents. Slight increases in the numbers of respondents working in the environmental, biotechnology, and food and beverage areas were observed at the expense of those working with organic chemicals, agriculture and food, and instrument design and development.
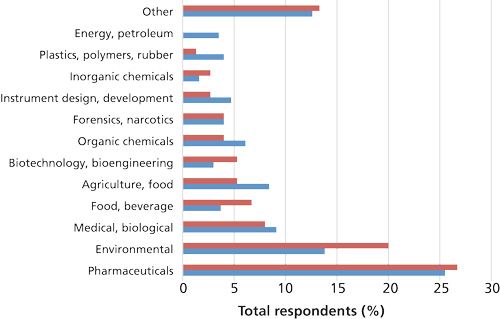
Figure 1: Fields of work of survey respondents in 2013 (blue) and 2015 (red) as a percentage of total respondents. The “Other” category includes flavors and fragrances, natural products, electronics, and paper chemicals.
Meanwhile, Figure 2 presents a Pareto chart of the typical sample types encountered by these audiences. Following the trend in the work areas of survey respondents, organic chemicals; solvents; physiological, animal, and biological tissues; waste and drinking water; oils; and essential oils each decreased in representation among sample types. However, no other categories stood out with significant increases. Pharmaceuticals and organic chemicals are the largest categories of sample types, consistent with the 2002 (4) and 2013 (5) surveys. However, in relative terms, polymers and monomers comprised the sixth most common sample type in 2013 and were the third most common in the current survey. The number of samples represented as physiological (including blood, urine, and cerebrospinal fluid), animal, and biological tissues remained high, as did fruits, vegetables, and plants. This result can be explained by the emphasis of modern research in “omics” and food safety. Because the choice of sample preparation approaches is at least partially dependent on the physical state of the sample, this was also surveyed. Table I indicates that nearly all analysts encounter liquid and solid samples and there is essentially no difference between 2013 and 2015. However, 2015 shows an increased number of samples that are gases or gels and semisolids. This is a dramatic increase compared to the results presented in 1996 (3). While the question was asked slightly differently 20 years ago, if we normalize the results to the most prevalent physical state each year, only about 17.5% of analysts encountered gas samples in 1996, while about 70% did in 2015. The increase is only slightly less dramatic for gels and semisolid samples, about 42.5% in 1996 compared with nearly 70% in 2015.
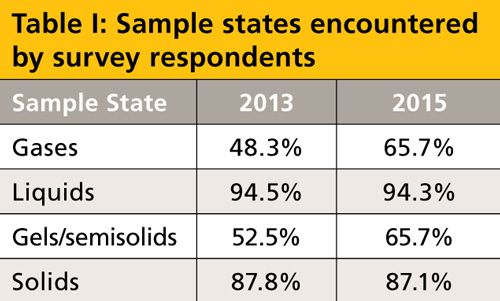
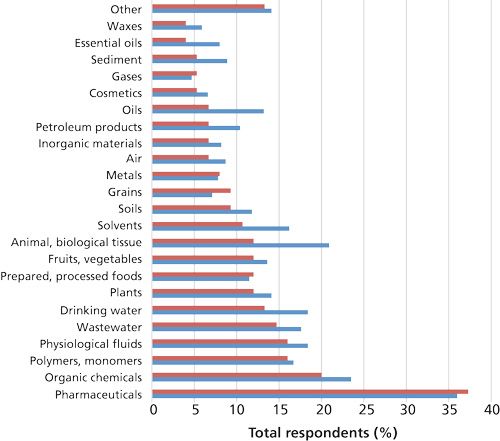
Figure 2: Sample matrices analyzed as a percentage of survey respondents in 2013 (blue) and 2015 (red). The “Other” category includes beverages, pesticides, natural products, surface water, feeds, proteins, narcotics, and eggs.
Sample Preparation Techniques
A combination of sample preparation techniques are typically used in treating a sample for analysis. We surveyed the common techniques and report their prevalence (and comparison to the 2013 survey [5]) in Figure 3. The techniques are listed in order of prevalence and, as expected, weighing, dilution, filtration, centrifugation, pH adjustment, and evaporation top the list. Compared with 2013, liquid–liquid extraction (LLE) jumped from the 12th most common technique to the sixth most common, while internal standard addition, which was seventh most common in 2013, is 12th, and concentration, which was ninth in prevalence in 2013, is 15th in the current survey. Also notable was the increased use of dilution, filtration, heating, ultrafiltration, cooling, pH adjustment, reagent addition, and centrifugation, while evaporation, solid-phase extraction, derivatization, precipitation, homogenization, purge and trap, and solvent exchange saw decreased use. The QuEChERS (quick, easy, cheap, effective, rugged, and safe) method, stir-bar sorptive extraction, and ultrasound-assisted extraction joined the survey choices this year and these techniques are seeing use by 5–10% of survey respondents. It is interesting to note that each of the techniques for which movement in usage was observed involve the use of liquid samples or liquid extracts of solid samples. Meanwhile, the newcomers to the survey (especially QuEChERS and ultrasound-assisted extraction) can be directly applied to solid samples.
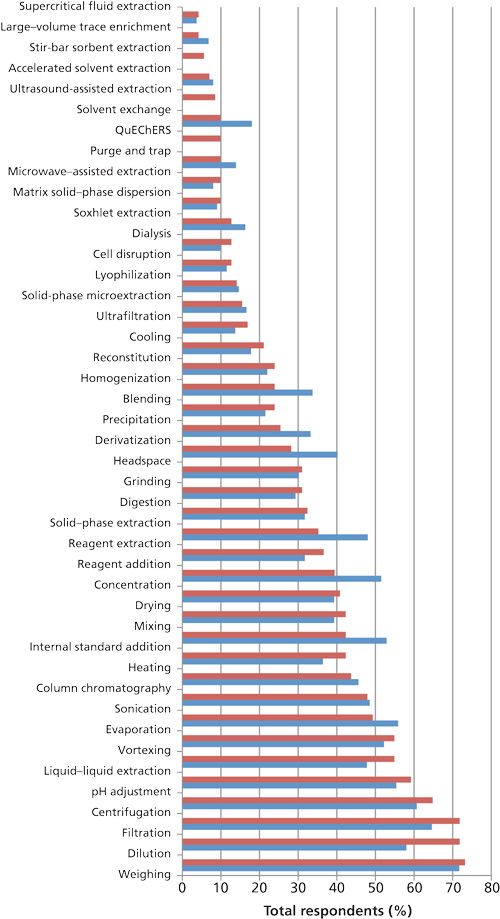
Figure 3: Sample preparation procedures currently in use (red) and those reported in 2013 (blue) as a percentage of survey respondents.
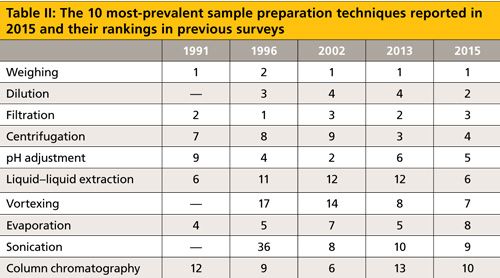
While short-term trends are interesting, it is equally important to look at longer term trends. Table II lists the 10 most prevalent techniques, listed in order of ranking, and their rankings in the 1991, 1996, 2002, and 2013 surveys (1,3–5). Dilution was apparently not surveyed in 1991, but has consistently been among the top four techniques in subsequent surveys. Vortexing was also not surveyed in 1991 and slowly climbed to this year’s seventh position. Sonication, which was also not surveyed in 1991, has been in the 10 most prevalent techniques since 2002. On the other hand, internal standard addition (third in 1991) and concentration (fifth in 1991) were not in the top 10 in the current survey (12th and 15th, respectively). Drying and grinding were among the top 10 techniques used in 1991 (drying 8th and grinding 10th), but are 14th (drying) and 19th (grinding) in 2015. Solid-phase extraction (SPE) was not included in the 1991 survey question, but consistently was the 10th or 11th most common technique in subsequent surveys and fell to 17th this year. Although there were undoubtedly differences between these surveys, the general long-term trends since 1991 are still valid and likely reflect the increased analytical emphasis in biotechnology, health care (including pharmaceuticals), bioenergy, and food science over the past 25 years.
These surveys give a snapshot of the current use of sample preparation techniques, and it is assumed that the survey respondents are representative of the global users of these technologies. That being the case, if one turns to the literature for guidance, does the literature provide an adequate reflection of actual use as indicated by the LCGC survey? To address this concern, I performed a quick keyword search on selected extraction techniques using Sci-Finder. The results presented in Figure 4 are normalized to the use of SPE. While a strong correlation (correlation coefficient = 0.6798) is found between the literature and survey results, these trends are not immediately apparent upon first looking at the data. With the exception of solid-phase microextraction (SPME), for each technique the relative literature reports lag the use by survey respondents, sometimes quite dramatically. This lag may be due to the reality that, by definition, articles in peer-reviewed journals are research-based, rather than reflecting more routine use of these methods. Additionally, the trends observed in Figure 4 may be indicative of the service, or enabling, role played by extraction in support of analytical research.
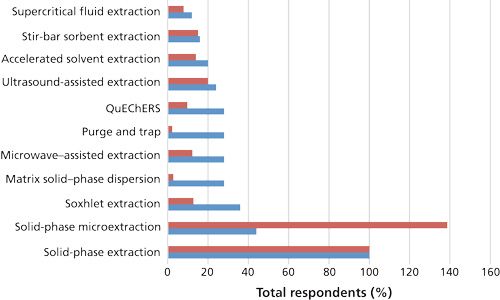
Figure 4: Use of selected extraction techniques as reported in the literature (red) and by survey respondents (blue), normalized to the use of SPE.
Looking at future use, Majors reported (5) that SPME, microwave-assisted extraction, accelerated solvent extraction (also called pressurized fluid [liquid] extraction), SPE, headspace sampling, and supercritical fluid extraction (SFE) were expected to see increased use, according to the 2013 survey respondents. Looking at the current survey results, only microwave-assisted extraction and headspace sampling actually saw increased use, and SPE remained steady; the other techniques saw slightly less use. In the 2015 survey, respondents expressed plans to use derivatization, QuEChERS, and SPME. Other techniques also receiving mild attention were accelerated solvent extraction, evaporation, homogenization, internal standard addition, large-volume trace enrichment, matrix solid-phase dispersion, microwave-assisted extraction, solvent exchange, SFE, and ultrasound-assisted extraction. These plans seem to both address changes in the analytical challenges because of emerging sample types and indicate a maturation of once-emerging technologies.
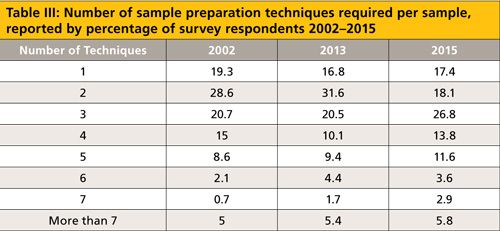
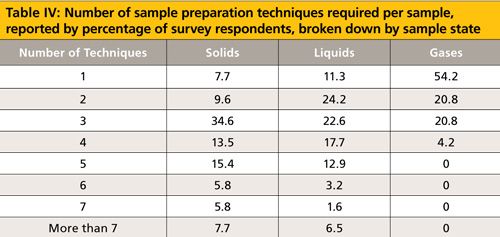
In nearly every analysis (or 82.6% of analyses according to the 2015 survey), more than one pretreatment step is needed. This ignores, for example, direct injection of gaseous samples or direct injection methods used with mass spectrometry (MS). Table III reports the number of sample preparation techniques required per sample in the three most recent surveys. In 2002 and 2013, 52% of respondents were reported to use three or more techniques per sample (4,5). That number has jumped to 65% in the current survey. My estimation is that approximately 3.5 techniques per sample, up from about three per sample previously. This is logical as most samples will be measured by mass or volume, extracted, and then have their solvent volume adjusted. Additional manipulations like cleanup, pH adjustment, addition of internal standards, and so forth, add to the sample treatment. Recalling that the great majority of survey respondents handle both solid and liquid samples and two-thirds also explore gases and semisolids (see Table I), this year we also looked at the number of sample preparation techniques per sample depending on the physical state of the sample. An estimated four techniques per sample were used for solids, slightly more than three techniques per liquid sample, and almost one and a half techniques per gaseous sample were used. For gaseous samples, every analyst used four or fewer techniques per sample, 96% used three or less, and a majority (54.2%) used only one. For liquid samples, about two thirds (64.5%) of survey respondents used between two and four techniques per sample and with solids, nearly the same number (63.5% of survey respondents) used three to five techniques per sample. With gases, direct injection following sampling is the norm. Solids, on the other hand, generally require particle size reduction or drying before extraction, in addition to similar sample pretreatments used with liquid samples.
Sample Loads
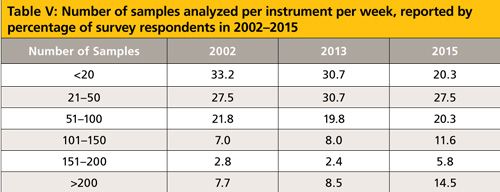
In these times of increased cost scrutiny in industry, it is no surprise that nearly all survey respondents predict their workload will increase or stay the same. In the current survey, 54% of the respondents indicated that their sample loads will increase in the next two years. I believe this is the first time in the history of these surveys that this has topped 50%. In the 2013 survey (5), 48% made this claim. Meanwhile, 45% of respondents in the present survey believe their workload will stay the same and 1% expect a decreased workload. How does this look in terms of the number of samples per instrument? This question was asked beginning in 2002 (4) and the results since then show a trend toward more samples per instrument per week. While nearly half (48%) of respondents to the current survey report 50 or less samples per instrument per week, 14.5% run more than 200 samples per instrument per week. Using the midpoint of these ranges, a very crude estimate for the average is slightly more than 80 analyses per instrument per week. Increased workloads will be reflected in increased use of automation in sample preparation and chromatography, as well as movement toward faster extractions and chromatographic separations.
Sample Characteristics
Initial Volume of Liquid and Gaseous Samples
This year we surveyed the initial sample volume separately for liquid and gaseous samples. As we observed, 94% of survey respondents dealt with liquid samples. The trend toward smaller sample volumes continued. Majors summarized that in 1996 (5) only 5.5% of the respondents had <1 mL of total sample and that number increased to 18% in 2002 and 27% in 2013. According to the 2015 survey, that number rose slightly to 30%. This trend toward smaller samples is likely because of the limited sample size of biological fluids as well as improvements in method detection limits and sensitivities, which now accommodate smaller samples. Looking at larger samples, the 2013 survey (5) noted 8% of respondents had sample volumes >100 mL, down from the historical average of around 21%. In the present survey, this number rebounded to 16.5% of survey respondents.
Shifting to gaseous samples, reported for the first time in this survey, 38% of respondents had initial sample volumes of <1 mL (29% were less than 0.5 mL) and another 38% of respondents reported sample volumes of 1–20 mL. These small volumes are likely concentrated aroma compounds including essential oils, flavors, and fragrances. On the other hand, 14% of respondents claimed initial sample volumes of 500 mL to 1 L of gas. This seems more in line with air pollution studies and similar investigations with environmental samples.
Weight of Solid Samples
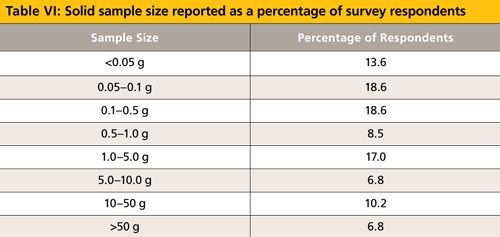
Previously, there was no clear trend in the mass of solid samples, with an even distribution of sample sizes reported (5). However, this year the questions on sample size were separated by physical state so it is easier to observe trends. As shown in Table VI, 59% of survey respondents stated that they use solid samples of 1 g or less. Turning to larger samples, 17% report sample sizes of 10 g or larger. The mode for sample size appears to be about 0.5 g.
Final Volume of Sample Before Injection
In most chromatographic methods, the pretreated sample must be in solution before injection onto the column. Often sample aliquots are retained for possible reanalysis. If any trend is gleaned from our survey, it is the shift away from small sample volumes. Table VII compares survey results from 2002 (4) and 2013 (5) with 2015. For sample volumes <1 mL, the 2015 data revert back to that observed in 2002, leading to a continued rise in the number of samples in the 1–2 mL range. Sample volumes greater than 10 mL also saw a sharp increase to 23% of samples. That 59% can be directly accommodated by standard 2-mL autosampler vials is not unexpected, though this is slightly down from 2013 and more aligned with the 2002 results. Regardless, even if one were to carefully and quantitatively concentrate the sample volume down to 100 µL (quite the challenge, I suspect, for many of us) and we use standard chromatographic injection systems, much less than 10% of our sample actually would make it onto the chromatographic column!

Concentration
As in the past two surveys (4,5), there was no change in the initial analyte concentration in the sample belonging to survey respondents. In each survey, 53% of the samples had analyte concentrations of >1 ppm and 47% encountered analyte concentrations of <1 ppm. While there were no apparent trends, Majors (5) discussed the need for extraction and concentration methods like SPE and others that provide the requisite trace enrichment and the use of sensitive detection systems. He also mentioned that analyte derivatization may provide improved detection. Given the potential for derivatization to improve the determination of trace analytes, it is interesting to note that those that use derivatization decreased from 49% in 2013 to 28% in 2015, see Figure 3.
Automation
With just two years between surveys, dramatic changes in survey results should not be expected. However, if we take another look at the discussion on sample load (see Table V), what follows is perhaps the most dramatic result in the present survey. The number of survey respondents using automated sample preparation jumped significantly, from 29% in 2013 to 39% in 2015. This change likely follows from what was reported above. Those with more than 200 samples per instrument per week rose from 8.5% to 14.5% and those expecting further increases in their sample load increased from 48% to 54% over the same survey periods. Perhaps to gain further understanding of this trend, we should examine the rationale for those who have not adopted automated sample preparation. Those that state their sample throughput does not justify automation decreased from 55% in 2013 to 51%. Note that 51% is only slightly more than the 48% who have 50 or fewer samples per instrument per week. At the same time, those that do not consider automated sample preparation necessary (31% versus 27% in 2013) is roughly the same as the number that have fewer than 20 samples per instrument per week plus less than half of those with 21–50. In addition to the sharp increase in those using automated sample preparation, the number planning to use these approaches within next year is also up, from 4% to 7%, and those reviewing its use is the same as in 2013, 11%. Cost as a reason against the use of automated sample preparation also grew, from 24% to 31%.
Regarding the types of automation used, autosamplers still predominate and their use is unchanged from the 2013 survey (83% of those using automation). Full laboratory robotics was up, from 7% to 14%, and automated liquid handlers was down, from 17% to 9%, but there was no change in other types of automated equipment.
Solid-Phase Extraction
Each of the previous surveys outlined strong use of SPE among survey respondents. SPE is perhaps the oldest of the “modern” sample preparation techniques, having been developed in the 1970s, while wide-spread developments of new technologies for the extraction of solid samples such as SFE, accelerated solvent extraction, and microwave-assisted extraction began around 1990. SPE is used for both the extractive isolation of analytes from liquid samples and for the cleanup of post-extraction solutions. A number of techniques based on solute adsorption onto stationary phases, including SPME, stir-bar sorbent extraction, and dispersive SPE (like matrix solid-phase dispersion and QuEChERS), came about at least partially as a result of the advantages of SPE as well as the needs for improvement.
One of the advantages of SPE is the variety of formats available including cartridges, disks, plates, and pipette tips. The original SPE format was based on syringe cartridges and this remains the most popular choice. Of survey respondents who use SPE, 81% use cartridges, down from 88% two years ago. The overwhelming number of users employ cartridges with 500 mg or less of sorbent, but in 2015 this was down (65%) from just over the historical trend of about 75% of users in 2013 and 2002. Most of this discrepancy can be attributed to those using the smallest amounts of SPE material (<50 mg). This decrease may be explained by the use of other SPE formats, as each of those reported saw remarkable increase in utilization. The disk format has seen growth from use by 24% in the SPE community in 2002 to 37% in 2013 and up to 60% in 2015. The most popular disk size is 47 mm, so the increased use is somewhat puzzling since we reported earlier that drinking and waste water analyses declined. The increased analysis of biological fluids and tissues would explain the increased use of the 96-well plate and pipette tip formats. The high-throughput well format, used for the rapid isolation of solutes in drug discovery and related scenarios, was introduced in 1996 (3) and in less than 20 years has seen its growth expand to 14% of SPE users in 2002, 39% in 2013, and 60% in 2015. There was no consensus regarding the sorbent mass in the well-plate format. Meanwhile in 2013, the pipette tip approach was used by 52% of SPE practitioners, and that has grown to 72% currently. It is interesting to note that if we add the percent of SPE users that employ each format (81% cartridges, 60% disks, 60% plates, and 72% pipette tips), that means each averages 2.7 of the four standard SPE formats in their laboratory.
Turning to the types of phases in SPE, 77% of users claim to employ silica-based phases, 44% use polymeric phases, and 31% use inorganic and other phases. Since the advent of this survey, octadecyl (C18), silica, octyl (C8), and ion-exchange resins have dominated the phase chemistry of silica-based material and that is true again this year, see Figure 5. Our desire for analytical selectivity in the sample preparation process is reflected by the growth in the use of affinity and application-specific or proprietary phases. In fact, the use of application-specific phases rose from 6% to 15%. Other than those phases just mentioned, each of the other phases were reported by no more than 10% of SPE users. Regarding polymeric phases, their use was down (44% compared with 62% in 2013). However, as observed in Figure 6, the overall trend in the specific phases used is similar. Finally, of those that use inorganic phases, the use of Florisil and alumina dropped strongly, from 58% in 2013 to 47% currently for Florisil and 54% to 27% for alumina. This is offset somewhat by a sharp increase in the application of graphitized carbon black, increasing from 40% to 60% over the past two years. Graphitized carbon, with a positively charged surface has both reversed-phase and anion-exchange properties and it can retain analytes covering a broad range of polarities.
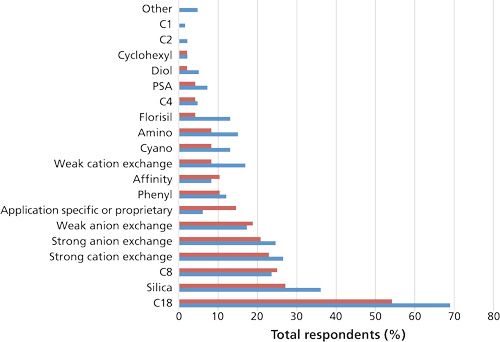
Figure 5: Silica-based SPE chemistries used, as reported in 2013 (blue) and 2015 (red).
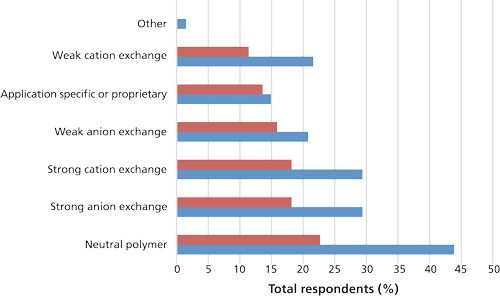
Figure 6: Polymeric-based SPE chemistries used, as reported in 2013 (blue) and 2015 (red).

Figure 7: Criteria rated as “very important” in selecting an SPE product according to the 2013 (blue) and 2015 (red) surveys.
When rating the relative importance (very important, somewhat important, important, and not important) of the criteria in selecting SPE products, batch-to-batch reproducibility reigned again, with a similar response to 2013. Direct application support, free samples, and available formats (cartridge, disk, plate material) each greatly gained in relative importance. Other criteria that gained in importance included labor time, cost, validated protocols, compatibility with automation, and brand name. Looking at the criteria related to methods and support, including brand name, makes one wonder whether SPE users are increasingly accepting of methods developed by others or if there are currently a growing number of novice workers seeking guidance. Alternatively, if we peruse the data for the criteria deemed not important, not unexpectedly, those rated very important (batch-to-batch reproducibility, labor time, and cost) were also the least frequently rated as not important. These three criteria, along with range of chemistries, are the only ones rated not important by less than 10% of SPE users. Conversely, cartridge, disk, and plate design, brand name, application bibliography, compatibility with automation, and direct application support all were rated as not important by more than 30% of respondents.
Top Problems Encountered in Sample Preparation
When survey respondents were asked to identify the top problems they encounter in sample preparation, they sang the same tune as in previous surveys. Time, recovery, reproducibility, cost, and interpretation of results have been reported since the question was first asked in 1996 (3). The 2013 and 2015 survey results are compared graphically in Figure 8. We can see increased concern with time and labor intensity and interpretation of results, less concern with sample recovery and contamination, and similar concerns with lack of reproducibility and insufficient knowledge of the sample. It would be easy to flippantly suggest that interpretation of results and insufficient knowledge about the sample are more reflective of the chemist than the sample preparation, but when looking at the “other” responses comments on limited staffing and insufficient training place the concerns systemically rather than on the individuals in the laboratory. Another problem encountered in sample preparation is concern about handling limited sample sizes. On a positive note, in the 1996 survey (3), poor sample recovery and lack of reproducibility were noted as concerns by more than 35% of respondents and these have slipped to 21% for sample recovery and 22% for irreproducibility, respectively. This decrease is most likely because of the increased attention and advances in extraction and sample preparation technologies over the past generation. Kudos to those researchers and vendors involved in this trend!
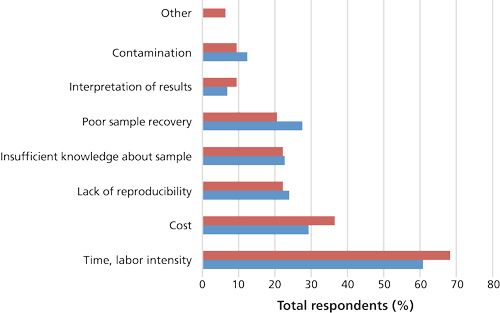
Figure 8: Top problems encountered in sample preparation in 2013 (blue) and 2015 (red).
Emerging Sample Preparation Techniques
We previously noted that of the sample preparation techniques listed in Figure 3, respondents expressed an expected increase in derivatization, QuEChERS, SPME, accelerated solvent extraction, evaporation, homogenization, internal standard addition, large-volume trace enrichment, matrix solid-phase dispersion, microwave-assisted extraction, solvent exchange, SFE, and ultrasound-assisted extraction. We separately asked a free-form question to name the three sample preparation techniques on the horizon that could become commonplace in the next five years. Techniques mentioned that are considered carry-overs from 2013 are accelerated solvent extraction, QuEChERS, SPME, supported liquid extraction, microwave-assisted extraction, and room-temperature ionic liquids. In the summary of the 2013 survey (5), Majors provided a brief description of the broad applications of these and their general use. Techniques joining that list in the most recent survey are described below:
Stir-Bar Sorptive Extraction
Already used by 5.6% of this year’s survey respondents, stir-bar sorptive extraction uses a stationary phase coated onto a magnetic stir bar for the removal of analytes from liquid solution. Because of the large volume of stationary phase (due to the large surface area), the sample capacity is high. Correspondingly, the adsorption and desorption times are long, but this potential drawback is negated by the availability of automation. Although the technique holds promise, stir-bar sorptive extraction is limited in the number of stationary phases available and vendors promoting the technique.
Restricted-Access Media
LCGC first reported the use of these materials as liquid chromatography (LC) stationary phases in 1997 (6). Just as the use of other application-specific SPE phases are seeing increased use, it follows that the tremendous selectivity advantages of restricted-access media is of strong interest for high-volume analyses.
Direct Analysis in Real Time MS
When introduced about a decade ago, this approach to sample introduction for MS seemed like the panacea, no sample preparation at all. Gas, liquid, and solid samples can be ionized under ambient conditions for MS analysis. After 10 years, the growing pains are being worked out and the promise of the technique may soon be fully realized.
Matrix Solid-Phase Dispersion
Especially useful for tissue samples, this dispersive SPE approach is seeing a resurgence because of the similarity with the initial portion of the QuEChERS method. While initially developed for the isolation of pesticides in fruits and vegetables, QuEChERS has been refined as a screening tool for a wide variety of applications. As the myriad applications are sorted out, the matrix solid-phase dispersion technique should settle into its comfort zone.
Conclusions
Although sample preparation is still considered a time- and labor-intensive step in an analytical scheme, its importance is undeniable. We have looked at short-term trends in sample preparation over the past two years, especially in the use of automation and newer instrumental extraction techniques. Similarly, some long-term trends during the past 10–25 years of this survey have been noted. The next installment of “Sample Prep Perspectives” is the annual new product review, including those sample preparation products introduced since Pittcon 2015. Since the product introductions both reflect the needs and demands of the marketplace and drive the field, it will be interesting to observe how these new products reflect the trends reported here or, on the other hand, find that these survey results are simply an anomaly.
Acknowledgment
I would like to thank those readers who took the time to respond to the rather lengthy survey. The information provided helps to keep all readers up on the latest technology in sample preparation.
References
- R.E. Majors, LCGC9(1), 16–20 (1991).
- R.E. Majors, LCGC10(12), 912–918 (1992).
- R.E. Majors, LCGC14(9), 754–766 (1996).
- R.E. Majors, LCGC North Am. 20(12), 1098–1113 (2002).
- R.E. Majors, LCGC North Am.31(3), 190–202 (2013).
- K.-S. Boos and A. Rudolphi, LCGC15(7), 606–611 (1997).

Douglas E. Raynie “Sample Prep Perspectives” editor Douglas E. Raynie is an Associate Research Professor at South Dakota State University. His research interests include green chemistry, alternative solvents, sample preparation, high-resolution chromatography, and bioprocessing in supercritical fluids. He earned his PhD in 1990 at Brigham Young University under the direction of Milton L. Lee.
For more information on this topic, please visit www.chromatographyonline.com/column-sample-prep-perspectives

Study Explores Thin-Film Extraction of Biogenic Amines via HPLC-MS/MS
March 27th 2025Scientists from Tabriz University and the University of Tabriz explored cellulose acetate-UiO-66-COOH as an affordable coating sorbent for thin film extraction of biogenic amines from cheese and alcohol-free beverages using HPLC-MS/MS.
Multi-Step Preparative LC–MS Workflow for Peptide Purification
March 21st 2025This article introduces a multi-step preparative purification workflow for synthetic peptides using liquid chromatography–mass spectrometry (LC–MS). The process involves optimizing separation conditions, scaling-up, fractionating, and confirming purity and recovery, using a single LC–MS system. High purity and recovery rates for synthetic peptides such as parathormone (PTH) are achieved. The method allows efficient purification and accurate confirmation of peptide synthesis and is suitable for handling complex preparative purification tasks.

.png&w=3840&q=75)

.png&w=3840&q=75)


.png&w=3840&q=75)


.png&w=3840&q=75)


