Flow or Velocity?
LCGC North America
Chromatographers often use the term carrier-gas flow and velocity interchangeably when discussing column parameters. In LC, the two terms scale together, but in GC they do not: Doubling the flow does not double the velocity. This month's “GC Connections” investigates the reasons for this non-intuitive behavior and how it affects best practices for gas chromatographers.
Chromatographers often use the terms carrier-gas flow and velocity interchangeably when discussing column parameters. In liquid chromatography, the two terms scale together, but in gas chromatography they do not: Doubling the flow does not double the velocity. This month’s “GC Connections” investigates the reasons for this non-intuitive behavior and how it affects best practices for gas chromatographers.
The subject of mobile-phase flow and linear velocity arises naturally in discussions of chromatography optimization. Many chromatographers may assume that doubling the flow or velocity also doubles the velocity or flow, respectively. In liquid chromatography (LC), this is certainly true if small side-effects are ignored, such as those caused by flow-driven heating. In gas chromatography (GC), however, the mobile phase is very much compressible, which leads to pressure-, flow-, and velocity-driven effects across the inlet, column, and detector that chromatographers should account for or at least understand.
How Does Your Carrier Gas Flow?
Some explanation of how gas flows through a GC column will help gain an appreciation of why flow and velocity are not proportional. In LC, the mobile phase is incompressible. As a 1-mL volume of fluid is pumped into the head of the column, 1 mL of fluid is displaced from the column exit. But the gaseous mobile phase of GC doesn’t behave this way. In both LC and GC, the column head is at an elevated pressure compared to the column outlet, otherwise there would be no flow through the column. But in GC, the gas at the beginning of the column is compressed relative to the gas at the end of the column. As a result, carrier gas moves along the length of the column more slowly at the beginning than at the end, decompressing from the inlet down to the outlet pressure along the way.
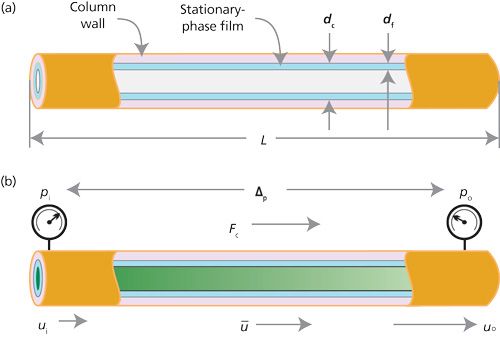
Figure 1 helps visualize this situation. Figure 1a shows some of the basic column dimensions such as length, diameter, and film thickness. Figure 1b illustrates what happens to the carrier gas velocity as gas transits the length of the column, going from the inlet pressure, pi, to the outlet pressure po. The gas velocity at the head of the column, ui, is smaller than the velocity at the outlet of the column, uo. The average gas velocity, Å« lies between these two values. The volumetric carrier gas flow rate, Fc, undergoes similar changes along the column, but usually chromatographers report its value at the column exit after correction to room temperature and pressure or to other standard conditions. These corrections are taken care of automatically with a capillary column electronic pressure control (EPC) system.

Figure 1: GC column variables. (a) Column dimensions; (b) pressure, flow, and velocity.
How are flow rate and velocity determined? Usually, gas chromatographers think in terms of the gauge pressure-the pressure displayed on a tank pressure gauge or the display of their instrument-as the primary indicator of the state of flow through the column. The column inlet pressure, or the gauge pressure, is actually the pressure drop, Δp, or pressure difference across the column between the inlet and the outlet (Figure 1b):

For example, if the outlet pressure is 101.3 kPa (14.7 psia) and the inlet pressure is 303.9 kPa (44.1 psia) then the (gauge) pressure drop across the column is 202.6 kPa (29.4 psig).
An inlet pressure regulator in constant-pressure mode tries to keep the pressure drop between the column inlet and the local atmospheric pressure constant. Of course, things are a bit more complicated when considering the effects that the inlet and outlet pressure have on the flow and velocity through an open-tubular column. Some additional terms make it convenient-at least for theoreticians-to consider the column pressures in another manner, as the relative pressure across an open-tubular column, P. It is equal to the ratio of the inlet to the outlet pressures:

So, in our example setup where the inlet and outlet pressures are expressed as the absolute pressures compared to a vacuum, the relative pressure is 3.0:

Knowing the relative and absolute outlet pressures, we can estimate the volumetric flow from theory. The laminar flow rate of a fluid through a tube can be described by the Hagen-Pouseille equation, which dates back to the mid-19th century. Originally formulated for incompressible fluids, the equation can be corrected for the effects of gas decompression along the tube or column. The correction can be expressed in terms of the relative inlet and absolute outlet pressures along the tube, and it is quite accurate as long as the flow is laminar and the temperature remains uniform along the column.
As an expression for the relative pressure needed to generate a flow rate Fc through a column of length L and radius rc with a gas viscosity η and absolute outlet pressure po, the Hagen-Pouseille equation can be written like this for nonzero outlet pressures:

In this equation, the flow rate Fc is expressed at the column temperature and the outlet pressure. It conveniently tells us what relative pressure is needed to create a particular flow rate through a given column. This and other related equations form the basis for the calculations used in an instrument’s EPC system. Fortunately, we can leave the heavy lifting to the chromatograph’s microprocessor.
Comparing Experimental and Theoretical Velocity
Successful application of EPC for open-tubular column control requires accurate parameters in the flow equations. The column length and diameter, type of carrier gas, and outlet pressure must be entered correctly. If not, there will be inconsistencies between the displayed and setpoint values of column flow and velocity compared to values measured by the operator. If the column information is correct, such inconsistencies become a valuable indicator of other instrument problems.
How can such inconsistencies be measured and put to use? The column outlet flow rate is related to the linear velocity at the column outlet by the cross-sectional area of the column:

In theory, the average carrier gas linear velocity, Å« is related to the outlet velocity, uo, by a compressibility factor, j, which relates the velocities by adjusting the outlet velocity for the effects of decompression along the column:

This is one way that the theoretical value of Å« is calculated and displayed by a GC system’s microprocessor. The actual or experimental average linear velocity is easy to measure from the unretained peak time, tM, and the column length:

Significant practical benefits result from measuring the actual average linear velocity and comparing it to the theoretical linear velocity as displayed by an instrument’s EPC system. The theoretical flow and velocity relationships (equations 5 and 6) compared to variables that can be measured in a practical way in the laboratory (equation 7) form a strong bridge from practice to theory. The former can be measured experimentally and compared to the latter on the instrument display. If they do not match well, then some column dimension or other parameter has been entered incorrectly, or there is a leak or some other error in the measurement of the unretained peak time.
Routine checking of the measured average linear velocity to the instrument’s theoretical value is something that I recommend performing every time a column is installed. The test should be carried out isothermally at a temperature where the test peak is truly unretained. For a flame-ionization detector I prefer using butane from a lighter where possible, for the convenience. For thin-film columns this choice works well at column temperatures around 50–75 °C. A thick-film column may retain butane slightly, so a higher temperature may be necessary. For a column not previously characterized this way, make a few unretained peak time measurements at increasing temperatures to find where its peak time no longer decreases.
This test can be independent of the analytical method to be used. Performed upon column installation, there is no need to repeat it until another column is installed.
Comparing Flow and Velocity
The column flow rate is important in two principal areas. When considering inlet operation, the column flow rate plays into split ratio calculations and the optimum splitless vent time. For detector operation where the flow has an influence, such as with hydrogen carrier gas and a combustion-type detector like the flame ionization detector, or with a directly interfaced mass-selective detector, the column flow rate can influence sensitivity or ionization efficiency and fragmentation patterns. On the other hand, it is more convenient (or even intuitive) to consider the average carrier gas linear velocity when thinking about column efficiency and retention times to control or optimize a separation.
Problems can arise if changes to these two carrier-influenced areas are not considered together. For example, increasing the speed of analysis by doubling the average linear velocity could be attractive if the column efficiency at the higher velocity delivers sufficient resolution for the application. But if the concomitant increase in column flow rate causes the split flow to decrease too much, or causes the flame ionization detector sensitivity to degrade, then increasing the velocity like that has to be questioned and carefully evaluated. At least, the effects need to be accommodated in the method.
Unfortunately, the relationships of GC column flow and velocity are not straightforward, because of the compressible nature of the carrier gas as discussed in the previous section. Additionally, the effect of increasing velocity on the flow rate depends on the column dimensions as well as the type of carrier gas. We can get a good idea of what can happen by graphing some examples, using equations 4, 5, and 6.
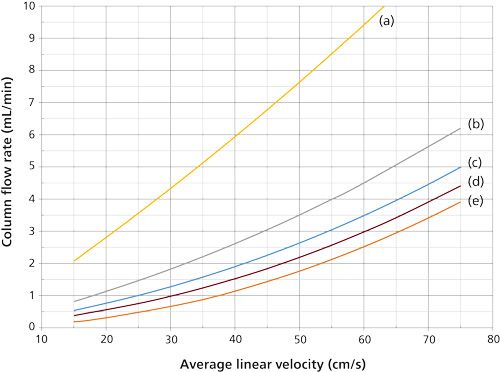
Setting the outlet pressure at 101.3 kPa (14.7 psia) and considering a 25-m long column running isothermally at a temperature of 50 °C, the families of flow-velocity curves shown in Figure 2 for helium carrier gas and Figure 3 for hydrogen carrier gas are obtained. The nonlinear relationship of flow and velocity is immediately apparent. A wide-bore, 0.53-mm i.d. column is the most nearly linear of them all because of the relatively low inlet pressures required to push carrier gas through the column. On the other hand, the microbore 0.10-mm i.d. column suffers the most from the flow–velocity effects.

Figure 2: Average linear velocity and column flow relationships using helium carrier gas and 25-m long columns at 50 °C: (a) 0.53 mm i.d., (b) 0.32 mm i.d., (c) 0.25 mm i.d., (d) 0.20 mm i.d, and (e) 0.10 mm i.d.
The narrower the column internal diameter, the more nonlinear the flow-velocity curves become. For example, the 0.53-mm i.d. column (Figure 1a) has a theoretical flow rate of about 2.75 mL/min at 20 cm/s linear velocity with helium, and at 40 cm/s the column flow increases to nearly 6 mL/min, a little more than doubling it. But, the 0.20-mm i.d. column (Figure 1d) has a flow of 1 mL/min at 30 cm/s that increases by a factor of three when doubling the velocity to 60 cm/s.
Doubling the velocity triples the flow rate for this column, which means that three times the split-vent flow rate will be needed to maintain the same split ratio. With an EPC system that also controls split flows via the split ratio the change will occur automatically. However, simply increasing the split flow by a factor of three may affect the quantitative transfer of solutes though the split inlet system. Careful revalidation of solute quantification is a must.
Tripling the column flow rate may affect the ability of a mass-selective detector’s vacuum system to maintain an acceptably low ion-source vacuum level and could degrade ionization efficiencies. If molecular fragmentation patterns are changed then the quality of library searches may be impacted.
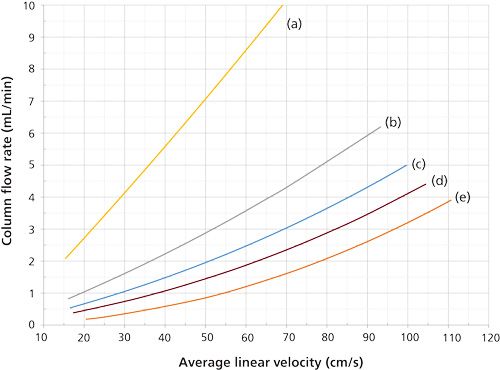
The flow–velocity effects with hydrogen carrier gas are similar, but not as large because of its lower viscosity and the resulting smaller pressure drops needed to produce desired flow rates. Looked at from the other way around, a specific outlet flow rate is reached at lower velocities with hydrogen than with helium. The curves for hydrogen in Figure 3 include the same column dimensions and flows as for Figure 2. The 0.20-mm i.d. column, Figure 2d, generates an average linear velocity of 30 cm/s at a flow rate of about 0.75 mL/min, while at 60 cm/s the flow rate increases to around 1.8 mL/min. The nonlinear effect is still present, but it is considerably less significant with hydrogen.

Figure 3: Average linear velocity and column flow relationships using hydrogen carrier gas with 25-m long columns at 50 °C: (a) 0.53 mm i.d., (b) 0.32 mm i.d., (c) 0.25 mm i.d., (d) 0.20 mm i.d., and (e) 0.10 mm i.d. Starting and ending flow rates are the same as in Figure 2.
Conclusion
Dialing in the average carrier-gas velocity to achieve desired speeds of analysis is an attractive way to optimize the efficiencies of routine laboratory analysis. Time is at a premium and any time saved performing repetitive analyses is a gain for the laboratory. Many separations operate with large excesses in peak resolving power and thus can benefit from reduced analysis time and the resulting lowered column efficiency. However, increasing the speed of analysis may have some unanticipated side-effects if faster carrier-gas velocities cause even larger increases in column flows that affect inlet and detector operations.
The nonintuitive relationship of carrier velocity and flow may cause chromatographers to unknowingly increase flow rates to a level that requires revalidation of inlet and detector performance. Of course, it always is good practice to revalidate methods after any significant changes: When doubling velocities causes flow rates to triple then thorough method reevaluation is a must.

John V. Hinshaw “GC Connections” editor John V. Hinshaw is a Senior Scientist at Serveron Corporation in Beaverton, Oregon, and a member of LCGC’s editorial advisory board. Direct correspondence about this column to the author via e-mail: lcgcedit@lcgcmag.com

Detecting Hyper-Fast Chromatographic Peaks Using Ion Mobility Spectrometry
May 6th 2025Ion mobility spectrometers can detect trace compounds quickly, though they can face various issues with detecting certain peaks. University of Hannover scientists created a new system for resolving hyper-fast gas chromatography (GC) peaks.
Altering Capillary Gas Chromatography Systems Using Silicon Pneumatic Microvalves
May 5th 2025Many multi-column gas chromatography systems use two-position multi-port switching valves, which can suffer from delays in valve switching. Shimadzu researchers aimed to create a new sampling and switching module for these systems.
New Study Reviews Chromatography Methods for Flavonoid Analysis
April 21st 2025Flavonoids are widely used metabolites that carry out various functions in different industries, such as food and cosmetics. Detecting, separating, and quantifying them in fruit species can be a complicated process.

.png&w=3840&q=75)

.png&w=3840&q=75)


.png&w=3840&q=75)


.png&w=3840&q=75)


