Trace Oxygenated Hydrocarbons in Liquid Hydrocarbon Streams by Two Dimensional GC — Method ASTM D7423 and UOP960
The Application Notebook
Deans switch two dimensional gas chromatography is a powerful tool for identification and quantitation of trace components in a complex matrix. With this setup, operators no longer work in the dark. MDGCsolution software makes the heart-cut easy and straightforward.
Deans switch two dimensional gas chromatography is a heart-cutting technique, a powerful tool to identify target compounds in complex matrices. One example is shown of identification of oxygenates in liquid petroleum gases.
It has been widely accepted that oxygenates are related to corrosion and fouling issues in refinery processes. Accurate determination of trace oxygenated hydrocarbons in liquid hydrocarbon streams plays an important role in process design and operation. Two mechanical valves are usually involved in the conventional GC design. The valve switch timing is performed on a trial-and-error basis, which can be time consuming. The Deans switch two dimensional GC system employs two Shimadzu GC-2010 Plus units, heart-cutting a portion of the first dimensional chromatogram of a non-polar column and sending to the second polar column for further separation. The instrument control and data collection have been automated by the MDGCsolution software, enabling easy method development. This study describes the method and hardware used for the determination of methanol content in liquid petroleum gas streams.

Figure 1: Chromatogram of an LPG sample.
Experimental Conditions
Shimadzu GC-2010 Plus
GC1: Column Rxi-1MS, 15 m × 0.32 mm × 0.50 µm
Flow: Constant pressure mode, 35 kPa initial pressure
Injection: 1 µL split 3:1, injector 300 °C, transfer line 280 °C, and switch pressure 20 KPa
Temperature program: 40 °C, 10 °C/min to 250 °C hold 4 min
FID: 300 °C, H2 40 mL/min, Makeup 0 mL/min, Air 400 mL/min
GC2: LowOx, 10 m × 0.53 mm × 10 µm
Temperature program: 50 °C, 10 °C/min to 250 °C hold 5 min
FID: 300 °C, H2 40 mL/min, Makeup 20 mL/min, Air 400 mL/min
Results and Discussion
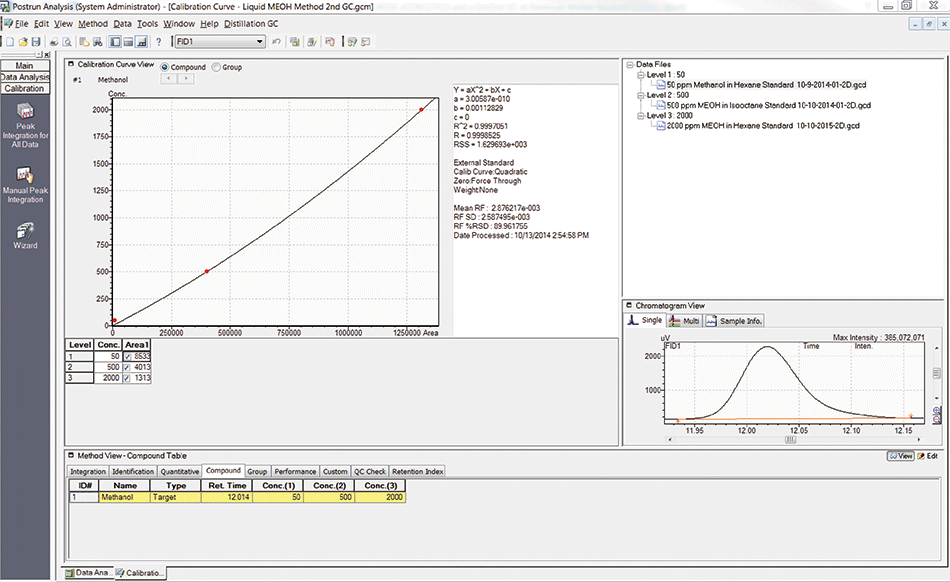
The heart-cut window of the first chromatogram was set from 0.25 min to 5.9 min. The oxygenates were separated on the second column and could be clearly quantified. Figure 1 shows a second GC chromatogram of an unknown LPG sample. Figure 2 illustrates a methanol calibration curve from 50 ppm to 1000 ppm. The methanol concentration in the unknown sample was then reported to be 308 ppm.

Figure 2: Calibration curve of ethanol.
Conclusion
Deans switch two dimensional gas chromatography is a powerful tool for identification and quantitation of trace components in a complex matrix. With this setup, operators no longer work in the dark. MDGCsolution software makes the heart-cut easy and straightforward.

Shimadzu Scientific Instruments
7102 Riverwood Drive, Columbia, MD 21046
tel. (800) 477-1227, (410) 381-1227
Website: www.ssi.shimadzu.com

Analysis of Pesticides in Foods Using GC–MS/MS: An Interview with José Fernando Huertas-Pérez
December 16th 2024In this LCGC International interview with José Fernando Huertas-Pérez who is a specialist in chemical contaminants analytics and mitigation at the Nestlé Institute for Food Safety and Analytical Sciences at Nestlé Research in Switzerland, In this interview we discuss his recent research work published in Food Chemistry on the subject of a method for quantifying multi-residue pesticides in food matrices using gas chromatography–tandem mass spectrometry (GC–MS/MS) (1).
The Use of SPME and GC×GC in Food Analysis: An Interview with Giorgia Purcaro
December 16th 2024LCGC International sat down with Giorgia Purcaro of the University of Liege to discuss the impact that solid-phase microextraction (SPME) and comprehensive multidimensional gas chromatography (GC×GC) is having on food analysis.


