Semivolatiles Analysis Using Split Injection
The Application Notebook
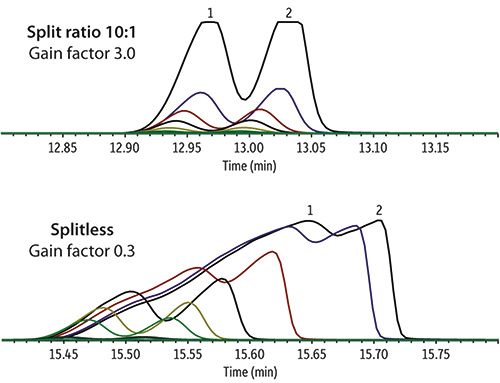
Semivolatile calibrations on this column dimension often range from 1.0 to over 100 ng/µL; however, a 0.25 mm ID column usually experiences peak overload as the mass on column approaches 10 ng. As shown in Figure 1, isobars that elute close together-such as benzo[b]fluoranthene and benzo[k]fluoranthene-quickly become unquantifiable as mass on column increases. Under split conditions, the resolution requirement (50% valley) is met for all nine calibration standards, and the peak apices shift less than 0.04 min, indicating only minor peak overload. Conversely, under splitless conditions, the three highest concentration calibration standards fail the resolution criterion. The peak fronting and resulting overlap from column overload make it impossible to generate a linear calibration including these points. Additionally, the peak apex of benzo[b]fluoranthene shifts more than 0.2 min, which could result in an erroneous compound identification.
Analyzing a broad range of semivolatile environmental pollutants at low levels requires a sensitive detector as well as an inert sample pathway. While semivolatiles analysis by methods such as EPA 8270 and EPA 625 typically does not require reporting sub nanogram-on-column concentrations, the latest generation of sensitive mass spectrometers and inert GC columns and inlet liners allow analysts to take advantage of the benefits of split injection while maintaining standard method reporting limits.
Experimental
To demonstrate the viability of this approach, we installed a 30 m × 0.25 mm × 0.25 µm Rxi®-5ms column (cat.# 13423) in an Agilent 7890B/5977A GC–MS equipped with a 220 V fast ramping oven. Helium carrier gas was used at 1.44 mL/min constant flow with 1.0 µL injections into a 4 mm Precision split inlet liner (cat.# 23305) with wool (10:1 split ratio). Full instrument conditions are available at www.restek.com in chromatogram GC_EV1418.
A nine-point calibration curve was prepared at 0.10, 0.50, 1.0, 5.0, 10, 20, 40, 80, and 120 ng/µL using Restek® certified reference materials. This corresponds to an on-column calibration range of 0.0091 to 11 ng.
Results and Discussion
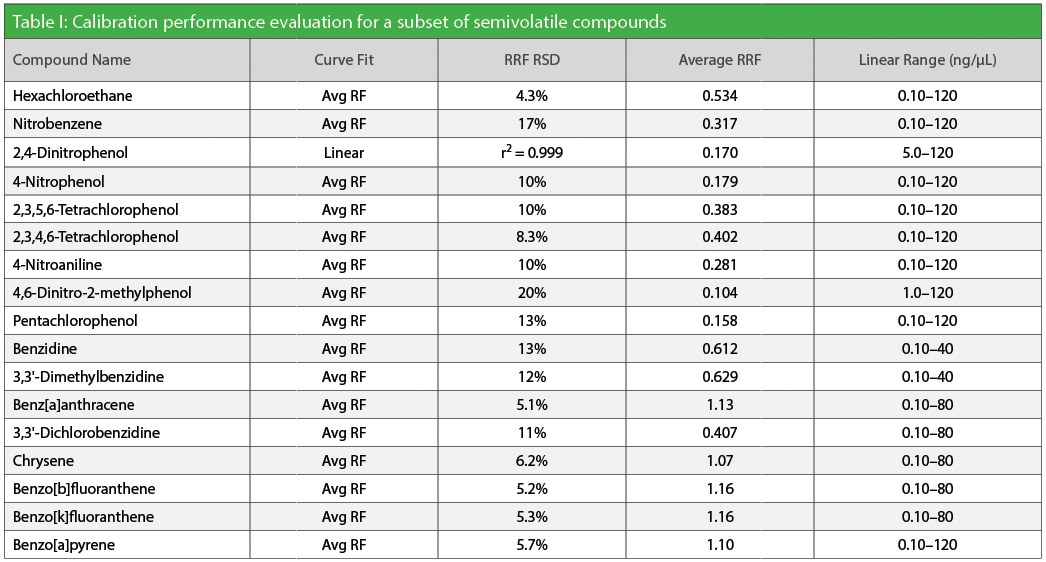
The average % RSD for the entire calibration was 7.0%, with only two compounds (2,4-dinitrophenol and benzoic acid) exceeding method criteria when evaluated by response factor (RRF) % RSD. A calibration performance summary for a subset of the compounds that were analyzed is given in Table I.

Table I: Calibration performance evaluation for a subset of semivolatile compounds
Using a 10:1 split ratio and 1.44 mL/min column flow resulted in an inlet flow of ~16 mL/min. This is significantly faster than the inlet flow under splitless conditions and causes the rapid transfer of a narrow analyte band onto the column. Under these conditions, only 9.0% of the injected sample is actually transferred onto the column, meaning the analysis of 20 undiluted samples under split conditions transfers the matrix equivalent of only 1.8 samples run under splitless conditions. Injecting less matrix greatly improves GC column lifetime and instrument uptime. Split injection provides the benefit of reducing matrix, but it also decreases levels of target analytes. Use of a highly inert Rxi®-5ms column and Precision inlet liner helps ensure these compounds reach the sensitive mass spectrometer, so reporting limits can be achieved down to 1.0 µg/L for most compounds in a 1.0 L water sample or 0.066 mg/kg in a 30 g soil sample.
Semivolatile calibrations on this column dimension often range from 1.0 to over 100 ng/µL; however, a 0.25 mm ID column usually experiences peak overload as the mass on column approaches 10 ng. As shown in Figure 1, isobars that elute close together-such as benzo[b]fluoranthene and benzo[k]fluoranthene-quickly become unquantifiable as mass on column increases. Under split conditions, the resolution requirement (50% valley) is met for all nine calibration standards, and the peak apices shift less than 0.04 min, indicating only minor peak overload. Conversely, under splitless conditions, the three highest concentration calibration standards fail the resolution criterion. The peak fronting and resulting overlap from column overload make it impossible to generate a linear calibration including these points. Additionally, the peak apex of benzo[b]fluoranthene shifts more than 0.2 min, which could result in an erroneous compound identification.

Figure 1: Extracted ion chromatogram overlay showing resolution of benzo[b]fluoranthene (peak 1) and benzo[k]fluoranthene (peak 2) when 0.1-120 ng/µL calibration standards are analyzed by split (top) and splitless (bottom) injection. The elevated gain factor for split analysis improves low-level sensitivity, but can cause detector overload for compounds with a strong molecular ion response, like these PAHs.
Conclusion
Split injection is a viable alternative to splitless injection for semivolatiles analysis. When coupled with a sensitive MS detector and highly inert analytical column and inlet liner, reporting limits can be achieved with the benefits of reduced matrix per injection, longer column lifetimes, and less downtime for maintenance.

Restek Corporation
110 Benner Circle, Bellefonte, PA 16823
tel. (800) 356-1688, fax (814) 353-1309
Website: www.restek.com

Analyzing Vitamin K1 Levels in Vegetables Eaten by Warfarin Patients Using HPLC UV–vis
April 9th 2025Research conducted by the Universitas Padjadjaran (Sumedang, Indonesia) focused on the measurement of vitamin K1 in various vegetables (specifically lettuce, cabbage, napa cabbage, and spinach) that were ingested by patients using warfarin. High performance liquid chromatography (HPLC) equipped with an ultraviolet detector set at 245 nm was used as the analytical technique.
Removing Double-Stranded RNA Impurities Using Chromatography
April 8th 2025Researchers from Agency for Science, Technology and Research in Singapore recently published a review article exploring how chromatography can be used to remove double-stranded RNA impurities during mRNA therapeutics production.
The Effect of Time and Tide On PFAS Concentrations in Estuaries
April 8th 2025Oliver Jones and Navneet Singh from RMIT University, Melbourne, Australia discuss a recent study they conducted to investigate the relationship between tidal cycles and PFAS concentrations in estuarine systems, and offer practical advice on the sample preparation and LC–MS/MS techniques they used to achieve the best results.
Assessing Safety of Medications During Pregnancy and Breastfeeding with LC–MS/MS
Published: April 8th 2025 | Updated: April 8th 2025Researchers conducted a study on medications used in psychiatry and neurology during the perinatal period, assessing how antiepileptic drugs (AEDs) affect placental functions, including transport mechanisms, nutrient transport, and trophoblast differentiation. Several quantitative methods, such as those for antianxiety and hypnotic drugs, were established to evaluate the safety of pharmacotherapy during breastfeeding using liquid chromatography-tandem mass spectrometry (LC–MS/MS).


