There is No Time to Waste: Low-Pressure Gas Chromatography– Mass Spectrometry is a Proven Solution for Fast, Sensitive, and Robust GC–MS Analysis
Low-pressure gas chromatography (LPGC)–MS should be the first option in many GC–MS applications to provide fast, sensitive, and robust analyses; and the installation, instrumentation, and implementation of LPGC is possible in any GC–MS system.
Low-pressure gas chromatography (LPGC) has been known to be advantageous compared to standard GC since Giddings first described the concept in 1962, but a practical solution for its use eluded analytical chemists until the year 2000, when de Zeeuw fashioned a simple guard column restrictor concept to maintain positive inlet pressure for a wide-bore analytical column under vacuum. Initially introduced as rapid mass spectrometry (MS), de Zeeuw’s invention made LPGC practical in nearly any GC application using MS for detection. Lehotay and associates have demonstrated the advantageous features, excellent performance, and practical utility of LPGC–MS in dozens of publications since 2001. In our experience, LPGC–MS is the most practical and beneficial fast-GC technique available to achieve <10 min analyses in applications that typically take 20–40 min. Sample capacity and column robustness are increased greatly using LPGC to permit large-volume injection with standard inlets without column maintenance, and, because vacuum conditions generate taller and narrower peaks that are still suitable for standard MS data acquisition rates, sensitivity is also increased. Furthermore, enhanced selectivity of detection using modern MS tools and software compensate for reduced chromatographic peak capacity. In our view, LPGC–MS should be the first option for evaluation in many GC–MS applications to provide fast, sensitive, and robust analyses.
Because nearly all forms of mass spectrometry (MS) require vacuum systems for operation as a detector in gas chromatography (GC), GC–MS has inherently entailed vacuum outlet column conditions since its inception. All existing commercial GC–MS instruments and software include a setting in the GC–MS column configuration to compensate for the detector vacuum, so that carrier gas flow rates can be controlled accurately. Thus, there is nothing special about the installation, instrumentation, or implementation of low pressure (LP) GC in any GC–MS system.
Rather than the subambient pressure only partially extending up the column, in LPGC the partial vacuum extends up the entire analytical column length. That difference is the essence of LPGC that provides excellent advantages over traditional GC, as a result of the reduced viscosity of the carrier gas and lower vapor pressure of the analytes under vacuum conditions.
In 1962, J. Calvin Giddings first described the advantages of vacuum conditions (1). In 2015, Sapozhnikova and Lehotay reviewed the history, features, and applications of LPGC–MS at the time (2).
The aim of this article is to update that review, dispel misconceptions, and report new developments for the benefit of those currently using traditional GC–MS that takes >15 min per analysis. In comparison with ultrahigh-performance liquid chromatography (UHPLC) which dominates the field of chromatography (3), many analysts think standard GC–MS takes too long, and they are usually right! Many if not most current GC–MS or GC–tandem mass spectrometry (GC–MS/MS) applications could be done 2-4 times faster by using LPGC without any changes in instrumentation, while improving the quality of results and greatly enhancing robustness.
In our view, LPGC should be the default column configuration for GC–MS instruments, particularly for MS/MS, to save time in most applications. If LPGC flow rate and oven programming conditions, among other means, cannot be developed to meet specific application demands, then a different column phase or dimensions should be installed, just as has been normally done since the dawn of column chromatography. For Lehotay and associates, use of LPGC–MS has been the default tool for GC-amenable analytes since 2001 (2,4), and we encourage others to also stop wasting time in their GC–MS analyses. LPGC–MS is inexpensive and very easy to try, and some manufacturers have traditionally provided free columns for testing purposes in marketable applications.
The Story of LPGC
Even though chromatographers knew vacuum conditions would speed GC separations since 1962 (1), practical limitations in instrumental design made research on the topic difficult. Starting in the 1980s, extensive work was published by Cramers and Leclercq, who presented the unique benefits and detailed theory behind LPGC (5–10). Noting these benefits, Yost and associates devised hardware and described initial LPGC–MS applications in a series of publications involving injection conditions under subambient pressure (11–15). However, these approaches required specialized inlets that were impractical for widespread implementation.
The key breakthrough in the ease-of-use and practicality of LPGC–MS occurred in 2000, when de Zeeuw and associates introduced (16) and patented (17) a new concept to employ a narrow capillary guard column as a restrictor at the inlet. This simple and effective design maintained normal pressures using standard inlets for GC, connected to an analytical GC column with dimensions such that the vacuum outlet conditions would extend all the way up the column. Figure 1 displays a current example of LPGC column dimensions that can be installed on any GC–MS instrument, just as any other pair of columns connected by a union are installed. Some vendors offer the preconnected LPGC column set as a stock product or custom order; thus users do not need to make the column connection themselves.
Figure 1: A common column configuration for vacuum LPGC–MS applications. The restriction/guard capillary fits within the analytical column for a zero-dead volume union, and the integrated transfer line (ITL) section has no stationary phase to degrade in the continuously hot transfer line. Note: “xx” refers to any vendor brand column.
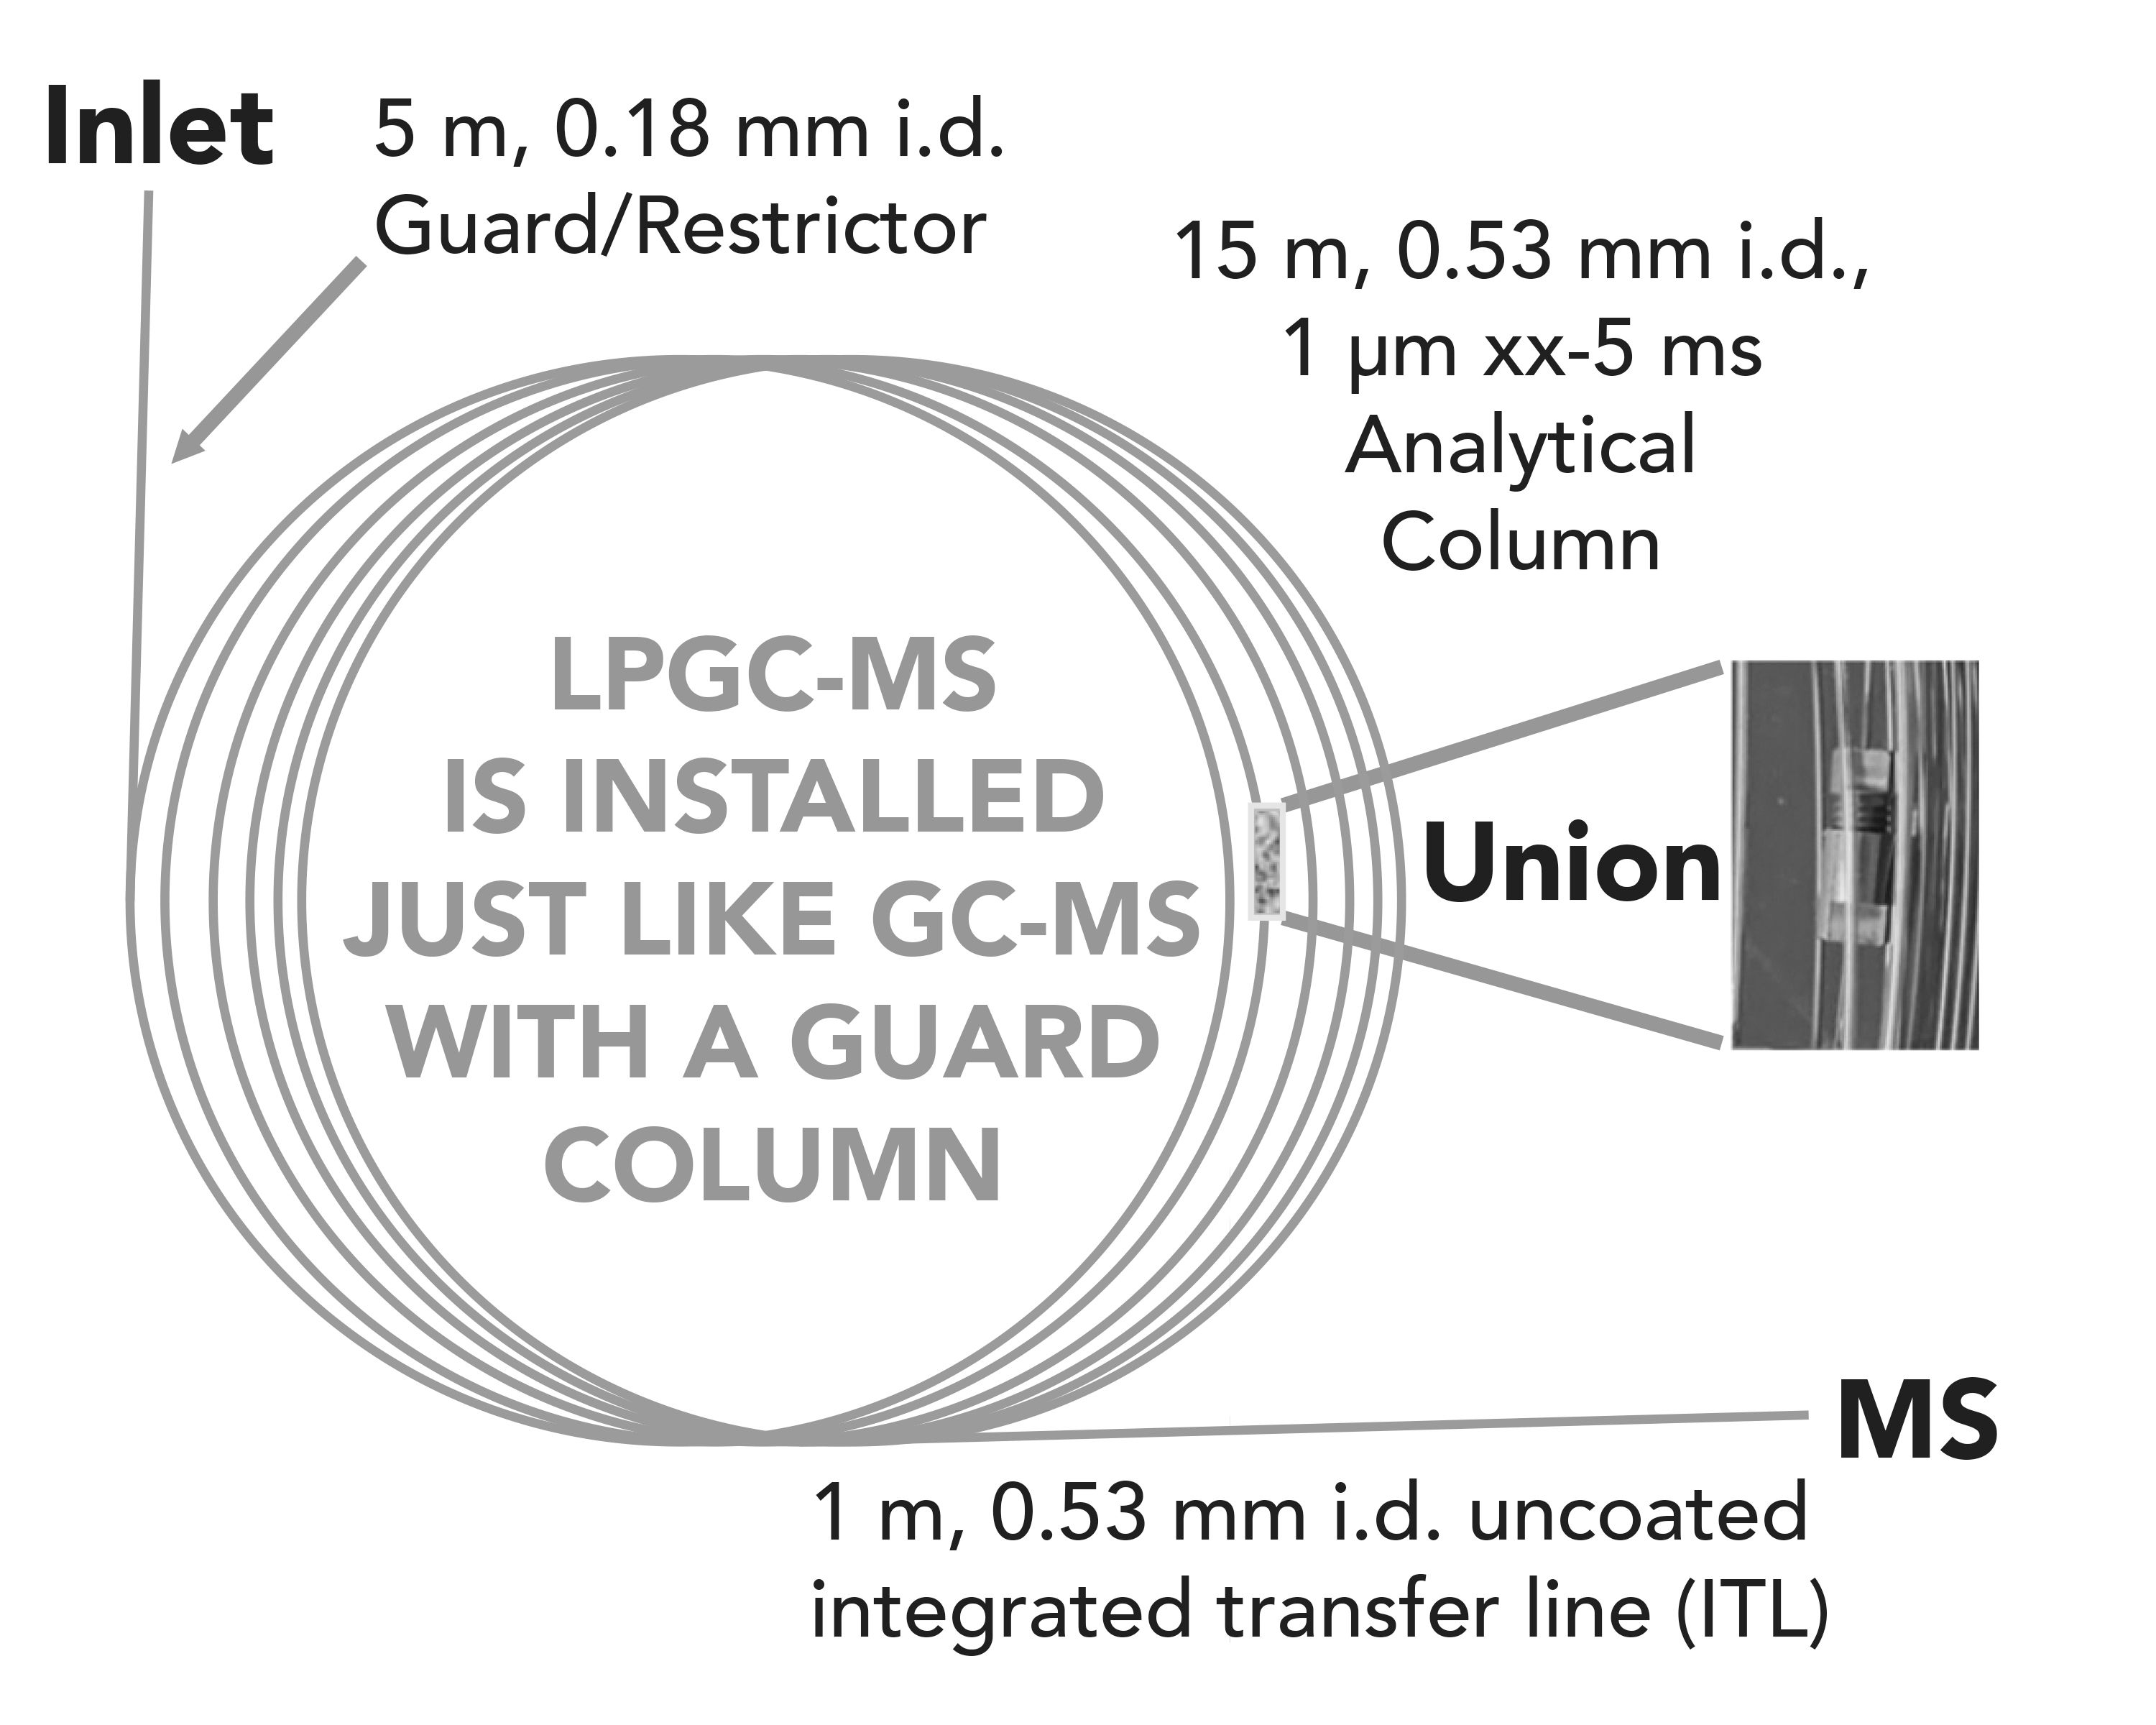
We emphasize this point because certain others without experience in the technique have mischaracterized LPGC as lacking robustness (18) or requiring special instrumentation (19). LPGC–MS/MS was mentioned in a recent review, (20) but that is not always the case (21-22). The truth is that LPGC trades excess separation power for many advantages, as mentioned below, and it is no different in practice from standard GC–MS using a guard column, as should already be used in any case.
In 2003, Maštovská and Lehotay reviewed and compared different approaches to fast GC–MS (23), and although the technology of MS-based detection has greatly improved since then, GC is a long-established analytical tool that has not undergone fundamental developments in the past 20 years (22). The review of fast GC–MS in 2003 remains fundamentally relevant today in describing the benefits and costs among the different means to speed GC–MS, and LPGC still serves as the best overall practical option for rapid analysis of semivolatile and nonvolatile GC-amenable analytes.
LPGC Configuration Options
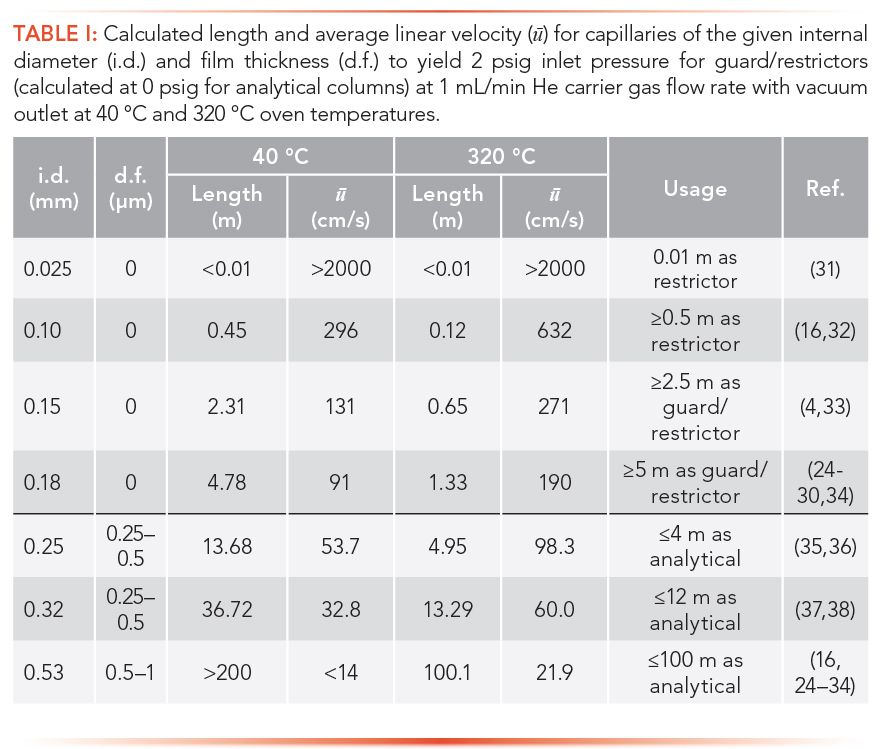
Figure 1 illustrates the “standard” configuration option for LPGC–MS used by Lehotay and associates for the past several years (24–30), but it is also an option of convenience that has been shown to work. Not all possible column pairs, dimensions, stationary phases, and film thicknesses have been studied, and this topic still remains ripe for investigation nearly 60 years from its first mention (1). Table I presents a range of possible combinations that can be implemented in LPGC with any type of guard column capillary and stationary phase already available for any GC application. Several references listed in Table I describe the use of these different combinations in LPGC applications (24–38).
Although the LPGC–MS concept was initially introduced commercially as rapid-MS using a 0.6 m, 0.1 mm i.d. restrictor/guard capillary fitted to a 10 m, 0.53 mm i.d., 1 µm film thickness analytical column (16), restriction capillaries <0.15 mm i.d. tend to become contaminated too quickly with co-injected matrix components. This is why in 2001, Maštovská and associates (4) employed a 3 m, 0.15 mm i.d. guard/restrictor capillary for the 10 m, 0.53 mm i.d., 1 µm film thickness analytical column. In time, this was extended to a 5 m, 0.18 mm i.d. guard/restrictor and 15 m analytical column to provide even more robustness and an increased number of theoretical plates relative to the 10 m column (24–30). General use of a 30 m, 0.53 mm i.d. column with 0.5-1 µm film thickness may be even better, but this has yet to be reported in the literature.
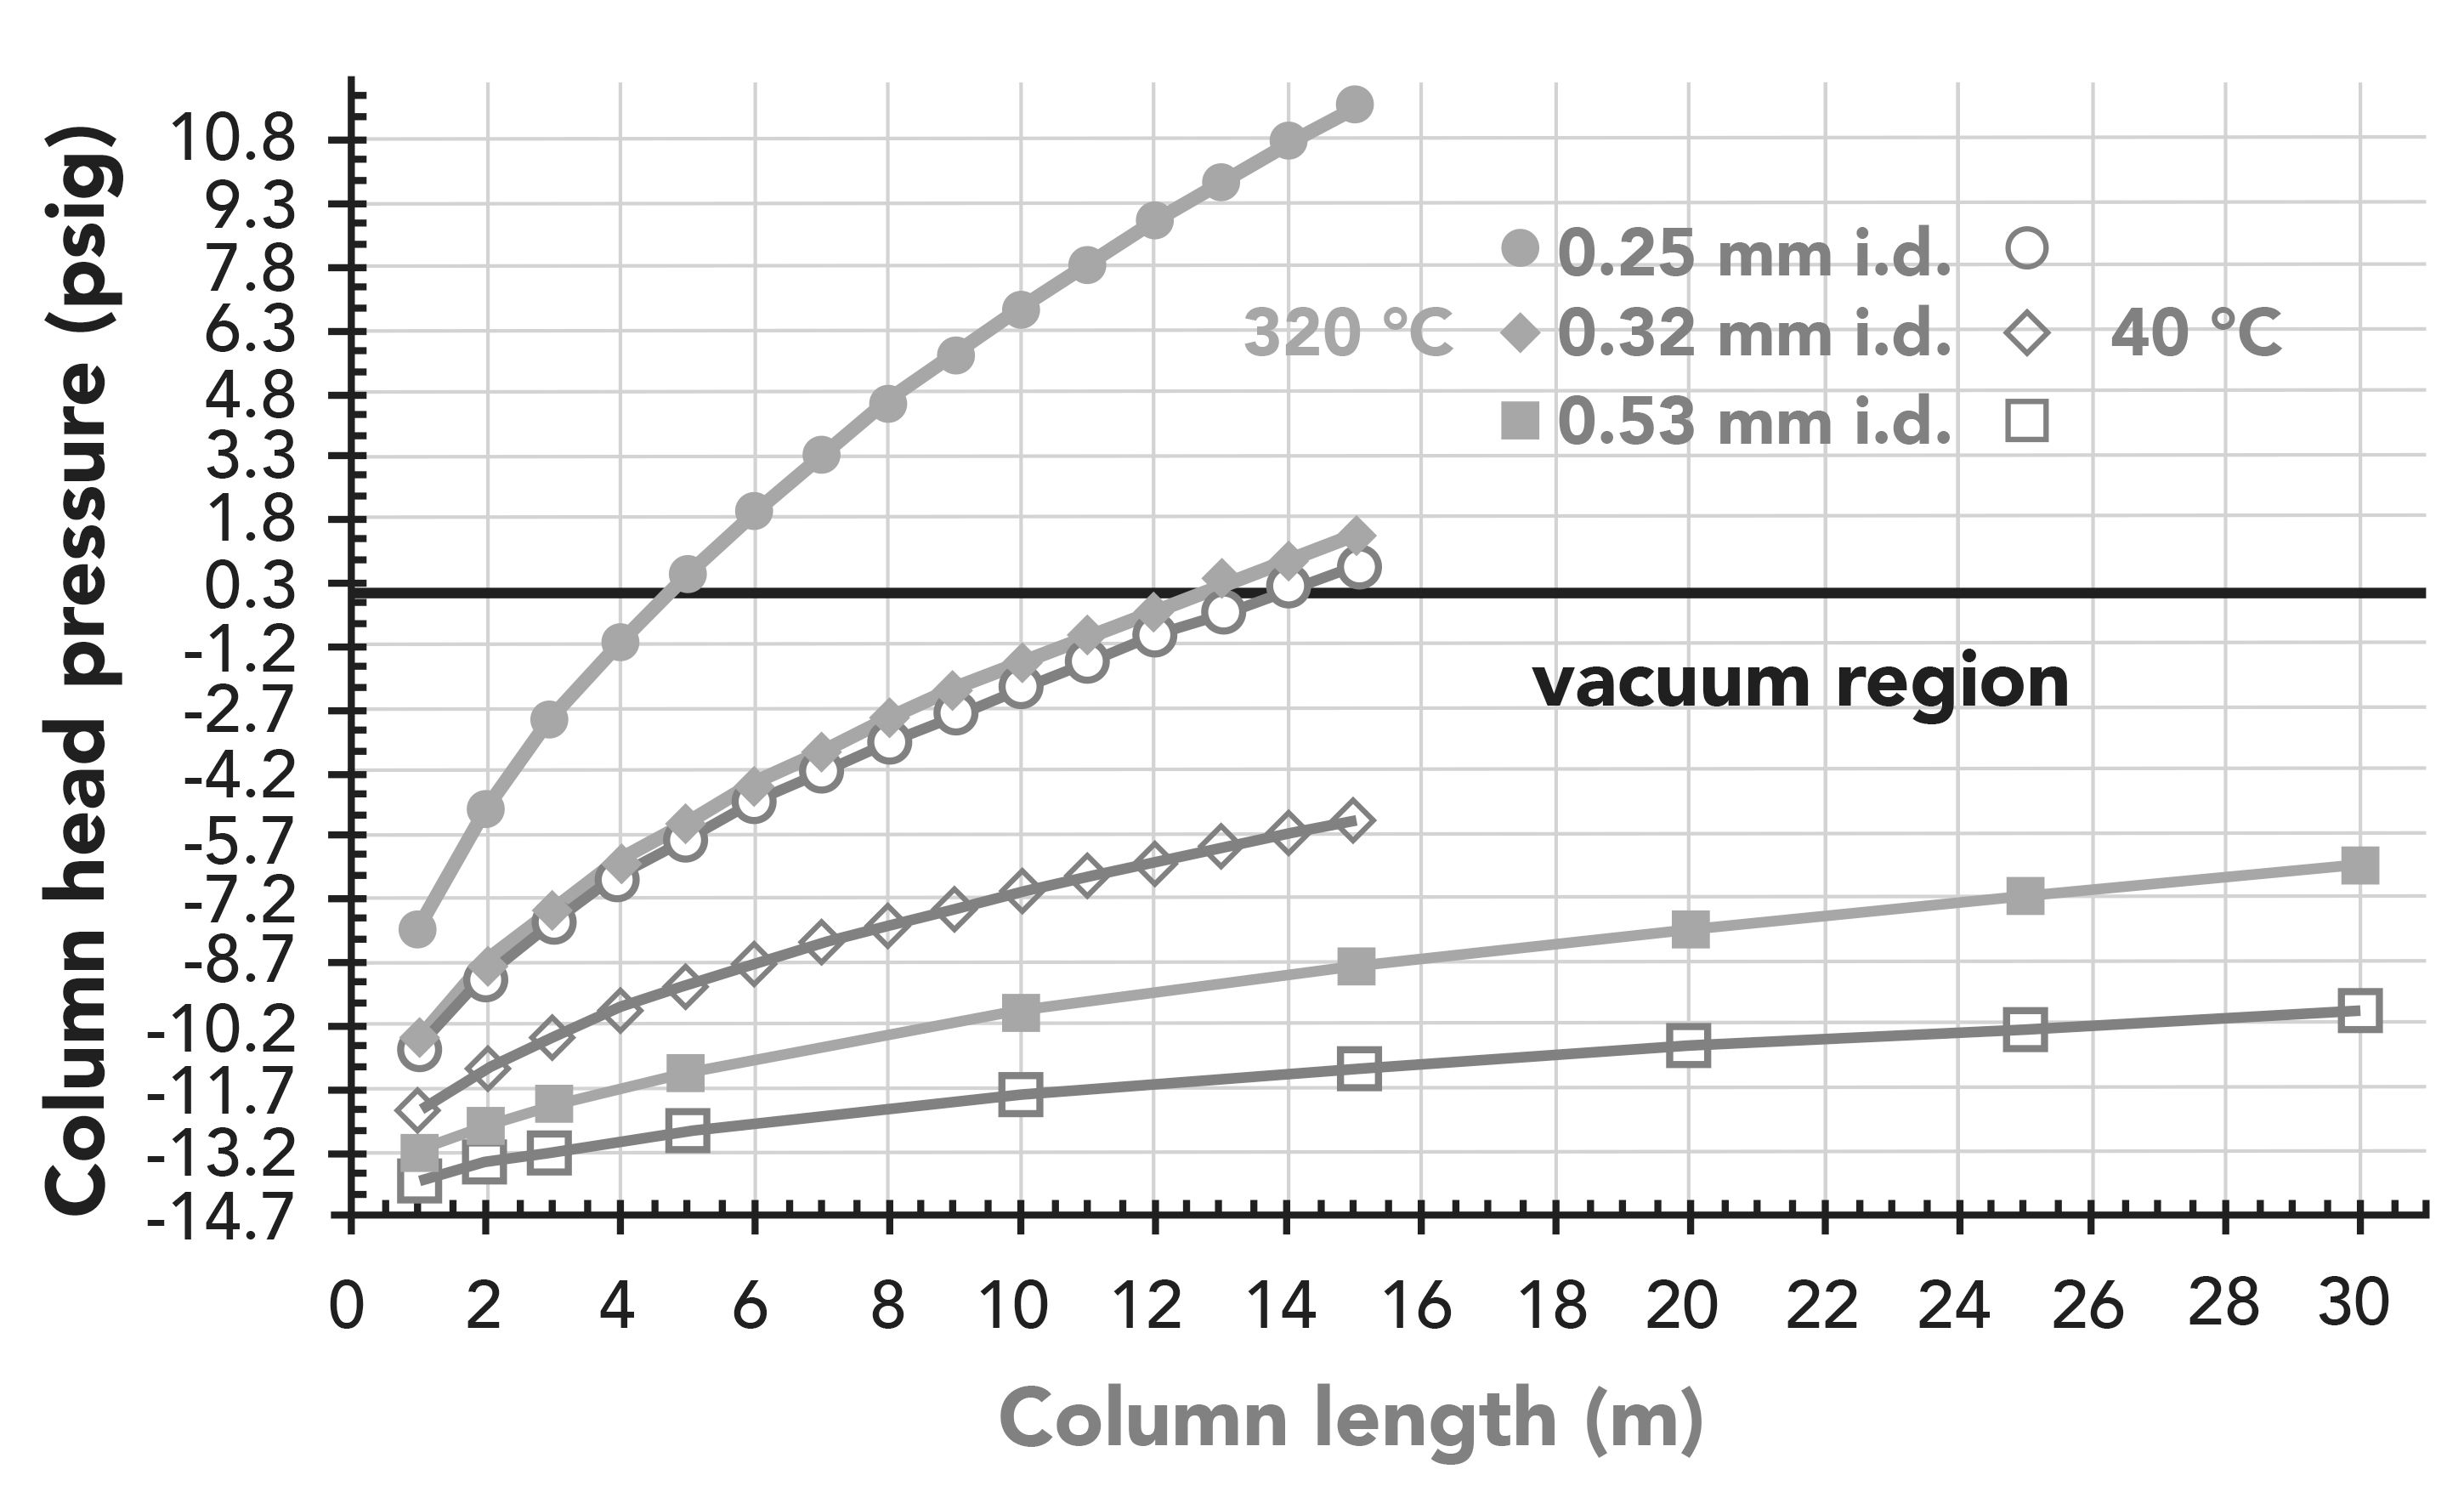
In an extension of Table I, Figure 2 displays analytical column head pressures with He carrier gas flow rate of 1 mL/min at the vacuum outlet (-14.7 psig = 0 Torr, and 0 psig = 1 atm = 101 kPa). The plots were calculated using FlowCalc software (as in Table I) at the practical GC oven temperature extremes of 40 °C and 320 °C for different lengths of 0.25, 0.32, and 0.53 mm i.d. analytical columns with 0.25, 0.5, and 1 µm film thicknesses, respectively (39,40). Most applications start with a higher GC oven temperature, which extends the vacuum up a longer column, but the main point shown is that LPGC occurs at a wide range of GC–MS working conditions for ≤4 m of 0.25 mm i.d. columns, ≤12 m of 0.32 mm i.d columns, and ≤100 m for 0.53 mm i.d. columns (Table I). In any case, the pressure and properties of the carrier gas within the columns are a continuum, and there is no rule that dictates for any method to maintain LPGC conditions from start to finish during chromatography.
Figure 2: Calculated head pressures vs. length of analytical columns of different dimensions in LPGC–MS with 1 mL/min He carrier gas at vacuum outlet conditions.
Integrated Transfer Line
The current “default” LPGC column configuration is shown in Figure 1, which includes a 1 m integrated transfer line (ITL) section of uncoated capillary that extends into the continuously hot transfer line of the MS detector. There is no additional column connection to be made, and the concept is the same as an integrated guard column in GC, except the uncoated capillary is inserted into the transfer line rather than the inlet. Among its advantages, an ITL reduces column bleed because the stationary phase is not exposed to the hot transfer line to the MS ion source even when the GC oven is cool. Also, the ITL avoids band broadening when the transfer line is cooler than the GC oven, which would also slightly slow the separation. In a related benefit, the ITL allows setting of a lower transfer line temperature to reduce possible thermal degradation of analytes. The ITL is continuously deactivated by stationary phase bleed components, thus minimizing analyte tailing. Additionally, analyte protectants (APs) that fill active sites throughout the GC–MS system are frequently utilized to reduce analyte interactions with the active sites on glass and metal surfaces (41,42).
Most importantly, the ITL eliminates the chance that stationary phase is degraded at the transfer line hot spot when exposed to oxygen or water. Carrier gas and injected samples contain traces of air or water that can damage the column when it is >120 °C (43). Thus, even if the GC oven is cool at the start of the analysis, the transfer line is typically >250 °C where the co-injected O2 and H2O will oxidize the stationary phase, unless the ITL is used. Once the stationary phase polymer is degraded anywhere on the column, a chain reaction will occur throughout the column, eventually leading to very high column bleed, worse analytical performance, and replacement of the column. The ITL provides long-term robustness and cost savings when employed in GC–MS, not only by reducing costs associated with more replacement columns, but also by reducing the down time needed to make the more frequent replacements that are needed when the ITL is not used.
Features of LPGC–MS
Speed of Analysis
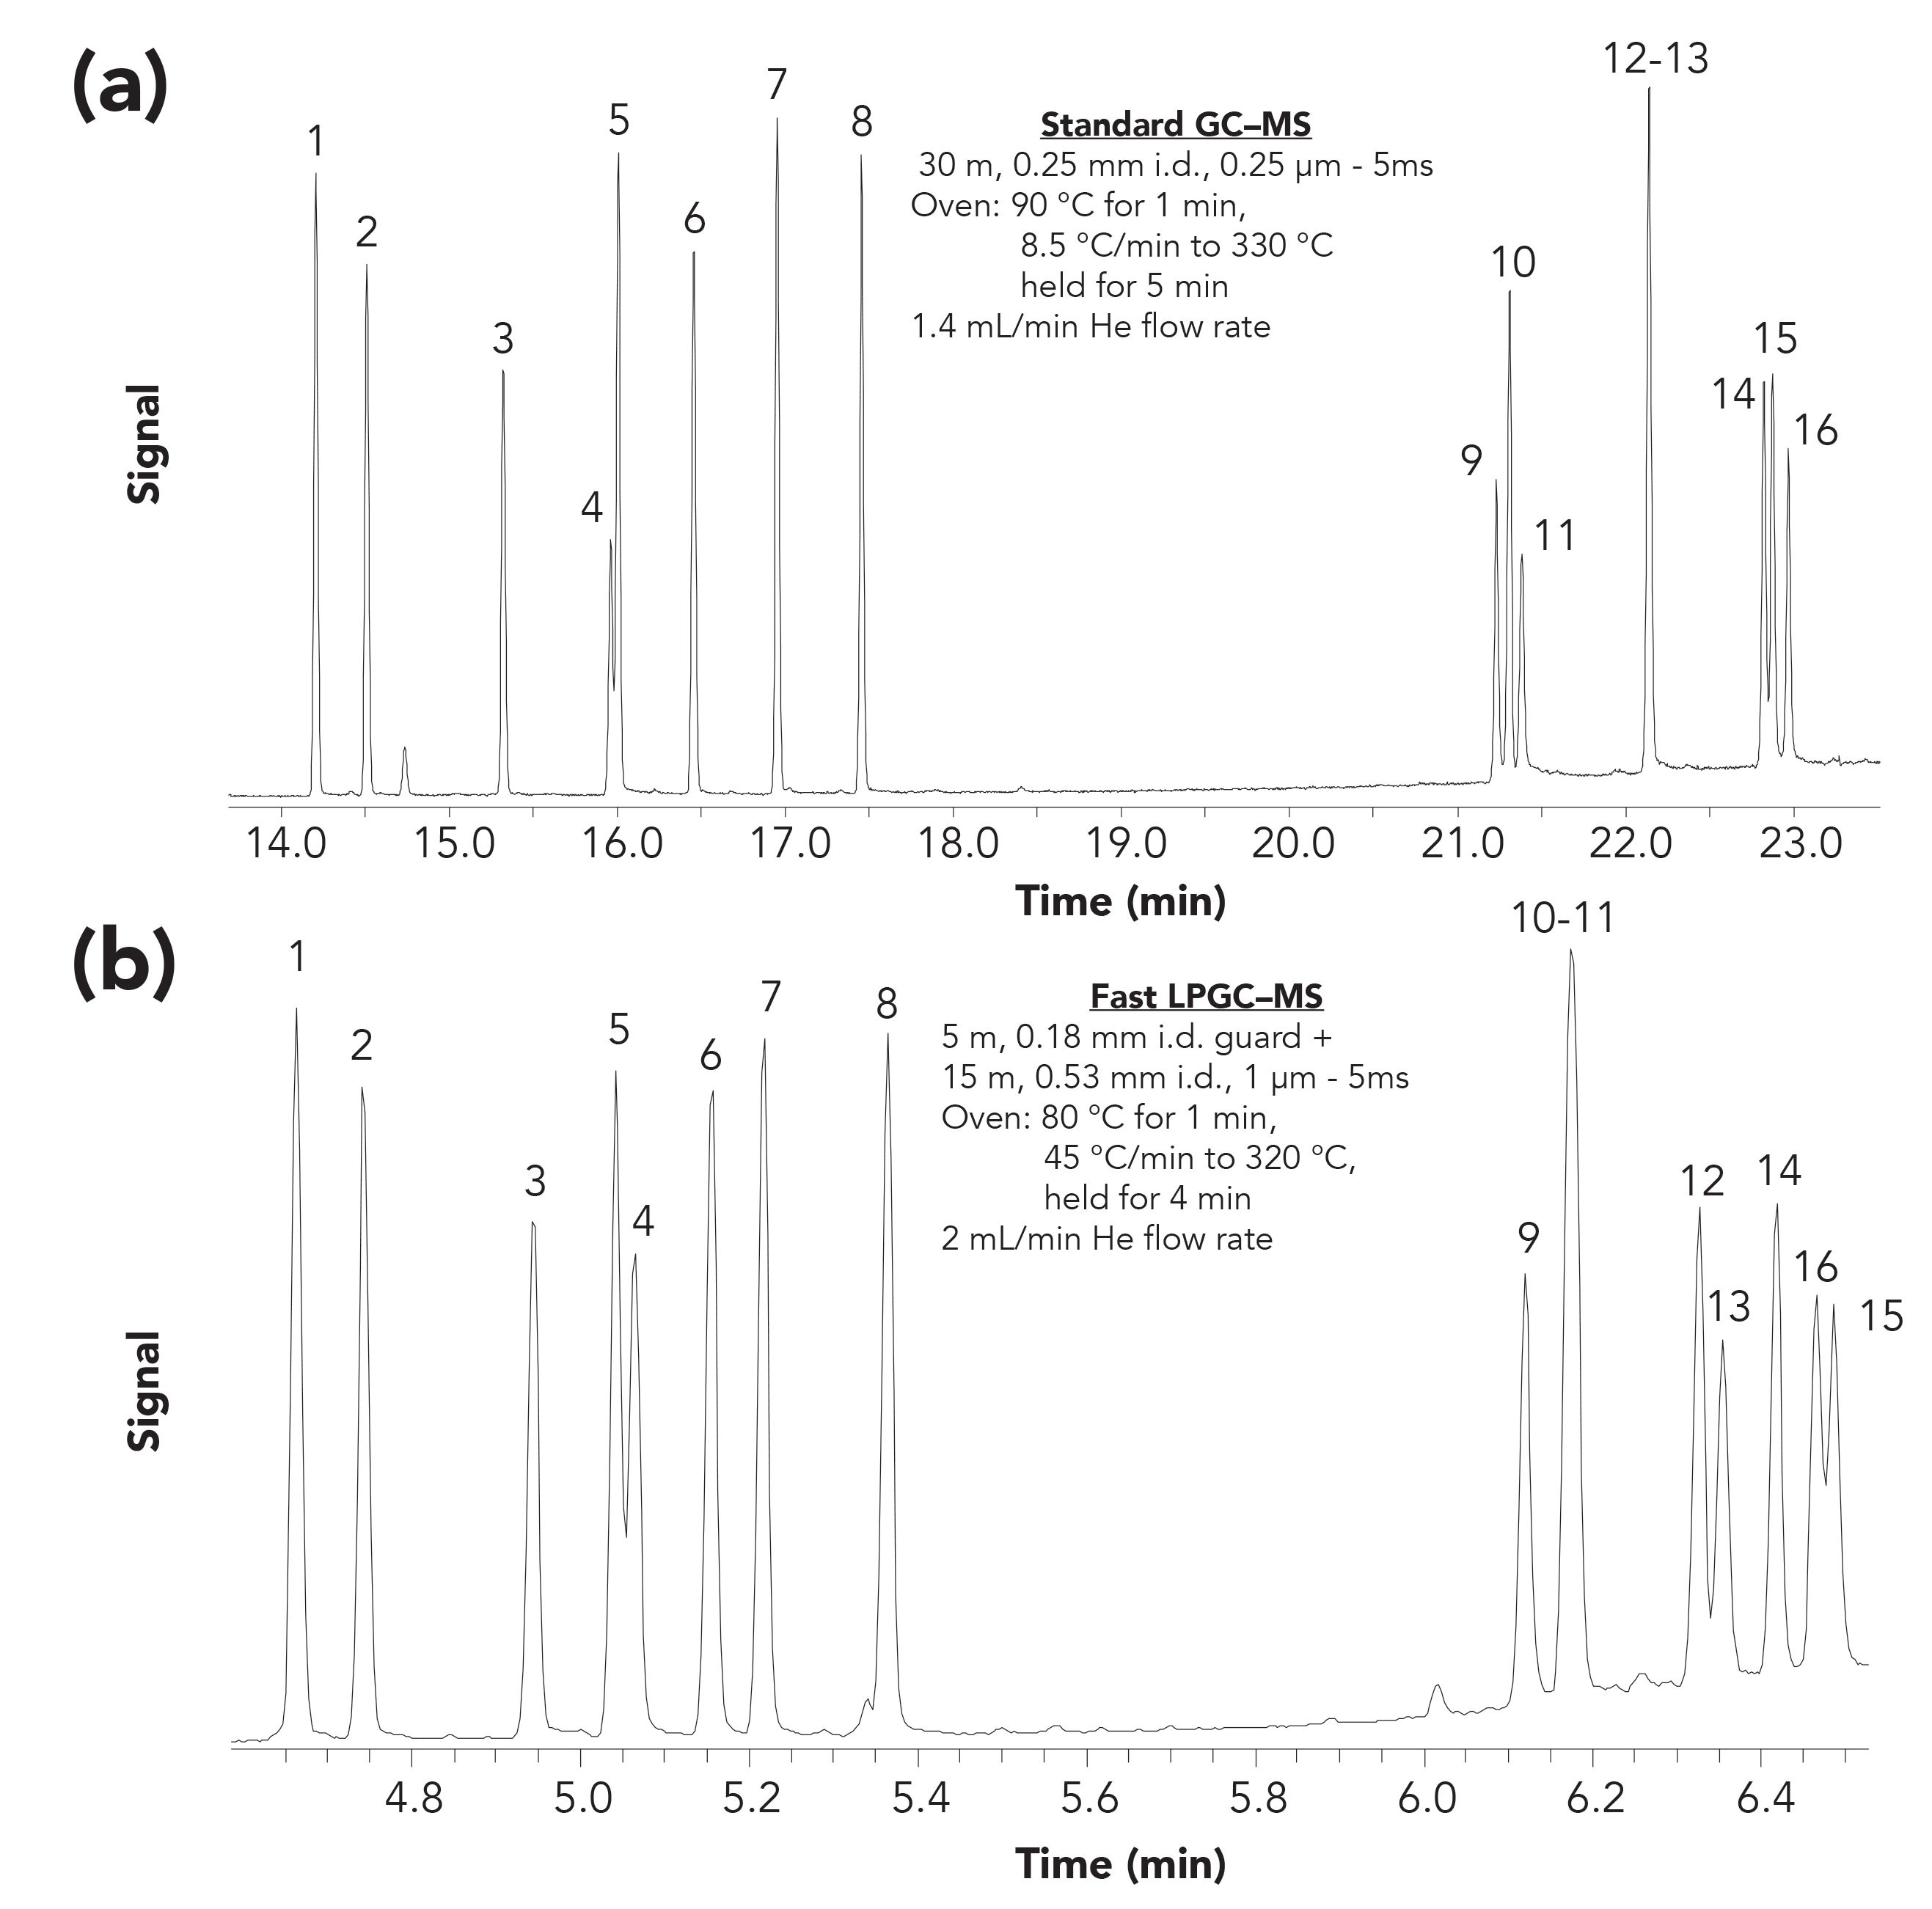
Figure 3 compares a typical GC–MS full-scan total ion chromatogram of pesticides using a 30 m, 0.25 mm i.d., 0.25 µm film thickness column to LPGC with the column set shown in Figure 1. The analysis time was decreased from 34 min to 10 min in this example, but the separation remained similar because the peak widths were cut in half from ≈5 s to ≈2.5 s by using LPGC. As described by Klee and Blumberg (44), the elution order of the analytes may change due to flow rate and column dimension differences, which occurred twice in this comparison. The use of slightly different 5% phenyl phases in this comparison might also have contributed to elution order changes. Moreover, both standard GC and LPGC conditions led to one co-elution of a different pair of analytes. Although the comparison shown is not ideal because speed, separation efficiency, and MS detection sensitivity and selectivity were not optimized, the figure demonstrates that LPGC can match standard GC separations in less than a third of the time.
Figure 3: Comparison of full scan total ion chromatograms (m/z is 50–550) for (a) standard GC–MS with (b) LPGC–MS (1 µL splitless injection of a 2 ng/µL pesticide solution): 1) diazinon, 2) isazophos, 3) chlorpyrifos-methyl, 4) fenitrothion, 5) pirimiphos-methyl, 6) chlorpyrifos, 7) pirimiphos-ethyl, 8) quinalphos, 9) pyridaphenthion, 10) phosmet, 11) EPN, 12) phosalone, 13) azinphos-methyl, 14) pyrazophos, 15) azinphos-ethyl, and 16) pyraclofos.
Because column chromatography entails sequential analyses, speed of separation comprises the primary means to achieve high sample throughput. Figure 4 shows a simple, yet realistic, demonstration of the benefit of speed on sample throughput and sample batch sizes. Most laboratories use 20–50 min GC methods that limit their batch sizes in GC sequences to <50 samples. Using LPGC–MS(and UHPLC–MSin parallel), the USDA laboratories routinely obtain results within 24 h when conducting method validations of multiple matrices involving up to 100 samples in the same sequence with n = 10 at multiple spiking levels (26–29). The same could be done for routine samples, if sample preparation allows, and Lehotay and associates have devised the next generation of semi-automated high-throughput sample preparation that they call the QuEChERSER (“more than QuEChERS”) mega-method to meet this need (30,45,46). To speed targeted analyte peak integrations and data handling, Lehotay and colleagues employ the summation peak integration function by default (a common option in instrument software) to minimize data review and eliminate manual re-integrations (24–30,45–47).
Figure 4: Comparison of the time or sample throughput gained by using LPGC–MS with a 13 min analytical cycle time vs. 23–33 min.
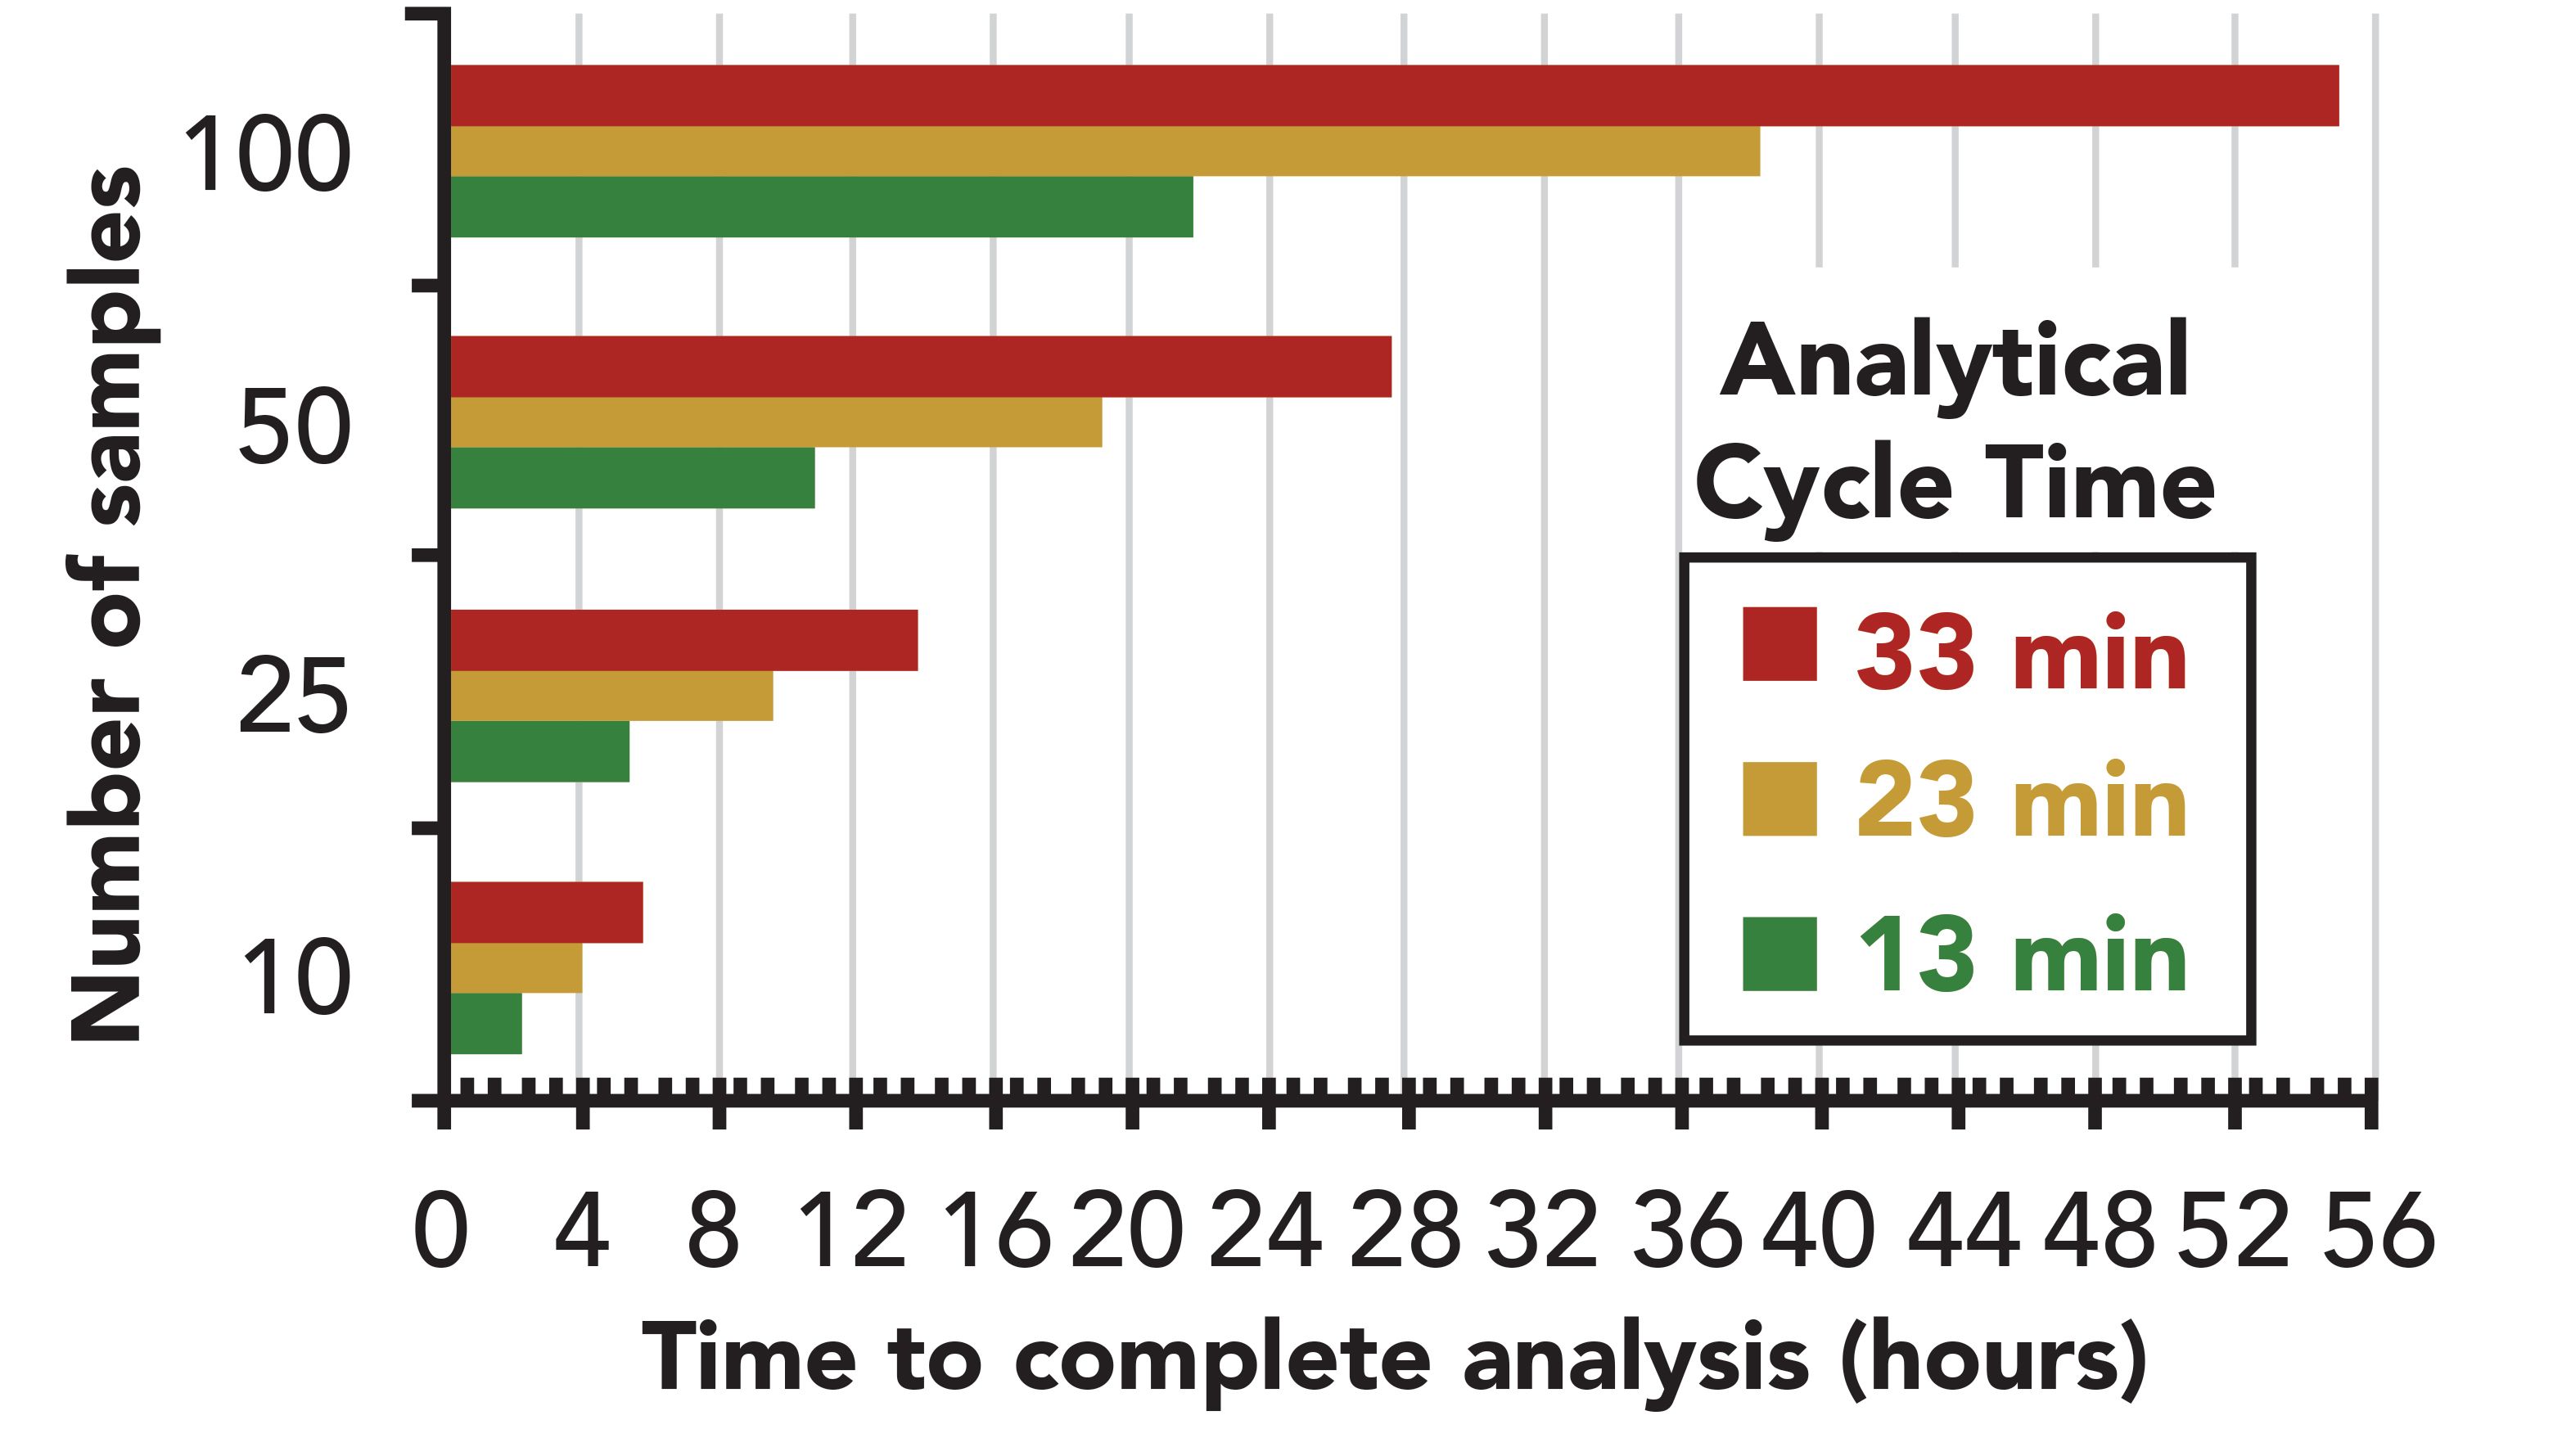
In addition to high sample-throughput, other benefits of using LPGC with a 13 min analytical cycle time (10 min chromatogram, plus 3 min oven cool down) include faster analytical turnaround time for individual samples, reduced He gas usage per sample, reduced degradation of analytes as final extracts wait for injection on the autosampler tray, less wasted client and staff time (thus money!) waiting for results, and improved analytical performance and robustness.
Flow Rate
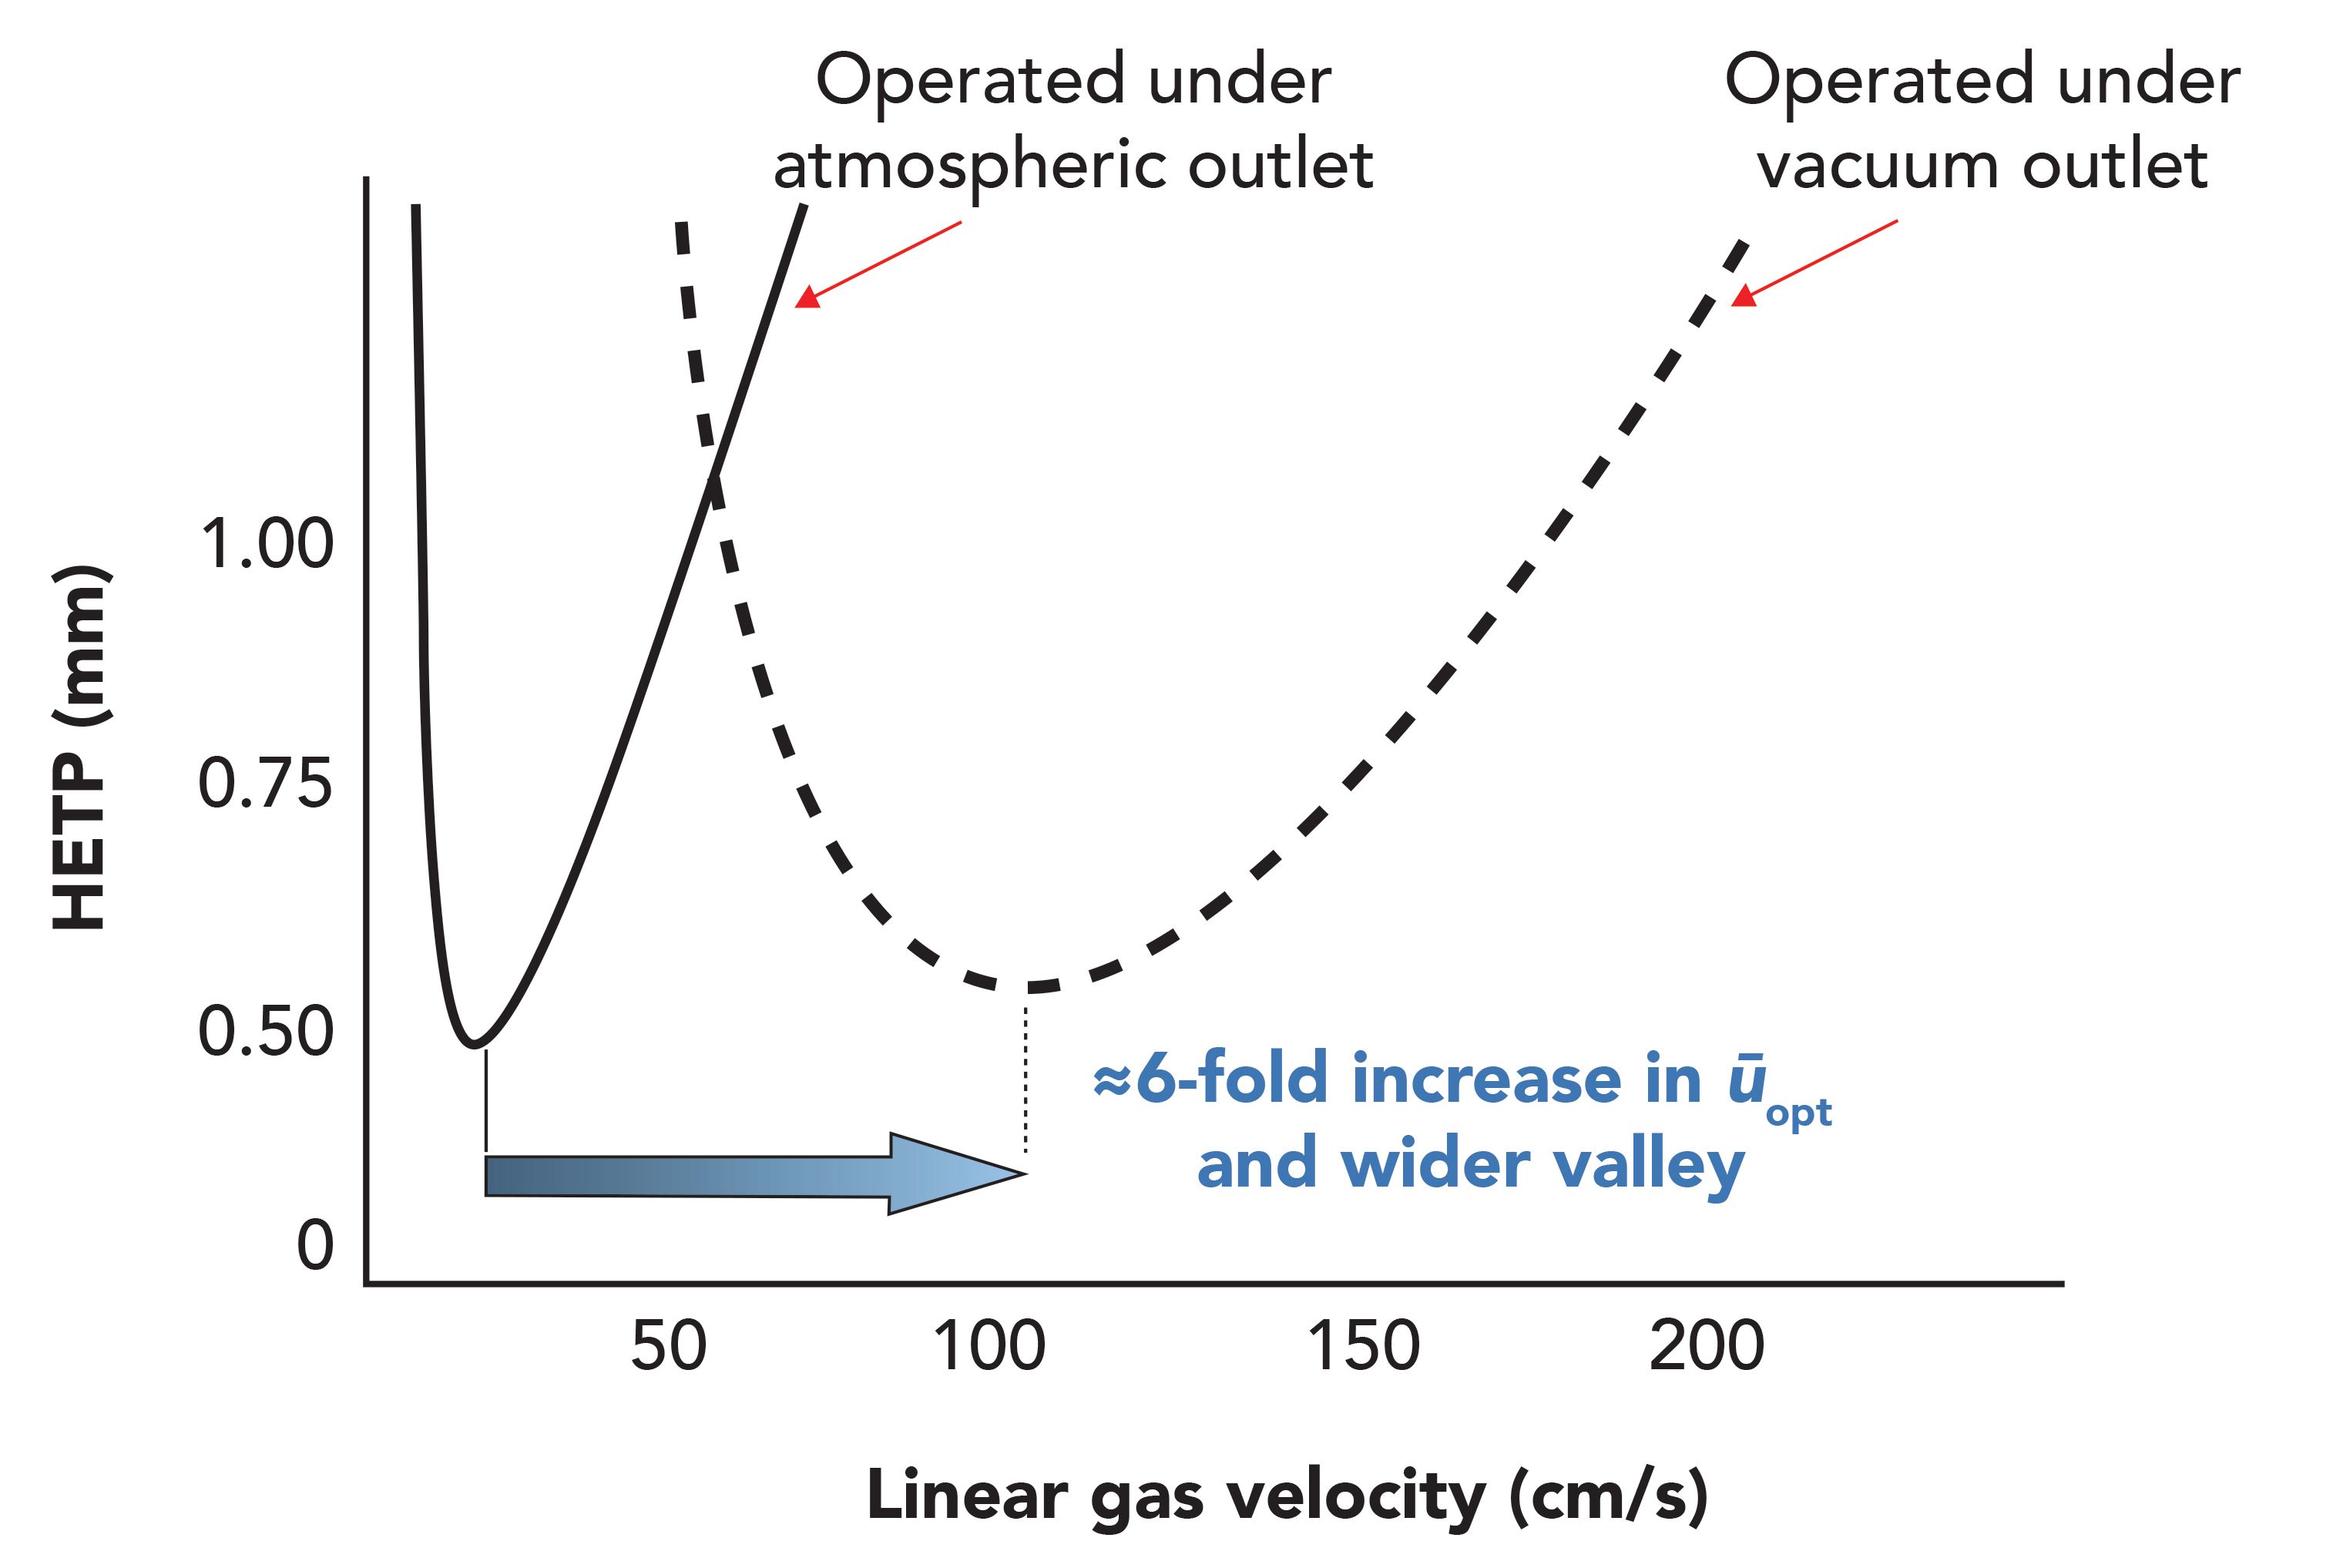
In traditional GC–MS using a 30 m, 0.25-mm i.d. analytical column, the optimum average helium carrier gas linear velocity (ūopt) is ≈40 cm/s (≈1.2 mL/min flow rate). As shown in Figure 5, for a 0.53-mm i.d. capillary, ūopt increases from ≈18 cm/s under pressurized conditions to ≈100 cm/s in vacuum GC (16). Independent of the detector and analyte, this constant flow rate generally leads to the tallest and narrowest peaks (≈2 s), with maximal peak capacity in vacuum GC using 0.53-mm i.d. analytical columns.
Figure 5: van Deemter plots of 0.53-mm i.d. columns under pressurized and vacuum conditions. Note that the van Deemter plot also flattens to allow wider range of applicable linear gas velocity (ū) in LPGC.
LPGC using helium carrier gas is akin to standard GC using hydrogen as the carrier gas to provide a similar improvement in speed and separations (44,48). In fact, helium under vacuum conditions has properties similar to those of hydrogen carrier gas operated normally, which is how LPGC also works, but H2 is reactive and permeates metal surfaces, posing safety and performance risks in GC–MS. Nitrogen as a carrier gas in LPGC also works as well or better than helium in terms of fast chromatography, but N2 completely desensitizes MS performance using electron ionization, thus it is a poor choice in LPGC–MS. Use of hydrogen in LPGC–MS has yet to be evaluated to our knowledge.
Although the theory of GC is well-established after 70 years of usage, the nuances of optimal conditions and trade-offs involved in analyst choices remains complex (44,49–50). Frankly, the “gurus” of GC have focused much attention on GC×GC and microbore-GC rather than LPGC, and its equally rich theory involving two capillaries of different dimensions have not been thoroughly reported. This article is partially intended to stimulate further study by others, including of theory, for the benefit of the analytical GC–MS community.
Increased Sensitivity
Chromatographic peaks are taller in LPGC, because shorter analysis time leads to less band broadening and tailing, especially for analytes that normally are eluted at the end of the chromatogram. A 2.5-fold enhancement in signal is common in LPGC–MS compared to conventional GC–MS (2). Greater sample capacity in LPGC also allows more equivalent sample to be injected (as we discuss later), which leads to lower detection limits if matrix interferants are not the limiting source of noise. APs also serve to reduce analyte tailing and losses at active sites throughout the GC–MS system (41,42).
Peak Width and MS Data Acquisition Rate
Higher flow rate is one aspect in LPGC that leads to shorter analysis time, and peaks are taller and narrower due to less time for the analyte to diffuse. However, unlike fast GC–MS with micro-bore columns (20,23), the peaks are not so narrow that typical MS detectors cannot acquire them. The ≈2 s peaks in LPGC allow a data acquisition rate as slow as 2.5 Hz to still attain at least five points for defining chromatographic peaks. This is one major reason why LPGC–MS is feasible with common MS detectors, whereas micro-bore GC–MS tends to fail (23).
Increased Sample Capacity and Robustness
Another major reason that fast GC–MS can fail, even when using 0.25 mm i.d. columns, is that sample capacity (maximum amount of equivalent sample that does not saturate the column) is proportional to the third power of capillary i.d. (23,44). Thus, with all else being equal, a 0.53 mm i.d. capillary can accept 44-fold more injected sample equivalent than 0.15 mm i.d., 25.5 times more than 0.18 mm i.d., 9.5 times more than 0.25 mm i.d., and 4.5 times more than 0.32 mm i.d. This is a major benefit of mega-bore columns (43,44), which is why 0.53 mm i.d. was the standard column dimension at the dawn of capillary GC, to handle the high equivalent sample amounts needed to yield reasonable detection limits using less sensitive detectors.
The 30 m, 0.25 mm i.d, 0.25 µm film stationary phase became the standard column in GC–MS as a result of the flow rate, sensitivity, and selectivity limitations of the MS detectors at the time. Selectivity and sensitivity have improved tremendously since that time through use of MS/MS, high resolution (HR) MS, and better deconvolution software (22). Thus, the factors that led to the standard 30 m, 0.25 mm i.d. column configuration in GC–MS do not necessarily apply anymore. Now that MS detectors and software can better isolate analytes from other co-eluted chemicals, the separation power of chromatography has become less important, and greater speed and robustness in analyses can be achieved using LPGC.
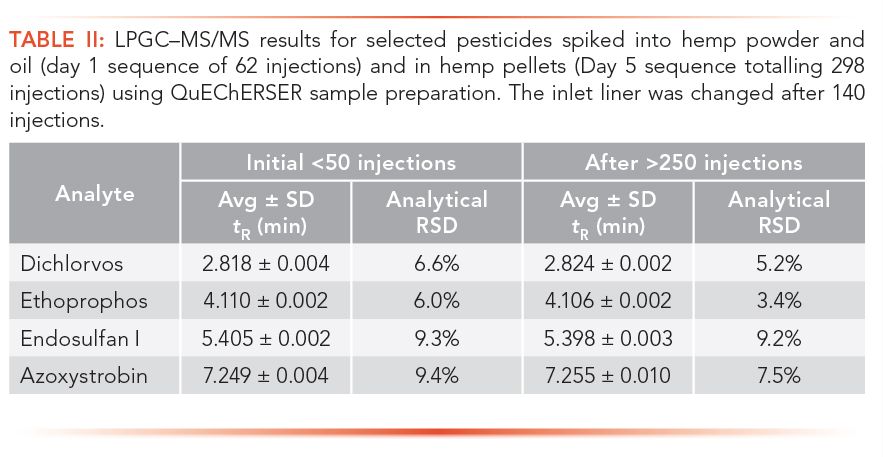
Table II provides a demonstration of robustness in LPGC–MS/MS for a very difficult analysis of pesticide residues in hemp products after QuEChERSER sample preparation (30,45,46). Nearly 300 injections were made altogether of extracts of hemp powders, oils, fresh and dried plants, and dried flowers over the course of 5 d. The ≈50 injections each of dried plants and flowers overwhelmed the system, leading to poor quantitative results for those matrices, but as the table shows, the consistency of the tR and analytical precision for the selected pesticides in the pellets on Day 5 (n = 30) was as good as it was for powders and oil (n = 30) on Day 1 without column or MS maintenance. Only the inlet liner was changed after 140 injections of powders, oils, and fresh and dried plants.
Even if the full sample capacity of a mega-bore column is not needed for each injection, the added sample capacity leads to greater robustness, less down time for maintenance, and fewer column purchases. For example, Maštovská and colleagues showed the greater long-term robustness of LPGC–MS using a 0.53 mm i.d. analytical column (4) compared with a 0.25 mm i.d. column (35). A 10 m, 0.32 mm i.d. analytical column with 0.5-1 µm film thickness may serve as a reasonable balance of separation efficiency vs. sample capacity in LPGC, but this option has not been thoroughly evaluated (37,38).
While still maintaining 10 ng/g limits of quantification since 2001, the USDA laboratory has reduced its equivalent injected sample in LPGC–MS from 10 mg (4) to 2.5 mg (33) to 1 mg (34), and to as little as 0.2 mg today (24–30) after a series of instrument upgrades. A previous drawback of LPGC–MS requiring periodic trimming of the guard/restrictor or analytical column has been obviated. Again, the ITL, APs, and QuEChERSER help greatly in this outcome.
Increased Standard Splitless Injection Volume
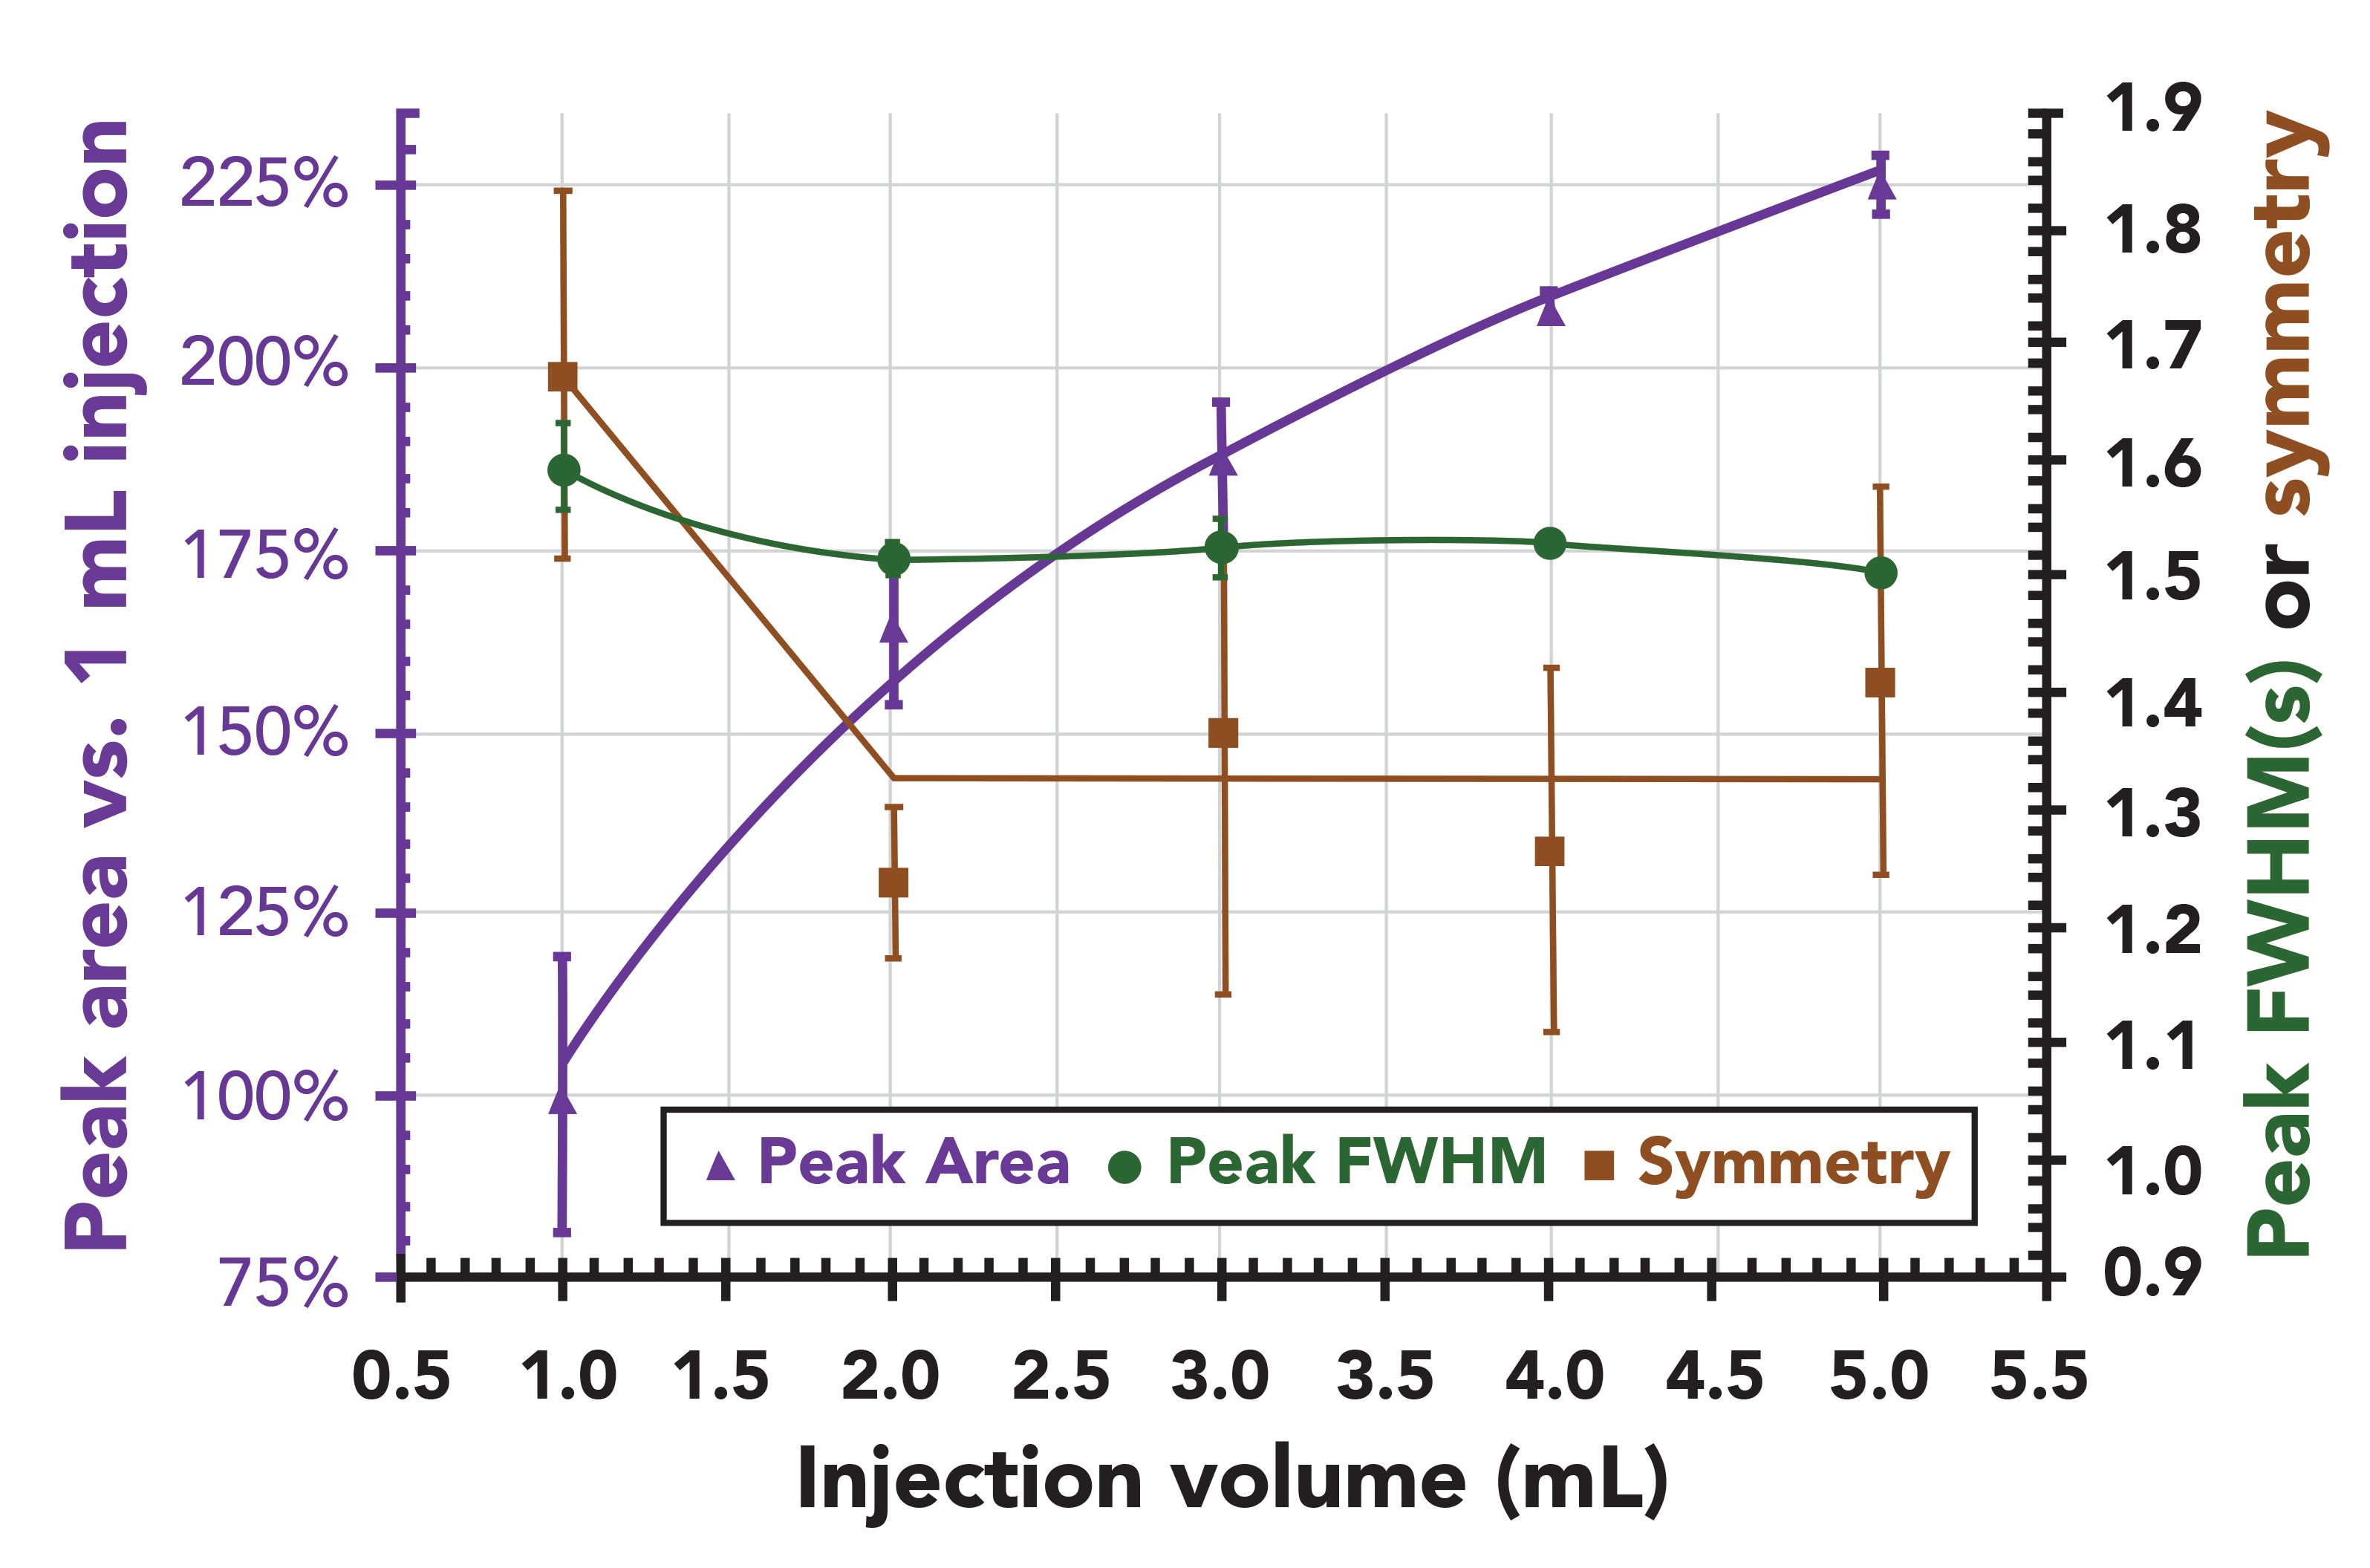
The beauty of the advances in MS technology when combined with the high sample capacity of LPGC (with 0.53 mm i.d. columns) is that extracts can be more dilute to improve sample preparation (extraction and cleanup efficiencies) while injecting large volumes to meet detection limit needs. Moreover, a standard hot split or splitless injector can be used for this purpose rather than a programmable temperature vaporizer. Maštovská and associates showed this for 5 µL injections of final extracts in toluene (4), and Figure 6 gives an updated example showing 1-5 µL injections of acetonitrile extracts in LPGC–MS/MS. Although 100% injection efficiency was not achieved due to the high vapor expansion volume of acetonitrile in the limited liner volume, the signal increased with excellent consistency up to 5 µL. Ultimately, 4 µL injection was chosen with a 40 psig pressure pulse and 280 °C inlet temperature using a low-pressure drop splitless liner containing glass wool (30). Even though the initial GC oven temperature was 75 °C, the acetonitrile did not condense on the stationary phase to deform early eluted analyte peaks (for example, dichlorvos) because the solvent remains gaseous under vacuum conditions in the analytical column. This is another major benefit in LPGC that few chromatographers recognize, yet it can be a game changer in practice.
Figure 6: Spitless injection of 1-5 µL of 0.5 ng of indoxacarb in acetonitrile in LPGC–MS/MS using a standard split/splitless injector at 280 °C and liner containing glass wool. No peak broadening nor tailing occurred. Even though the initial GC oven temperature was 75 °C, the acetonitrile did not condense on the stationary phase to deform early-eluting analyte peaks because the solvent remains gaseous under vacuum conditions in the analytical column.
Reduced Column Temperature
Although most who use LPGC–MS thus far have employed shorter columns with fast temperature programming to maximize speed (36), LPGC provides the ability to achieve equivalently fast or faster separations at lower oven temperatures. Because compounds are eluted at lower temperatures in LPGC than in standard GC, conditions can be devised to minimize loss of thermally labile compounds that otherwise pose difficulties in GC analysis. Depending on stationary phase, film thickness, and column condition, low elution temperatures can provide a higher signal/noise ratio due to lower column bleed.
Additionally, the initial GC oven temperature can often be increased in LPGC as a result of the thicker stationary phase film, which shortens the chromatographic run and oven cool down time, even if the final oven temperature is decreased. The injected solvent does not condense into a liquid after injection, nor does it linger in the column under vacuum conditions. Therefore, MS data collection delays are shorter to allow earlier elution of the most volatile analytes than in standard GC–MS. This also permits a more gradual oven programming ramp rate to achieve greater peak capacity between the first and last analytes to be eluted. Solvent delay times of >3 min are usual in standard GC–MS, especially when using large-volume injection, but ≤2 min is the norm in LPGC–MS.
Ghost Peaks
Just as analyses tend to be faster in LPGC–MS than in standard GC–MS, ghost peaks will also be less problematic in LPGC–MS. Although the analytical column under vacuum cannot be backflushed in the same way as in standard GC options (51), the guard (or restrictor) and the inlet can undergo backflushing soon after injection in the same way as in standard GC–MS. The vacuum conditions tend to sweep the analytical column clean anyway, and although ghost peaks can still occur depending on samples injected and conditions used, keeping the oven at 150–250 °C between sequences with column carrier gas flow of 1 mL/min in gas saver mode maintains a clean system. Lingering matrix components and APs will be eluted and be pumped away in short order. An ion source temperature of 320 °C also helps. As long as system suitability, air and water checks, and autotunes continue to pass, the APs continue to coat active sites in the system upon each injection to obtain good results, even if the ion source is considered dirty for standard GC–MS.
Operation of LPGC–MS Column Connection
The most critical factor to implement LPGC is to ensure a steadfast sealing connection between the guard and the restrictor and analytical columns (see Figure 1). Figure 2 shows how the vacuum at that union for the 0.53 mm i.d. column is not much higher than it is at the MS transfer line nut, so coupling of the columns using a press-fit connector does not work in that case. Besides, capillaries with ≤0.32 mm i.d. have <0.5 mm o.d. to fit within 0.53 mm i.d. analytical columns. Depending on GC conditions (see Table I and Figure 2), a ≥10 m, 0.25 mm i.d. column could be used as the guard or restrictor. Press-fit connectors do not allow for one column to be inserted into the other for a zero-dead volume connection; therefore, unions using nuts should be used in this situation. Vespel or polyimide ferrules could be used, but these must be retightened after heating and cooling, which is a very difficult task that risks column breakage after it has been installed. Thus, unions with metal ferrules are needed in this application, but if the connector is too bulky or heavy, great care must be taken during handling to avoid breaking the capillaries.
A “micro-union” (52,53) provides an excellent solution, using a small, light-weight design and clever hand-tightening installation procedure with miniature metal ferrules to make a strong and permanent seal. The micro-union not only minimizes column breakage during shipping and handling, but its low thermal mass also reduces formation of cold spots during GC oven programming.
Before heating the column, just as in any GC–MS system, a leak detector should be used to check all fittings for leaks at high carrier gas flow. Similarly, accuracy of instrument flow control should be determined by measuring flow rates at the split vent and septum purge lines at different setpoints. Once severe leaks have been eliminated, the MS detector can be used to check air or water, serving as a more sensitive leak detector. When troubleshooting, the chemical propellant of a dust cleaner spray can be monitored by the MS system to isolate the source of a possible leak.
Optimal Flow Rate
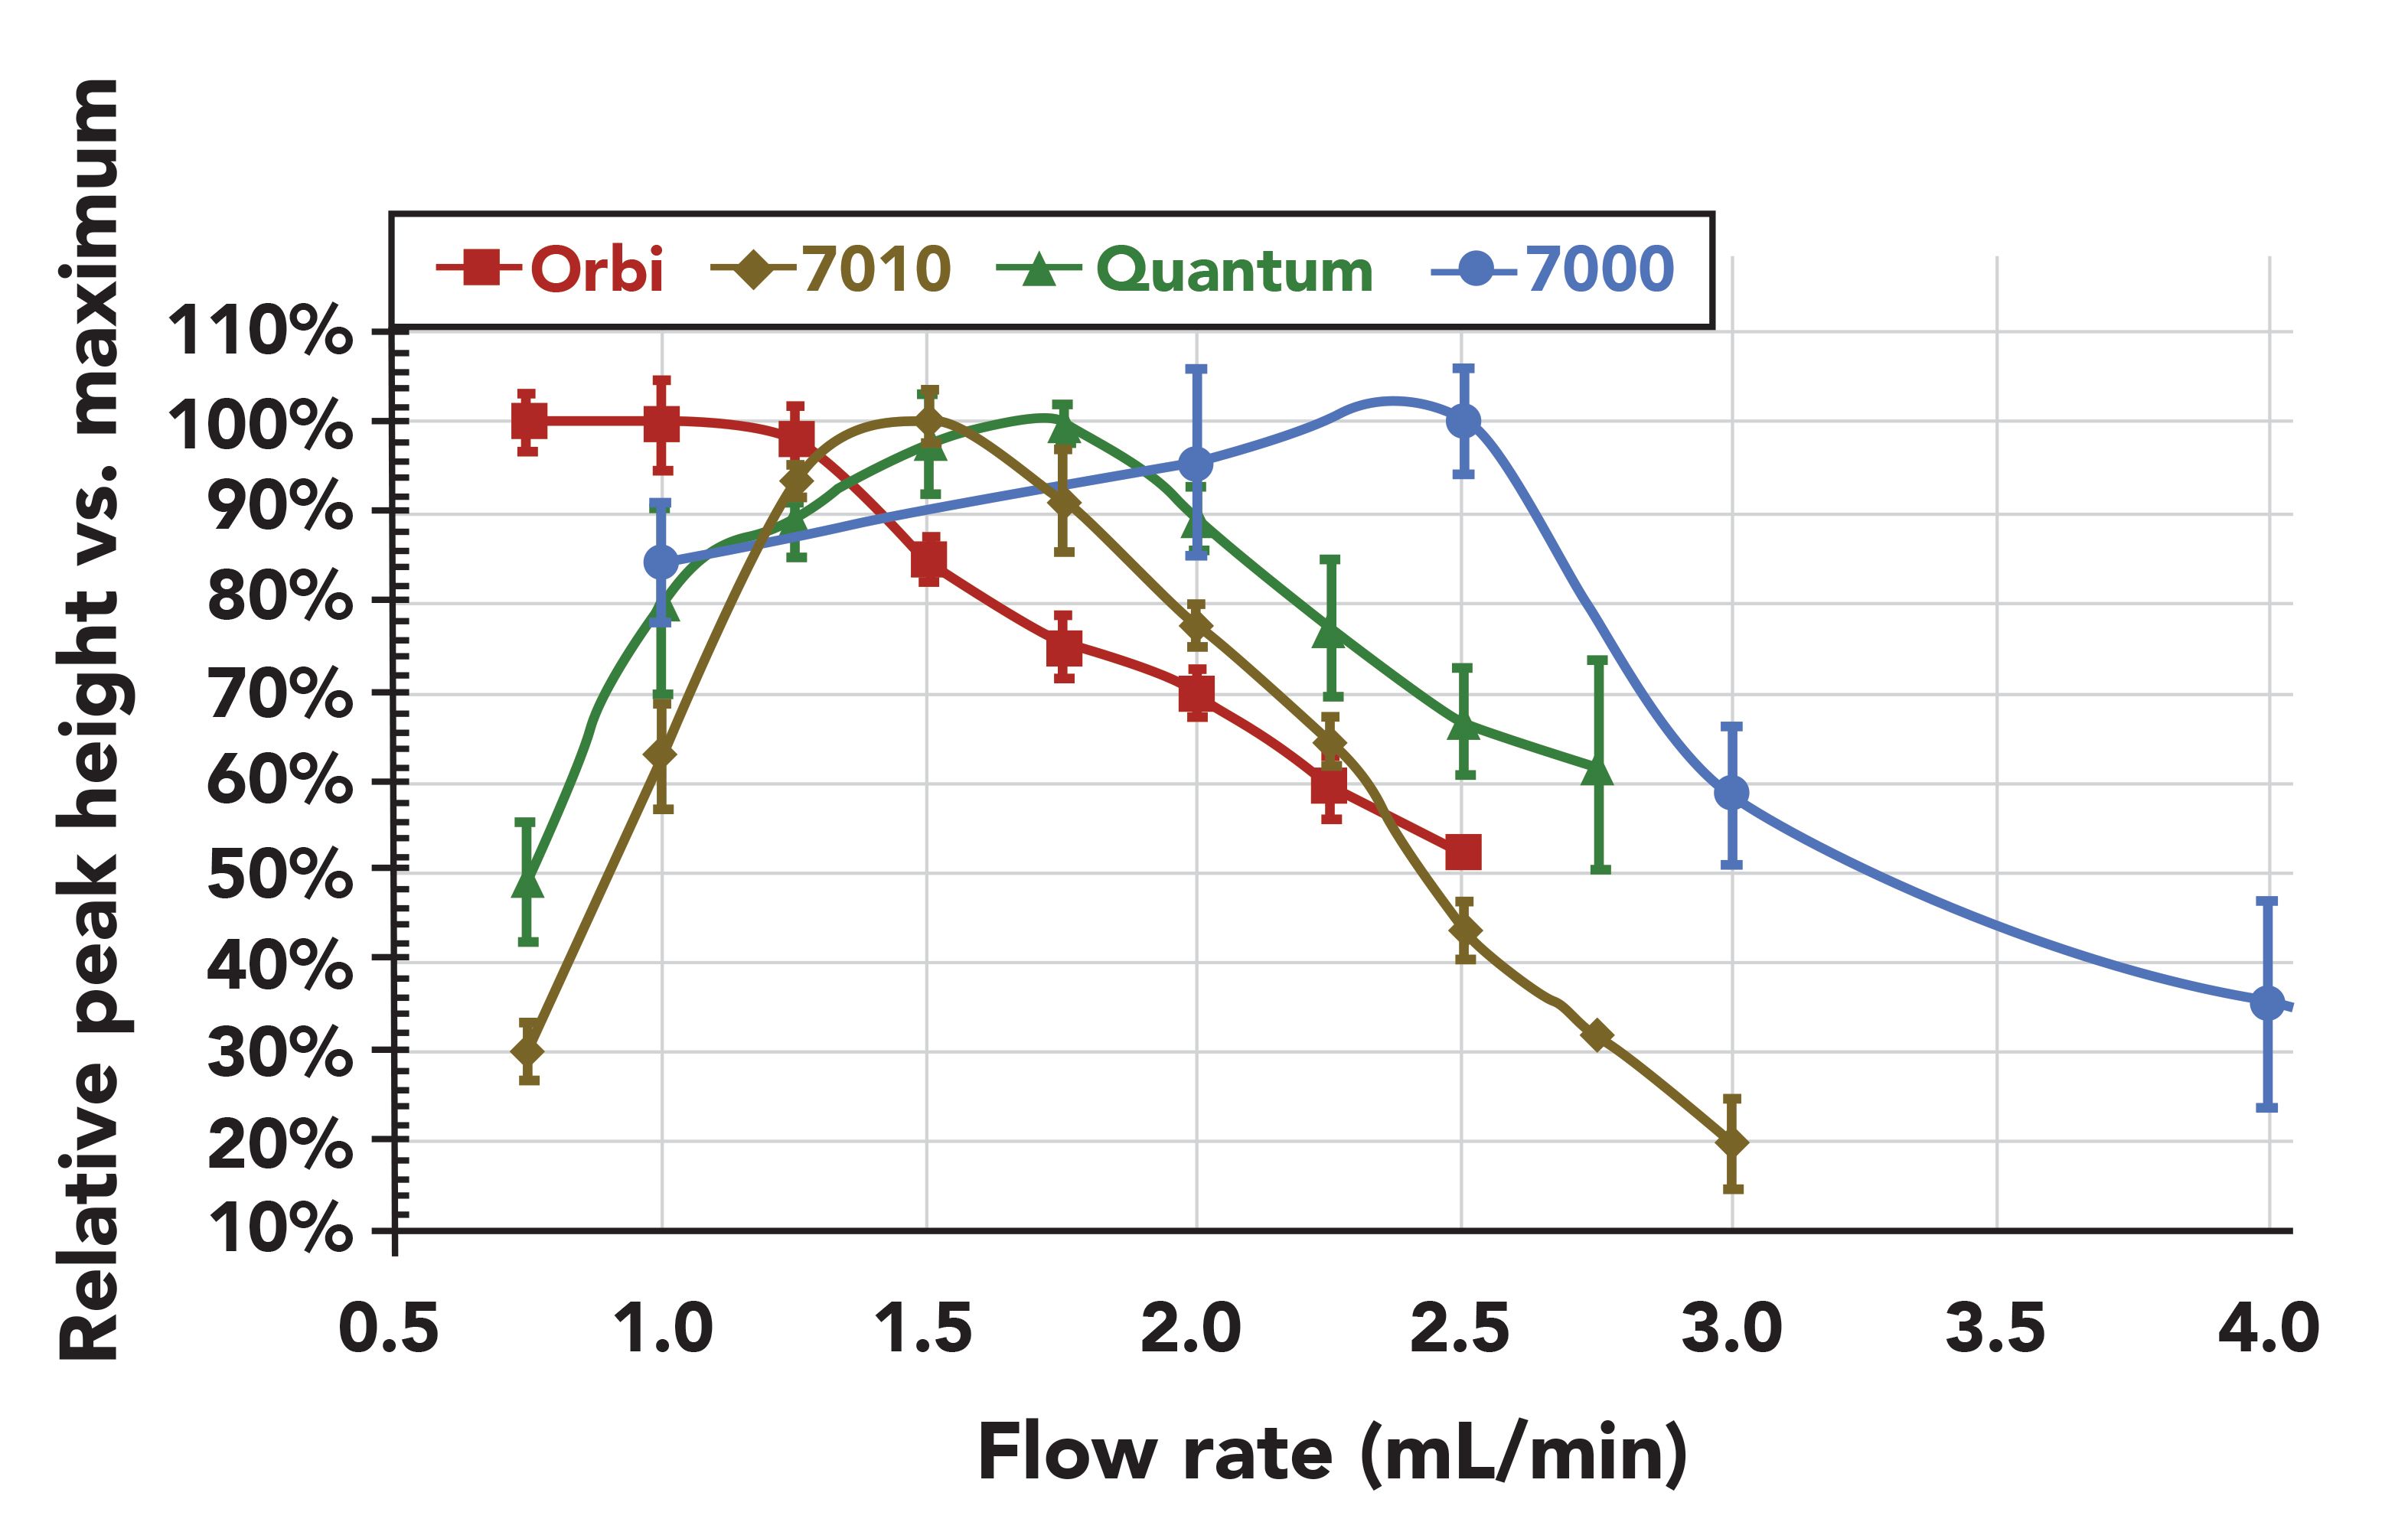
Although ūopt in LPGC may be ≈100 cm/s (>2.5 mL/min) with a 0.53 mm i.d. column, sensitivity of the MS detector cannot be disassociated from the chromatography in GC–MS analysis. Thus, it is a good idea when using LPGC–MS for the first time with an untested instrument model to directly measure peak intensities of analytes vs. constant flow rate from 0.75–3 mL/min, as shown in Figure 7 for different instruments. Some instruments are tailored to be most sensitive at <1.5 mL/min, for example, but they can still yield precise results at higher flow rates. As shown in Figure 5, LPGC gives a broadly applicable flow rate range, thus the chromatography is not compromised much if the exactūopt is not employed in the final method.
Figure 7: Comparison of optimal flow rates using the column configuration shown in Figure I in LPGC–MS of atrazine with 4 different commercial instruments (Thermo Orbitrap and Quantum, and Agilent 7010 and 7000 – studies of Leco Pegasus and Agilent 5972 mirror the 7000 results). Although the optimal van Deemter flow rate for the GC separation is ≈2.5 mL/min, lower flow rate may be optimal for increased sensitivity for certain MS detectors or ion source designs.
For accurate electronic flow control in LPGC with a 0.53 mm i.d. analytical column, simply enter the guard or restrictor column dimensions with vacuum outlet conditions as the column configuration in the instrument software. The same approach can be used for narrower analytical columns in LPGC provided that the capillary dimensions in Table I and Figure 2 are followed. Otherwise, newer instruments often allow connected columns of different dimensions to be entered into the configuration for even more accurate flow control, or a virtual column dimension can be calculated and entered (33). In the worst case, as long as settings are consistent, the analysis will be consistent even if the actual flows do not exactly match the set flows.
The LPGC system must be leak-free just as in any GC–MS setup for optimal performance. When initially installing LPGC–MS, the MS air/water check and tuning should be done at 1 mL/min and ≈200 oC oven temperature, but once flow rate and other parameters have been optimized, the MS tuning should be done at the final method conditions, including transfer line and ion source temperatures, Again, the same parameters should be evaluated in LPGC–MS as in GC–MS to optimize any method. LPGC–MS is rugged as well as robust, and as long as the data quality objectives for the application are met, then those method parameters may be used even if they are not optimal for “best” performance.
Fast Oven Programming
As already mentioned, faster GC–MS also usually entails faster oven temperature ramps. For the most consistent retention times, the “real” (measured) temperature of the oven must closely follow the “set” temperature of the oven controls. Watch the setpoint temperature warning light during initial analyses to ensure the oven keeps pace with the program used. Use of 220 V oven units typically allow up to 50 °C/min ramp rates, and somewhat lower rates will be needed for 110 V units. Chromatography may be better at 25 °C/min in any case if lower elution temperature is sought (36). Physically reducing the oven size with fitted padding (54,55) also helps maintain oven control and reduce oven cool-down time (and analytical cycle time) to increase sample throughput.
Other Details
The reader should be cautioned that columns with 1 µm stationary phase films take a longer time to be conditioned than 0.25 µm film columns. This can be observed initially as retention times become slightly shorter in each subsequent analysis using a newly installed LPGC column set, but the stationary phase will stabilize, leading to exceptional retention time consistency after the column has been thoroughly conditioned (47).
Another note of caution is that users who may initially have concerns with LPGC in a new application should not switch back to standard GC until they have evaluated different oven programming, flow rate, and injection conditions than those commonly used in standard GC. Different phases and dimensions in LPGC may also be considered from Table I if the “standard” setup in Figure 1 is not acceptable. Unlike conventional capillary GC, which has a head start of >40 years of marketing and application notes from dozens of vendors, LPGC may require good, old-fashioned method development.
Overcoming Co-elutions
Essentially, the main drawback of LPGC–MS is slightly reduced chromatographic peak capacity (see Figure 3). Use of 15 m, 0.53 mm i.d. columns deliver ≈20,000 theoretical plates (20), but co-elutions still occur when analyzing complex mixtures. In such cases, co-elutions also occur for standard GC–MS (see Figure 3), and Sapozhnikova and Lehotay (2) showed in side by side comparisons that LPGC separations are only slightly worse. LPGC–MS is not well-suited for analysis of volatiles, but volatiles can already be analyzed rapidly using standard GC–MS. If necessary, film thicknesses of up to 5 μm can be used to increase the number of theoretical plates, and column bleed would be reasonable at lower temperature. As already mentioned, use of a longer 0.53 mm i.d. or narrower analytical columns may also help.
Given the selectivity of MS, the more common situation in practice is that standard GC–MS columns waste time by providing more separation power than needed. MS/MS, high-resolution MS, and deconvolution software are becoming more common in practice (3). In 2002, Korytár and associates (56) found clear benefits to speed GC–MS analyses, which remains even more true today using more advanced technology (20,22).
Interestingly, chemical matrix interferences are not typically the limiting factor in (LP)GC–MS, but other analytes that share the same fragment or MS/MS ion transitions tend to limit speed of separations. All existing methods have costs and make trade-offs for some analytes over others. In a fair comparison, overall benefits and costs of both standard GC–MS and LPGC–MS must be considered, and loss of one analyte may be worth the gain of another, or an assessment of time and money saved may lead to an analyte being dropped.
In the case of environmental and pesticide applications, for example, separation conditions are devised based on a test mix, which is also used for method validation, but real samples rarely if ever contain as many analytes as are in the test mix. In some cases, such as legacy organochlorines, the isobaric analytes are no longer found in some sample types at all, and they are only included in the test mix because they have been a priority decades ago. Provided that each analyte can be distinguished from each other, individually or together, then the need of the application can still be met. Even if such analyte pairs are fully co-eluted in very fast methods, they may be integrated and reported together without ramifications, or reanalysis of the few positives for just those analytes still saves time and cost overall. In regulatory analyses, confirmation of violative results using orthogonally selective methods are needed anyway, so this is no different than current practice.
The authors assert that baseline resolution of isobaric analytes may not be truly needed in applications as often as required by clients or claimed by analysts. When underlying reasons are questioned with respect to fitness-for-purpose considerations in a fresh cost/benefit analysis, the extra time and effort may not be worth the full separation of the analytes. The purpose of any analysis is to meet needs, not to achieve baseline resolution of certain analytes. A direct comparison in data quality and outcomes between current and alternative practices need to be made, not just following intuitive beliefs, or arbitrary decisions. Analytical chemists should be wary of perfectionism rather than focusing on the needs for an analysis. For example, p,p’-DDD and o,p’-DDT may be partially co-eluted in both standard GC–MS or LPGC–MS (2), but the o,p’-DDD and p,p’-DDT congeners can still be used to meet analytical needs. Use of fast screening methods and re-analysis of the few co-eluted positives by a more time-consuming method may also be more efficient overall.
Independent of chromatography, summation integration can yield acceptable accuracy for each analyte even if they are partially co-eluted (47). The concentration ratios between such analytes also tend to remain fixed depending on their source. Furthermore, Hellinghausen and colleagues (57,58) have demonstrated that a power law approach, among other mathematical tools, can individually integrate partially co-eluted peaks. There is more than one way to bake a cake, and sometimes it is possible to have your cake and eat it, too.
Conclusion
Unfortunately, many laboratories simply use the same column and configuration for their applications that was installed with the instrument. Some GC–MS operators follow a protocol (or worse, they don’t follow it) without knowing the purpose of each step or better alternatives. In particular, laboratories in the United States involved in environmental applications tend to use methods developed in the 1980s, as if they are set in stone and new methods cannot be validated to justifiably replace them.
As we begin another decade, it’s time to reconsider workflows, techniques, and technologies to improve analytical quality and efficiency. Often, reassessments in light of new developments lead to major advancements. However, technology is not always the limitation; in some cases, more vision, knowledge, care, and effort are needed to better implement an old idea.
LPGC has been known to be advantageous for nearly 60 years, and for the past 20 years it has been demonstrated that LPGC can be installed in any commercial GC–MS instrument without modification. Except for the analysis of volatiles that are already separated quickly, LPGC–MS is a faster and often better alternative to standard GC–MS. As shown in Figures 3 and 4, LPGC–MS saves time with little loss of separation efficiency vs. standard GC–MS, plus it provides greater sensitivity, and more robustness (Table II), accommodates larger hot splitless injection volumes (Figure 6), and extends scope to cover more nonvolatiles even at lower oven temperature.
LPGC–MS has a long history with some notable successes, but few in the field have taken it seriously. Emphasis on first chromatography, and then analytical chemistry, has led, in part, to a proliferation of publications for niche applications using GCxGC or micro-GC, for example, while most GC–MS applications still use the type of columns introduced in the 1980s. And yet, all analytical chemists prefer faster results of high quality! Now is always a good time for analytical chemists to re-evaluate their priorities, needs, and choices. If commercial vendors made and marketed LPGC products in the same way that they have done for conventional GC products, then GC–MS analysts would have more ease and options to implement faster methods. Even expert chromatographers prefer to buy a preconnected column set for a fair price rather than make the connections themselves. There is no time to waste! LPGC–MS is a proven solution for fast, sensitive, and robust GC–MS analysis.
Acknowledgment
We thank Aviv Amirav, Hans-Joachim Hübschmann, Nick Snow, and David Bell for commenting on draft versions of this manuscript. The USDA laboratory thanks ThermoFisher Scientific for loan of the GC-Orbitrap instrument and training.
Disclaimer
Mention of brand or firm name does not constitute an endorsement by the U.S. Department of Agriculture above others of a similar nature not mentioned.USDA is an equal opportunity provider and employer.
References
- J.C. Giddings, Anal. Chem. 34(3), 314–319 (1962).
- Y. Sapozhnikova and S.J. Lehotay, Anal. Chim. Acta 899, 13–22 (2015).
- S.J. Lehotay and Y. Chen, Anal. Bioanal. Chem. 410, 5331–5351 (2018).
- K. Maštovská, S.J. Lehotay, and J. Hajšlova, J. Chromatogr. A 926, 291–308 (2001).
- C.A. Cramers, G.J. Scherpenzeel, and P.A. Leclercq, J. Chromatogr. 203, 207–216 (1981).
- P.A. Leclercq and C.A. Cramers, J. High Res. Chromatogr. 8, 764–771 (1985).
- C.A. Cramers and P.A. Leclercq, Crit. Rev. Anal. Chem. 20, 117–147 (1988).
- P.A. Leclercq, J. High Res. Chromatogr. 15, 531–534 (1992).
- P.A. Leclercq and C.A. Cramers, Mass Spectrom. Rev. 17, 37–49 (1998).
- C.A. Cramers and P.A. Leclercq, J. Chromatogr. A 842, 3–13 (1999).
- M.L. Trehy, R.A. Yost, and J.J. McCreary, Anal. Chem.56, 1281–1285 (1984).
- R.A. Yost, D.D. Fetterolf, J.R. Hass, D.J. Harvan, A.F. Weston, P.A. Skotnicki, and N.M. Simon, Anal. Chem. 56, 2223–2228 (1984).
- J.V. Johnson, R.A. Yost, and K.F. Faull, Anal. Chem.56, 1655–1661 (1984).
- M.L. Trehy, R.A. Yost, and J.A. Dorsey, Anal. Chem. 58, 14–19 (1986).
- M.E. Hail and R.A. Yost, Anal. Chem. 61, 2402–2410 (1989).
- J. de Zeeuw, J. Peene, H.-G. Janssen, and X. Lou, J. High Res. Chromatogr. 23, 677–680 (2000).
- J. De Zeeuw, Gas chromatographic device. U.S. Patent #6,301,952 (2001).
- E. Hakme, A. Lozano, S. Uclés, and A. Fernández-Alba, Anal. Bioanal. Chem. 410, 5491–5506 (2018).
- Y. Pico, A.H. Alfarhan, and D. Barcelo, Trends Anal. Chem. 122, 115720 (2020).
- M. Zoccali, P.Q. Tranchida, and L. Mondello, Trends Anal. Chem. 118, 444–452 (2019).
- J. Hinshaw, LCGC North Am. 35, 810–815 (2017).
- B. Gruber, F. David, and P. Sandra, Trends Anal. Chem. 124, 115475 (2020).
- K. Maštovská and S.J. Lehotay, J. Chromatogr. A 1000, 153–180 (2003).
- S.J. Lehotay, L. Han, and Y. Sapozhnikova, Anal. Bioanal. Chem. 410, 5465–5479 (2018).
- S.J. Lehotay, L. Han, and Y. Sapozhnikova, Chromatographia 79, 1113–1130 (2016).
- L. Han, S.J. Lehotay, and Y. Sapozhnikova, J. Agric. Food Chem. 66, 4986–4996 (2018).
- L. Han, Y. Sapozhnikova, and S.J. Lehotay, Food Control 66, 270–282 (2016).
- L. Han and Y. Sapozhnikova, Food Chem. 319, 126592 (2020).
- Y. Sapozhnikova, J. Chromatogr. A 1572, 203–211 (2018).
- S.J. Lehotay, N. Michlig, and A.R. Lightfield, J. Agric. Food Chem. 68, 1468–1479 (2020).
- J. de Zeeuw, S. Reese, J. Cochran, S. Grossman, T. Kane, and C. English, J. Sep. Sci. 32, 1849–1857 (2009).
- Z. Khan, R. Girame, S.C. Utture, R.K. Ghosh, and K. Banerjee, J. Chromatogr. A 14148, 228–232 (2015).
- U. Koesukwiwat, S.J. Lehotay, S. Miao, and N. Leepipatpiboon, J. Chromatogr. A 1217, 6692–6703 (2010).
- Y. Sapozhnikova and S.J. Lehotay, Anal. Chim. Acta 758, 80–92 (2013).
- K. Maštovská, J. Hajšlova, and S.J. Lehotay, J. Chromatogr. A 1054, 335–349 (2004).
- A. Fialkov, S.J. Lehotay, and A. Amirav, J. Chromatogr. A 1612, 460691 (2020).
- S.C. Cunha, J.O. Fernandes, A. Alves, and M.B.P.P. Oliveira, J. Chromatogr. A 1216, 119–126 (2009).
- F.M. Sousa, R.J.R. Ferreira, S.V.M. de Sá, S.C.S. Cunha, and J. de Oliveira Fernandes, Australian J. Grape Wine Res. 26, 90–100 (2020).
- Agilent FlowCalc: (www.agilent.com/en/support/gas-chromatography/gccalculators).
- Restek EZGC Flow Calculator: (www.restek.com/ezgc-mtfc).
- M. Anastassiades, K. Maštovská, and S.J. Lehotay, J. Chromatogr. A1015, 163–184 (2003).
- K. Maštovská, S.J. Lehotay, and M. Anastassiades, Anal. Chem. 77, 8129–8137 (2005).
- A. Amirav, N. Tzanani, S.B. Wainhaus, and S. Dagan, Europ. Mass. Spectrom. 4, 7–13 (1998).
- M.S. Klee and L.M. Blumberg, J. Chromatogr. Sci. 40, 234–247 (2002).
- S.H. Monteiro, S.J. Lehotay, Y. Sapozhnikova, E. Ninga, and A.R. Lightfield, J. Agric. Food Chem. (in press).
- E. Ninga, Y. Sapozhnikova, S.J. Lehotay, A.R. Lightfield, and S.H. Monteiro, J. Agric. Food Chem. (in press).
- S.J. Lehotay, LCGC North Am.35, 391–402 (2017).
- J. de Zeeuw, Am. Lab. 50, 18–20 (2018).
- L.M. Blumberg, J. Chromatogr. A 1536, 27–38 (2018).
- S.P. McCann, H. Rana, B.A. Handzo, and N.H. Snow, LCGC North Am. 38, 152–158 (2020).
- K. Mastovska and P. L. Wylie, J. Chromatogr. A 1265, 155–164 (2012).
- www.restek.com/catalog/view/47081/23882
- www.sge.com/products/gc-supplies2/column-connectors
- www.restek.com/catalog/view/52293
- www.agilent.com/store/en_US/Prod-G2646-60500/G2646-60500
- P. Korytár, H.-G. Janssen, E. Matisová, and U.A.T. Brinkman, Trends Anal. Chem. 21, 558–572 (2002).
- G. Hellinghausen, M.F. Wahab, and D.W. Armstrong, Anal. Bioanal. Chem. 412, 1925–1932 (2020).
- G. Hellinghausen, M.F. Wahab, and D.W. Armstrong, J. Chromatogr. A 1574, 1–8(2018).
Steven J. Lehotay, Yelena Sapozhnikova, and Nicolás Michlig are with the Eastern Regional Research Center at the US Department of Agriculture, in Wyndmoor, Pennsylvania. Michligis also with the Programa de Investigación y Análisis de Residuos y Contaminantes Químicos (PRINARC), in the Facultad de Ingeniería Química at the Universidad Nacional del Litoral, in Santa Fe, Argentina. Jaap de Zeeuw, Jana Rousova Hepner, and Joseph D. Konschnik are with Restek Corporation, in Bellefonte, Pennsylvania. Direct correspondence to: Joe.Konschnik@restek.com

In the present study, a gradient reversed-phase high-performance liquid chromatography (RP-HPLC) method has been designed and validated to quantify ornidazole (OZ) in the marketed formulation (oral gel) with the application of QbD.
A column with chemically modified column hardware showed improvements in analytical performance for siRNA compared to a conventional stainless-steel column.

.png&w=3840&q=75)

.png&w=3840&q=75)


.png&w=3840&q=75)


.png&w=3840&q=75)


