Cover Story - Technical Challenges Encountered During Chromatographic Method Transfers to Pharmaceutical Manufacturing Sites
Drug substance development requires a range of analytical methods to be developed to generate process knowledge and to support in-process and release testing throughout a synthetic sequence. Analytical chemists are challenged to ensure these fit-for-purpose methods are reliably transferred and executed at external manufacturing sites. The performance and robustness will differ based on method complexity, experience, proximity to final drug substance, and by the clinical stage of development. Here, we share experiences with a wide variety of transfer challenges and our remediation strategy.
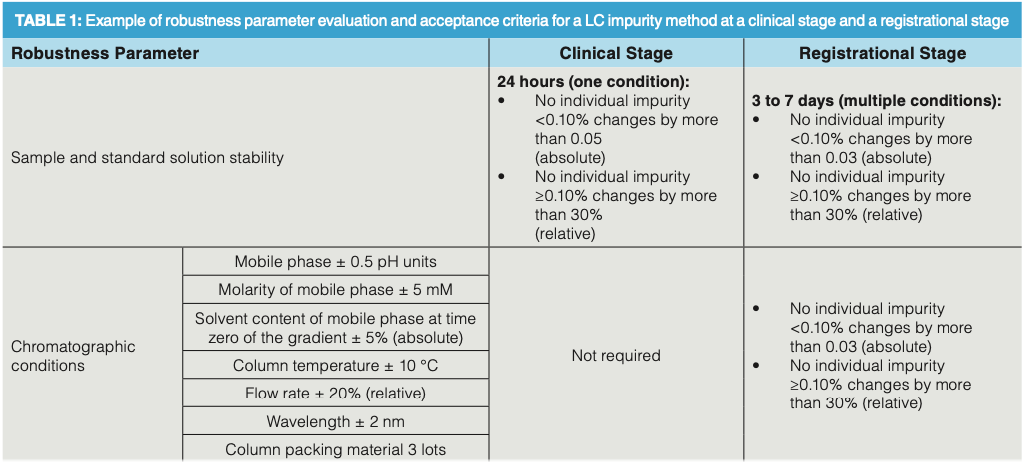
In support of drug substance development, analytical methods are developed to generate process knowledge, monitor reactions, and assess quality of input materials, intermediates, and drug substances. During clinical stages of development, we are challenged to ensure these fit-for-purpose methods are reliably executed at both external manufacturing sites as well as at internal process plants. In many cases, the methods are transferred to several analytical laboratories as a compound progresses through development (1). The needs and requirements for method transfers vary, ranging from compendial methods, which require familiarization, to project-specific methods, where the transfer is often driven by a formal process (2). The elements and criteria in the transfer protocols will differ, based on proximity to final drug substance or drug product, and by the clinical stage of development. During early stages of development, we typically have the receiving site qualify the method in their laboratories using requirements within their own quality systems. In later stages, methods are extensively evaluated for feasibility and robustness. For transfer of methods that will support critical regulatory requirements, such as support of registrational stability studies or process validation, many more details and formal protocols or co-validation strategies are employed (3). Some typical criteria applied at the clinical (Investigational New Drug [IND]) versus registrational (New Drug Application [NDA]) stages to ensure appropriate method performance and data quality are shown in Table I. In addition to fulfilling regulatory requirements (4–7), these more detailed protocols also help reduce the likelihood that method performance investigations will be encountered during the commercial product lifetime, which could jeopardize the supply chain and the availability of marketed products to patients.
Ultimately, the goal of all method transfers should be to ensure the methods generate equivalent data, regardless of which laboratory they are executed in. The risk to achieving successful transfers, as well as subsequent routine execution, can be linked to many factors, including method complexity, method robustness, instrumentation differences, and scientist experience or skill sets (8). In recent years, we have observed an increase in the structural complexity of small-molecule drug candidates, which has necessitated developing more complex and challenging analytical methods to gather vital process knowledge and ensure the quality of clinical materials (9,10). This, combined with the need for low-level monitoring (ppm) of potentially genotoxic impurities (11), has resulted in analytical control strategies increasingly utilizing analytical detection techniques outside of traditional quality control (QC)-friendly liquid chromatography–ultraviolet (LC-UV) and gas chromatography–flame ionization detector (GC-FID) instruments. Advances in commercially available instrumentation such as ultrahigh-pressure liquid chromatography (UHPLC), liquid chromatography–mass spectrometry (LC–MS), and specialty detectors, such as charged aerosol (CAD) and vacuum ultraviolet (VUV), have made more efficient, extensive characterization both a capability and an expectation amongst our collaborators and worldwide health authorities. As a result, transferring and executing these more challenging techniques is now routinely required in both process development laboratories and QC settings.
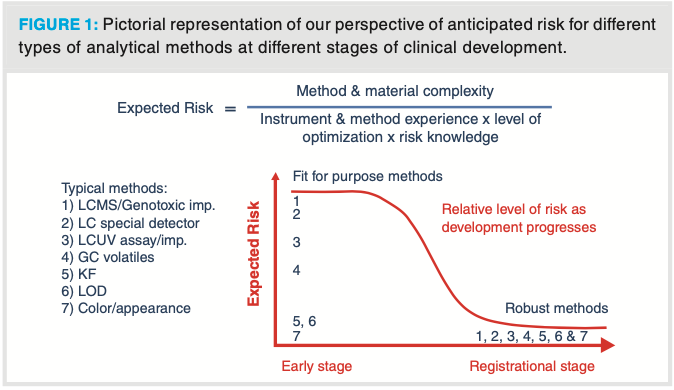
In Figure 1, we characterize our general expectations regarding the acceptable level of risk tolerance for methods as it relates to method complexity and stage of clinical development. Early in a project’s lifecycle, we expect the process to change, which often requires methods to change as well. At later stages of development, we want to perform more extensive robustness studies to ensure that the risks to transfer, validation, and execution are low, as we expect the process and methods to be close to those that will be used throughout the commercial lifecycle. In practice, we perform fewer robustness studies on early-stage methods, and, as a result, expect a higher level of risk to be associated with transferring these methods. General techniques such as Karl Fischer (KF), loss on drying (LOD), color, and appearance are often conducted under compendial conditions, and are not expected to provide significant risk during method transfer and execution. However, more challenging techniques, such as LC–MS or techniques using other specialty detectors, are expected to provide greater risk, largely due to instrumentation differences between sites and levels of experience at the vendor with these techniques.
Figure 1: Pictorial representation of our perspective of anticipated risk for different types of analytical methods at different stages of clinical development.
Many other factors that can influence whether the expected risks are realized during method transfer and execution in support of releasing clinical batches. Lack of process knowledge in early stages can result in new impurities being detected, potentially necessitating method modifications. Lack of full understanding of sample preparation techniques, stability, and chromatographic column robustness can cause issues. Later in development, full understanding of robustness ranges of critical method parameters can challenge the successful validation, transfer, or execution of methods as well. In this article, we share some of the hurdles we have encountered, and the lessons learned that we now apply to help reduce the risk of success for future method transfers and execution.
Detecting Changes in impurity Profiles
In early stages of development, we have limited experience with our synthetic processes, especially at larger scales of manufacture. We have also limited experience with our analytical methods, especially across a restricted number of on-scale drug substance batches. At these early stages, methods need to be objective, and therefore capable of detecting new impurities that would need to be characterized to ensure patient safety. Related, diligence in investigating the origin of these impurities is also needed, to provide critical knowledge regarding the process being developed.
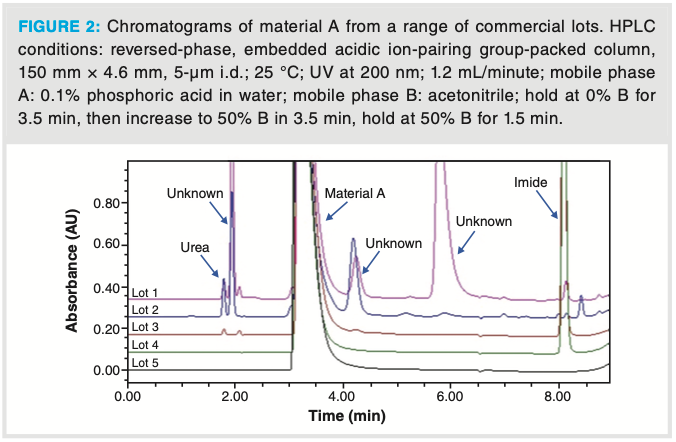
In this example, a GC method was initially developed in our laboratory to characterize a key reagent (material A) in a synthetic step. The method was successfully transferred to a vendor QC laboratory, and utilized to characterize the key reagent as it was received at their site. New impurities were found when analyzing a trial batch of the intermediate, which was produced using a new batch of the key reagent characterized by the GC method. Since these impurities were previously not seen, we launched an investigation to determine the origin of the unknown impurities. We first identified the impurities in the trial batch as urea monomers and dimer related substances. Nuclear magnetic resonance (NMR) analysis detected low levels of urea in the new lot of material A. However, urea could not be detected by the original GC method, because it was found to decompose in the injector. To address this, a low wavelength HPLC method was developed monitoring at 200 nm. As shown in the Figure 2, using the new HPLC method, urea, imide, and other unknown impurities were successfully detected in the various lots of material A. Analysis of several batches of material A demonstrated that the quality of this key reagent from various potential vendor lots was significantly different, and needed better analytical controls than what our original GC method provided. Therefore, the HPLC method was transferred and used for subsequent material release testing.
Figure 2: Chromatograms of material A from a range of commercial lots. HPLC conditions: reversed-phase, embedded acidic ion-pairing group-packed column, 150 mm x 4.6 mm, 5-μm i.d.; 25 °C; UV at 200 nm; 1.2 mL/minute; mobile phase A: 0.1% phosphoric acid in water; mobile phase B: acetonitrile; hold at 0% B for 3.5 min, then increase to 50% B in 3.5 min, hold at 50% B for 1.5 min.
For methods where we have limited experience, we need to look at data critically to ensure the data are appropriate. Investigation into data accuracy and peak purity can involve using orthogonal techniques to determine whether undetected impurities are sufficiently evaluated and characterized. In this way, patient safety is not compromised using a fit-for-purpose approach.
Sample Preparation and Handling Challenges
In our experience, subtle differences in common analytical practices (such as weighing, mixing, and pipetting) at different testing sites can provide significant transfer difficulties. For example, we have encountered issues with aluminum weighing boats used at a receiving laboratory to weigh small sample amounts when the original method used plastic weigh boats. When the receiving laboratory subsequently sonicated the solution with the weighing boat in the volumetric flask, low recoveries were seen for analytes that could chelate with aluminum.
Another challenge that is often encountered with methods in early stages is inconsistent levels of known impurities reported by a receiving laboratory. In Figure 3a, the results table illustrates significantly different levels of a known impurity (labeled as impurity X in the chromatogram) being detected in intermediate material B during an LC method transfer. In this case, the high levels (0.35%) of impurity X in the first preparation and analysis are of significant concern, as they would have triggered the need for studies to understand the quality impact to drug substance upon release. During our initial investigation, we did not discover any issues that would suggest instrument variability was the root cause. Similar results were obtained on different instruments in the laboratory, different sample batches, new columns, and freshly prepared mobile phases and diluent.
Figure 3: Comparison of chromatograms for duplicate material B sample solutions which were prepared following: (a) the receiving laboratory’s practice of weighing and mixing, (b) the development laboratory’s practice of weighing and mixing. HPLC conditions: reversed-phase, embeddic acidic ion-pairing group-packed column, 4.6 mm x 150 mm, 5-µm i.d.; 10 °C; UV at 205 nm; 1.2 mL/minute; mobile phase: 0.25% perchloric acid in 55:45 water:acetonitrile; isocratic for 15 min.
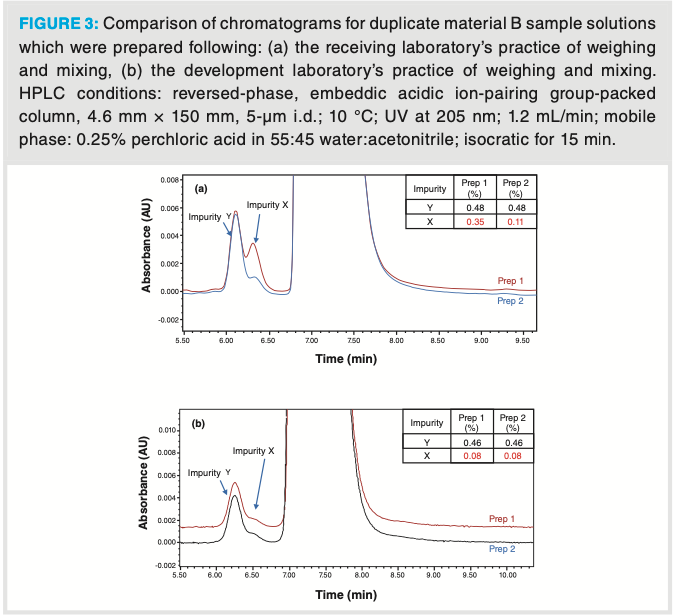
In the course of investigating the sample preparation procedure through the use of video, we observed that it took a much longer time for the samples to dissolve in the receiving laboratory. The mixing practice employed in our laboratory involved dissolving the sample with a reasonable amount of diluent and agitation prior to bringing the volumetric flask to volume. In the receiving laboratory, after the sample weight measurement, the solids were rinsed into a volumetric flask with a minimal volume of diluent, and left for several minutes without further dilution or mixing. A significant amount of undissolved solids remained on the bottom of the volumetric flask until the second addition of diluent was added. During method development, a 50 mM NaOH in 50:50 acetonitrile:water diluent was chosen to stabilize the sample solution, which we knew degraded to form impurity X in neutral or acidic diluents. We believe inconsistent levels of impurity X were caused by degradation occurring prior to mixing completion, due to undissolved material B (a disulfuric acid salt), creating a localized environment which was not basic enough to prevent degradation. In a concentrated and non-agitated solution, the base in the diluent near the solids were consumed by the sulfuric acid counter ion, and therefore unable to prevent the formation of impurity X. This was remedied by ensuring consistent dilution, and mixing methods were used across the laboratories to prepare the sample. Training videos, clearly describing the sample preparation steps, were created, which were effective at achieving consistent and accurate results from the receiving laboratory, as shown in Figure 3b.
Another sample preparation related example involved ensuring an in-process control (IPC) method was providing results representative of when the sample was drawn from a reaction. IPC samples are often slurries or suspensions, which provide unique challenges related to sample homogeneity and stability when compared to isolated synthetic intermediates, which are often crystalline materials. In order to provide results that are representative of the batch, sample quenching frequently needs to be employed as part of sample preparation procedure for unstable samples. In these cases, it is critical to understand the details regarding sample-handling logistics, to ensure that accurate results can be achieved at different manufacturing sites.
In this example, we developed a method to analyze a reaction completion sample for the synthesis of material C that was unstable at room temperature. This required the sample to be delivered on ice to the QC laboratory after it was drawn from the reaction vessel. Adding to the challenge, the sample was also water sensitive, and would convert back to the starting material of the reaction. As a result, failure to prevent the degradation of the sample could cause the IPC to not pass, due to a false negative result. During in-house small-scale production runs, the IPC sample was delivered cold from the manufacture laboratory, and the sample was immediately quenched with anhydrous methanol in the analysis laboratory. Quenching the sample with methanol provided adequate stability, and low temperature was not required during the remainder of the sample preparation and subsequent analysis. When utilizing a contract manufacturing organization to provide increased scale of production, delivering the sample on ice proved challenging, because the analytical laboratory was not in close proximity to the production plant. Therefore, to reduce the risk of a false IPC result, a protocol was instated to quench the IPC sample on the production floor. This required providing a detailed sample quenching procedure, and training for the unit operation workers in the plant. This enabled a stable IPC sample to be delivered to the QC laboratory for further sample preparation and testing. At commercial vendors, this is a more common practice for the preparation of unstable IPC samples for analytical testing and can be effective with clear and simple instructions and plant operator training.
The above examples provide real-world experience where sample preparation can provide challenges to ensure successful transfer and execution of methods. Small differences in sample preparation techniques related to weighing, dilution, and mixing can create variability in analytical results. Sharing important knowledge on sample stability and clear, detailed sample preparation details with appropriate limitations will lower the risk of test problems. Additionally, close evaluation of receiving laboratories’ unit operation techniques should be an early focus when investigating unexpected results, particularly for intricate and sensitive sample preparations. Clear instructions within the method and developing training videos are additional best practices we have employed to minimize the risk of sample preparation differences causing inaccurate results.
Long-Term Column Robustness
Chromatographic column-to-column evaluation is important to ensure robustness for long-term commercial support. During method robustness studies, LC columns packed from three different production batches of stationary phase are tested to ensure adequate reproducibility. Another practical consideration to consider is the long-term availability of the column chemistry and geometry. This risk can be mitigated by selecting established column chemistries and formats from global vendors where one should expect commercial (and not custom production) availability over many years. In our experience, column manufacturers have welcomed establishing meaningful collaborations to mitigate this risk. While these collaborations are extremely beneficial, they do not eliminate the risk that future batches of stationary phase synthesized by the column vendors will perform precisely the same as columns that have been utilized during our method robustness studies. New batches of stationary phases are verified to be equivalent using standard test mixtures; however, this does not always ensure the columns will perform equivalently for our more difficult separations as well.
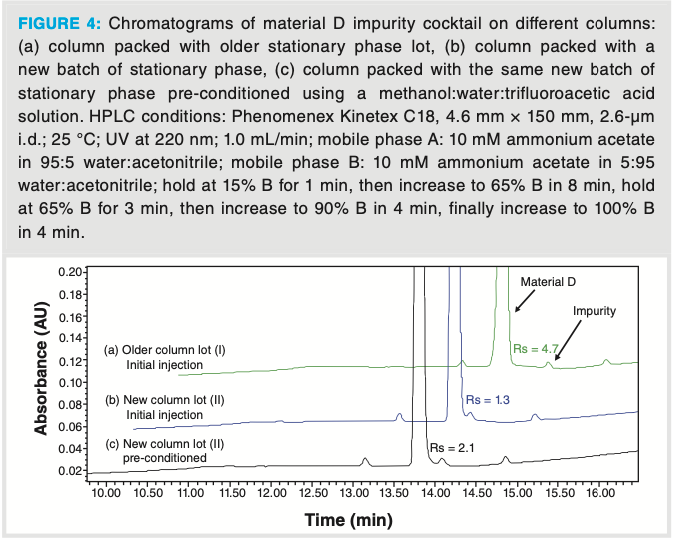
One example we have encountered involved the use of a highly end-capped C18 column to monitor the impurity profile of a compound we expected to be commercialized. During our method robustness, we observed satisfactory column-to-column reproducibility on several batches of columns that were packed with different stationary phase lots. All columns tested exhibited a resolution (Rs) > 3.0 between a critical impurity and the main peak (Figure 4a). However, when transferring the method to one of the anticipated commercial vendors, we observed a much lower resolution (Rs = 1.3) for the same critical pair (Figure 4b). During our investigation, we discovered the column was packed with a new batch of stationary phase synthesized by the vendor. Ultimately, we addressed this challenge in two manners that solved the reproducibility issue. First, we worked with the vendor to ensure an adequate stock of columns packed with previous batches of stationary phase were either purchased or remained in the vendor’s inventory for future use. Second, we developed a column conditioning procedure using a methanol, water, and trifluoroacetic acid solution, which produced reproducible Rs > 2.0 for the critical pair (Figure 4c). The instructions for the column conditioning were incorporated into the method to achieve robust column performance for long-term commercial manufacturing support. This, along with appropriate system suitability requirements for the Rs of the critical pair, have ensured the method performs as expected.
Figure 4: Chromatograms of material D impurity cocktail on different columns: (a) column packed with older stationary phase lot, (b) column packed with a new batch of stationary phase, (c) column packed with the same new batch of stationary phase pre-conditioned using a methanol:water:trifluoroacetic acid solution. HPLC conditions: Phenomenex Kinetex C18, 4.6 mm x 150 mm, 2.6-µm i.d.; 25 °C; UV at 220 nm; 1.0 mL/minute; mobile phase A: 10 mM ammonium acetate in 95:5 water:acetonitrile; mobile phase B: 10 mM ammonium acetate in 5:95 water:acetonitrile; hold at 15% B for 1 min, then increase to 65% B in 8 min, hold at 65% B for 3 min, then increase to 90% B in 4 min, finally increase to 100% B in 4 min.
Laboratory Instrument Set Up Differences
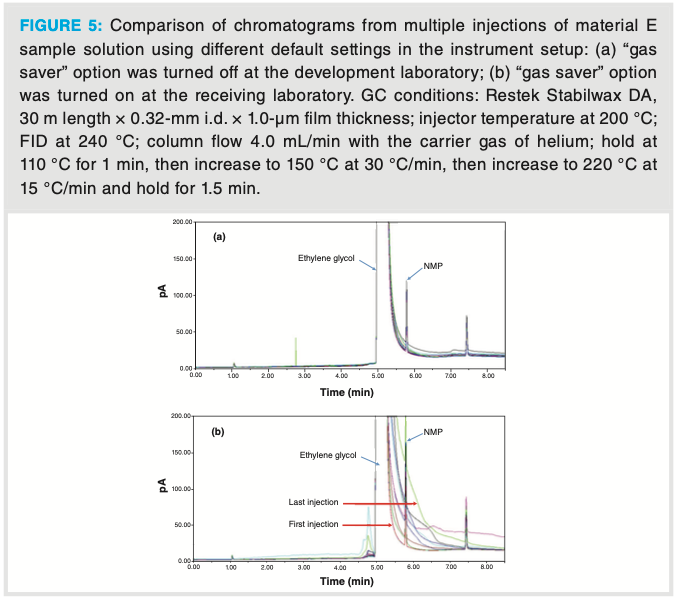
Method robustness studies typically ensure that methods can produce equivalent results on different brands of the same instrument that are to be utilized across the vendor network. Many development laboratories maintain a diverse fleet of instrumentation, so this can be tested prior to transferring methods, as well as troubleshoot on the same type of instrument used at the receiving laboratory. When transferring methods to different laboratories, we also have encountered unanticipated problems caused by other laboratories using different default parameters in their instrument setup than we utilize in our laboratories. As an example, a GC residual solvent method was developed for trace n-methyl pyrrolidone (NMP) in an isolated intermediate, material E. Due to the low solubility and stability of material E in many solvents, we chose a diluent of ethylene glycol for sample preparation. Although we considered this a “non-standard” diluent, the method showed good reproducibility in our laboratories, as shown in Figure 5a, and was successfully validated. During method transfer to a vendor QC laboratory, we observed significantly worse tailing of the ethylene glycol diluent peak after several sample solution injections, such that it interfered with the analyte of interest as shown in Figure 5b. During our investigation, we discovered the receiving laboratory had the “gas saver” option turned on, which differed from our laboratory’s instrument setting but crucially was not part of our analytical method instructions. Although this setting enables saving helium gas, it also enabled a greater degree of sample degradation in the injector port that produced tailing of the ethylene glycol after multiple injections. This was not observed when the gas saver option was off. To address this, we ensured the method description was updated to explain clearly that the gas saver setting should be turned off.
Figure 5: Comparison of chromatograms from multiple injections of material E sample solution using different default settings in the instrument setup: (a) “gas saver” option was turned off at the development laboratory; (b) “gas saver” option was turned on at the receiving laboratory. GC conditions: Restek Stabilwax DA, 30 m length x 0.32-mm i.d. x 1.0-µm film thickness; injector temperature at 200 °C; FID at 240 °C; column flow 4.0 mL/min with the carrier gas of helium; hold at 110 °C for 1 min, then increase to 150 °C at 30 °C/min, then increase to 220 °C at 15 °C/min and hold for 1.5 min.
Ensure Performance with Well-Defined System Suitability
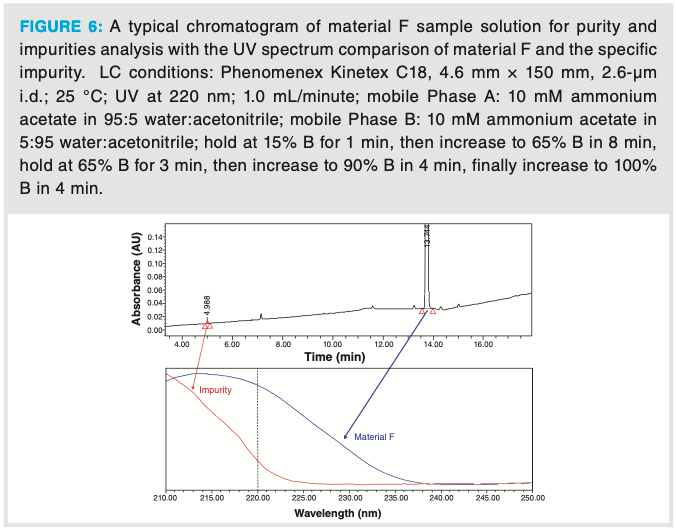
A challenge associated with developing LC-UV impurity profiling methods is ensuring accurate quantitation of all the critical impurities, especially when impurities have significantly different UV absorbance spectra. Different impurities may have different UV maxima and, as a result, the choice of detection wavelength for a method can limit both sensitivity for one or more components and vary the relative response factor for quantitation. It is impractical to develop methods where many different wavelengths are utilized and, ideally, a single method wavelength can be employed. As a result, choosing a wavelength that happens to fall on a slope in the UV spectrum of an impurity cannot always be avoided. When this occurs, variability in the data accuracy with the UV detector needs to be considered due to small differences in detector calibration. An example of this is provided in Figure 6, where the chosen UV wavelength for an intermediate material F falls on a part of the absorbance spectra that has a large slope for a specific impurity. In this example, variation in detection wavelength of ±2 nm (the typical robustness range evaluated) provided a 55% difference in the area percent of the impurity, as shown in Table II. In this case, all other elements of the validation met acceptance criteria, and this specific impurity was the only robustness concern the method provided. The impurity was highly purged in the downstream chemistry, and was not expected to provide a significant risk to the overall quality of the final drug substance. After verifying typical UV detector calibration and verification specifications were ±1 nm, and, confirming this performance on a large number of LC-UV instruments, we decided to validate the method at the vendor using a detector robustness range of ±1.0 nm for this impurity. To ensure instrument-to-instrument reproducibility throughout the commercial lifecycle of this project, we also employed an additional system suitability criterion using an impurity cocktail to confirm the results for this impurity were within ±30% of the area percent listed in the cocktail certificate of analysis. With these precautions, the detection wavelength variation is well monitored with controls in place to ensure accurate results are reported.
Figure 6: A typical chromatogram of material F sample solution for purity and impurities analysis with the UV spectrum comparison of material F and the specific impurity.
Human Errors Found During Transfers
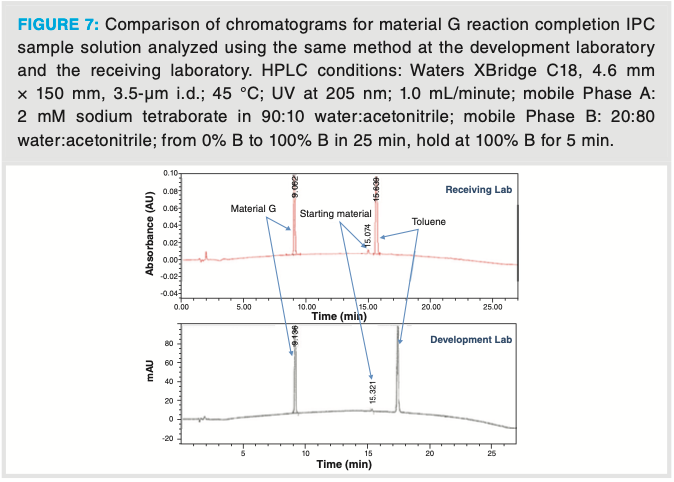
A risk to successful method transfer and execution that can likely never be fully mitigated is that of human error. Unfortunately, these errors are often difficult to identify and assign conclusively as a root cause, especially when investigating a remote laboratory location. The chromatograms in Figure 7 illustrate significant retention time differences (>2 min) for the toluene peak obtained between two laboratories conducting a reaction completion IPC analysis for the synthesis of intermediate material G. Significant retention differences were not observed for the other peaks in the chromatogram. A thorough investigation was performed, and no evidence was found that the method parameters could affect the retention time on toluene only. Eventually the root cause was identified as the analyst using a C8 column, instead of the method’s specified C18. A typical separation was obtained at the receiving laboratory once the correct column was used.

Conclusion
Method development, validation, and technology transfer requires appropriate planning to help minimize incidences and risks. However, as illustrated above, even when good plans with control strategies are implemented, seemingly simple routine transfers can sometimes be challenging. These challenges can come from a variety of sources. An open mind and thorough investigation may be needed to ensure the method will perform well in the future. How to manage the amount of time, resources, and effort expended in a root cause determination when methods fail depends on long-term needs. With a combination of risk planning prior to transfers and sharing all appropriate available knowledge between sending and receiving laboratories, the number of issues can be reduced. However, it is hard to cover all risks, as some are inevitably unpredictable. Method transfers provide a challenge for any method developer; however, they also enable a significant amount of method performance knowledge to be gathered in a short period of time. This transfer experience helps build skills and insight that feed back into developing appropriate methods for early and late stage drug development support.
Acknowledgements
The authors wish to acknowledge our colleagues with whom we have collaborated to perform method transfers and gain the experience summarized within this paper. Xuejun Xu, Kieran O’Conner, Rachel Wall, Jarlath Groarke, Vincent Gavin, Rafal Stachura, Junbae Oh, Shinyoung Yune, Sandrine Cudre, Romain Curti, Virginie Colombel, Li Li, Phillip Houde, Qinggang Wang, Weiqing Fu, Elizabeth Yuill, Jonathan Shackman and Morgan O’Sullivan have all worked diligently to execute the method transfers described in this manuscript. We also want to recognize our synthetic chemistry and chemical engineering colleagues such as Albert Delmonte, Kenneth Fraunhoffer, Amanda Rogers, Ke Chen, Daniel Treitler, Dong Lin, Bahar Inankur, Michaël Fenster, Collin Chan, Matthew Hickey, Patrick Sipple, Jose Tabora, Thomas La Cruz, Eric Huang, Robert Forest, Steve Tymonko, Shawn Pack, Jason Sweeney and Benjamin Cohen who provided important expertise in their areas of specialty in solving some of the problems encountered during the transfers described.
References
- A. Shanley, Pharm. Tech. 40(3), 26–30 (2016).
- J. Ermer, M. Limberger, K. Lisb, and H. Wätzigc, J. Pharm. Biomed. Anal. 85, 262–276 (2013).
- K. O’Connor, N. Hulme, and Y. Shi, Pharm. Tech. 41(4), 38–48 (2017).
- ICH Q2B Validation of Analytical Procedures: Methodology (November, 1996).
- USP 41, General Information Chapter <1224>: Transfer of Analytical Procedures (Rockville, Maryland).
- USP 41, General Information Chapter <1225>: Validation of Compendial Procedures (Rockville, Maryland).
- USP 41, General Information Chapter <1226>: Verification of Compendial Procedures (Rockville, Maryland).
- P. Tattersall, X. Xu, and B. Kleintop, Am. Pharm. Rev. 21(4), 30–37 (2018).
- J. Li and M. D. Eastgate, Org. Biomol. Chem. 13, 7164–7176 (2015).
- M.D. Eastgate, M.A. Schmidt and K.R. Fandrick, Nat. Rev. Chem. 1, 16 (2017).
- ICH M7(R1) Assessment and Control of DNA Reactive (Mutagenic) Impurities in Pharmaceuticals to Limit Potential Carcinogenic Risk (March, 2017).
Peter Tattersall, Jia Zang, and Brent Kleintop work in Chemical & Synthetic Development at Bristol-Myers Squibb, in New Brunswick, New Jersey. Direct correspondence to: amatheson@mjhlifesciences.com.
Separating Impurities from Oligonucleotides Using Supercritical Fluid Chromatography
February 21st 2025Supercritical fluid chromatography (SFC) has been optimized for the analysis of 5-, 10-, 15-, and 18-mer oligonucleotides (ONs) and evaluated for its effectiveness in separating impurities from ONs.

.png&w=3840&q=75)

.png&w=3840&q=75)


.png&w=3840&q=75)


.png&w=3840&q=75)


