Systematic Evaluation of HILIC Stationary Phases for MS Characterization of Oligonucleotides
Hydrophilic interaction chromatography–mass spectrometry (HILIC-MS) offers a flexible and efficient alternative to ion-pairing reversed-phase liquid chromatography (IP-RPLC) for oligonucleotide analysis, with column selectivity and mobile phase pH being key factors in optimizing retention and detection.
Ion-pairing liquid chromatography (IP-RPLC) coupled to mass spectrometry (MS) represents the most common analytical approach for oligonucleotide analysis (1–3). Alternative separation methods are desired as alkylammonium ion-pair reagents force users to have dedicated instruments. Moreover, the use of highly fluorinated chemicals, such as hexafluoroisopropanol (HFIP), as mobile phase modifiers have been under scrutiny because of potential environmental and health-related issues (4). Although ion-exchange chromatography (IEX) represents a viable alternative technique because of its excellent selectivity for oligonucleotides based on their length and negatively charged phosphate backbone, it is not preferred because of its mobile phase incompatibility with MS detection. Hydrophilic-interaction chromatography (HILIC) is an analytical separation technique where analytes are retained because of their polarity as they partition between the organic-rich mobile phase and an aqueous layer created by the hydrophilic stationary phase. The polar nature of oligonucleotides lends itself well to this approach. Moreover, HILIC serves as a valuable alternative to IP-RPLC and IEX as HILIC mobile phases are compatible with MS, thus providing flexibility in instrument use.
A wide variety of HILIC stationary phases exist with different polar functional groups that can contribute to oligonucleotide interaction as the analyte partitions into the water layer near the particle surface. Lardeux and others previously evaluated seven zwitterionic HILIC columns from various manufacturers and provided valuable insights into the columns’ retention characteristics that were dependent on the oligonucleotide’s chemical makeup (5). In our study, five commonly used HILIC chemistries were evaluated. The columns evaluated include bare silica, poly-hydroxy fructan, zwitterionic, and two different amide chemistries. These five columns were initially screened with the Tanaka test, which is a well-established method to characterize HILIC separation mechanisms (6). This was followed by HILIC-MS analysis of DNA and RNA standards at acidic, neutral, and basic conditions to determine the impact of mobile phase pH on column selectivity and MS ionization for oligonucleotides.
The work presented in this article aimed to characterize the main attributes of the HILIC columns and determine the utility of these columns for MS detection of unmodified and heavily modified samples that mimic biopharmaceutical products. This study highlights the utility of HILIC for oligonucleotide analysis, as well as the critical parameters that need to be considered to optimize LC–MS performance.
Materials and Methods
HILIC Columns
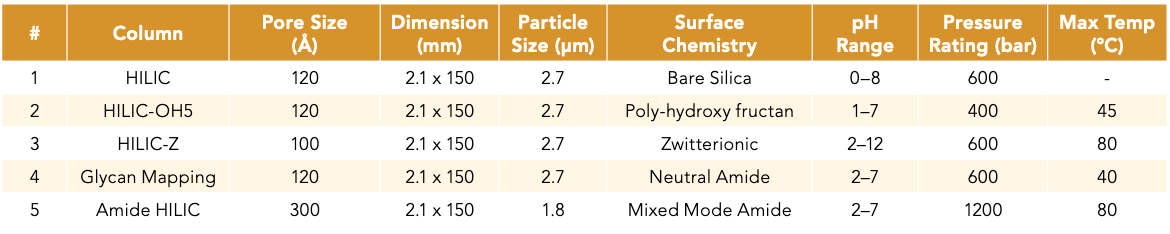
Five HILIC columns (Agilent Technologies) were evaluated in this study. The columns included the Poroshell 120 HILIC (P120 HILIC), HILIC-OH5, HILIC-Z, Amide HILIC, and Glycan Mapping. The Glycan Mapping column represents a neutral amide stationary phase, whereas the Amide HILIC column represents a mixed-mode HILIC stationary phase with both amide and ion-exchange functionality. All columns contain 2.7 μm superficially porous particles (SPPs), except for the Amide HILIC column, which is a 1.8 μm fully porous particle. A summary of the columns used is described in Table I.


Table I: List of HILIC stationary phases evaluated for oligonucleotide separation.
Tanaka Test
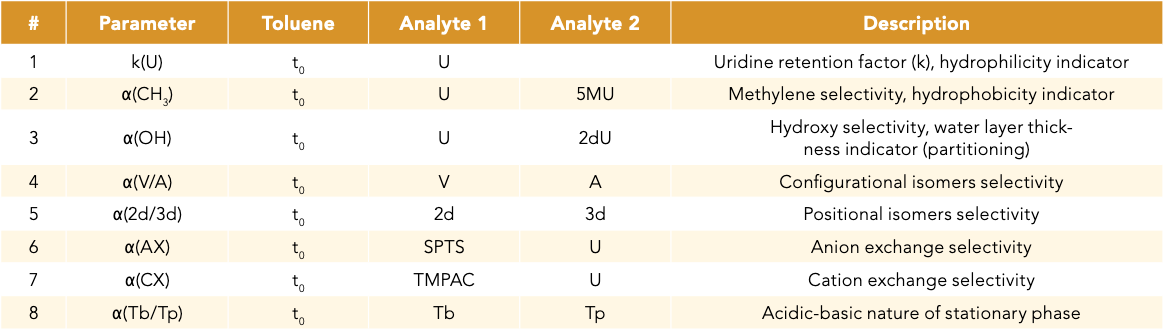
The Tanaka test method was adapted from Lardeux and others and applied to the five HILIC columns. Stock solutions of each compound were prepared at 1 mg/mL by dissolving 1 mg of analyte in 1 mL of the mobile phase. The Toluene solution (1 mg/mL) was used as the t0 marker and prepared by diluting 1.5 μL of toluene in 1 mL of the mobile phase. The test mixtures of the key analyte pairs are listed in Table II. Isocratic separations were performed with analytes at 1 mg/mL, mixtures at 0.33 mg/mL, and an injection volume of 1 μL. A stock solution of 200 mM ammonium acetate adjusted to pH 4.7 with acetic acid was first made. Solvent A was prepared by mixing 100 mL of the stock solution with 900 mL of acetonitrile, which yielded a final concentration of 20 mM ammonium acetate (pH 4.7) in 90% acetonitrile. The flow rate was set at 0.5 mL/min and the column temperature was set at 30 °C. Absorbance data were acquired at 260 nm with five replicate injections per column.

Table II: The relative retention of key analyte pairs was used to calculate the indicated retention and selectivity characteristics. Toluene was used as t0 marker with the following chemicals: uridine (U), 5-methyluridine (5MU), 2’-deoxyuridine (2dU), adenosine (A), vidarabine (V), 2’-deoxyguanosine (2d), 3’-deoxyguanosine (3d), sodium p-toluenesulfonate (SPTS), N,N,N-trimethylphenylammonium chloride (TMPAC), theobromine (Tb), and theophylline (Tp).
HILIC-MS Analysis of Oligonucleotides
Stock solutions of 100 mM ammonium acetate with pHs of 4.4, 6.8, and 9.0 in water were first made. The acidic buffer was adjusted to pH 4.4 with acetic acid. The basic buffer was adjusted to pH 9.0 with ammonium hydroxide. Solvent A was prepared by mixing 100 mL of each stock solution and 900 mL of water, which yielded a final concentration of 10 mM ammonium acetate at the specified pH in water. Solvent B was made by mixing 100 mL of the appropriate stock solution with 900 mL of acetonitrile, which yielded a final concentration of 10 mM ammonium acetate at the specified pH in 90% acetonitrile. The flow rate was 0.25 mL/min, and the column temperature was set at 30 °C. For the analysis of the 18-mer anti-sense oligonucleotide (ASO), the column was held at 75% solvent B for 2 min before the gradient with solvent A was applied. The gradient elution profile was from 75% B to 55% B for 7 min, followed by washing with 55% B for 2 min. The column was equilibrated with 75% B for 5 min prior to subsequent analysis, resulting in reproducible retention time from injection to injection. Full MS (MS1) data was acquired with a mass range of 300–3200 m/z and an acquisition rate of 1 spectrum/s on a 6545XT AdvanceBio LC/Q-TOF system (Agilent Technologies). The instrument was operated in negative ion mode.
Results and Discussion
Tanaka Test Results
The Tanaka test was initially performed to better understand the retention characteristics of each of the HILIC column chemistries and how they may contribute to the retention and selectivity of oligonucleotides. The goal was to try and use this information to understand why one HILIC column chemistry may perform better than another for oligonucleotide separation. The retention times collected from each column are used to calculate the retention factor (k) of each analyte. The ratio of key analyte pairs was then used to determine the selectivity values (Figure 1). The retention factor of uridine, k(U), can be used to estimate the HILIC stationary phases’ retentiveness for hydrophilic molecules. Based on the results, the HILIC-OH5, Glycan Mapping, and HILIC-Z columns were the most retentive, followed by the Amide HILIC column. Not too surprisingly, the P120 HILIC bare silica column had the lowest retentiveness with the least uridine retention compared to the other stationary phases functionalized with polar groups.

Figure 1: Radar plots for five different HILIC stationary phases, with the average of five replicate injections plotted.
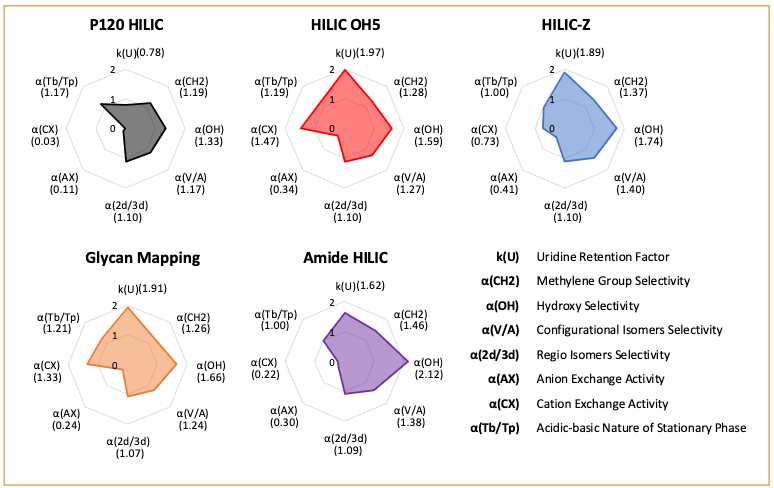
In addition to polar interactions, hydrophilic partitioning also plays a significant role in HILIC-based separation. Hydrophilic partitioning is based on the thickness of the immobilized water layer on the stationary phase, which can be estimated using the α(OH) (7). The Amide HILIC column had the highest α(OH) value, followed by the HILIC-Z, Glycan Mapping, and HILIC-OH5 columns with less than 25% difference amongst the four functionalized columns. The P120 HILIC bare silica column had the lowest α(OH) value; thus, it had the thinnest adsorbed water layer on the stationary phase.
The selectivity for a methylene group, α(CH2), can be used to determine the hydrophobic selectivity of the stationary phase. This separation mechanism is useful to resolve methylated impurities from target products, which is measured by the relative retention of 5-methyluridine and uridine. The Amide HILIC column had the highest α(CH2) value, but less than 20% difference was observed across the columns (Figure 1). This indicated minimal hydrophobic selectivity differences amongst the columns screened in this study.
IEX interactions can be influential in HILIC separation, leading to drastic changes in selectivity. Because oligonucleotides are anionic molecules with a phosphate backbone that is negatively charged, anion-exchange (AX) interactions play a stronger role in oligonucleotide retention relative to cation exchange (CX). The HILIC-Z column was found to have the highest α(AX) value followed by HILIC-OH5 and Amide HILIC columns. In comparison, the other columns have moderate to low AX capacities (Figure 1). A representative chromatogram for α(AX) and k(U) is shown in Figure 2 to illustrate the separation of SPTS and U relative to t0 on each individual HILIC column. This figure also demonstrated the selectivity and retention time differences across the five different HILIC stationary phases. Of note, the lower-than-expected IEX activity collected for the bare silica and amide phases could be because of the use of higher buffer concentrations (20 mM). The higher buffer concentration could have negated the detection of both the cationic and anionic exchange properties, thus reducing the IEX activity. Future experiments using lower buffer concentration would be ideal in order to properly assess these columns’ IEX selectivity.

Figure 2: Separation of key analyte pairs to determine attributes that participate in the HILIC retention mechanism. The example shown illustrates the retentiveness of the HILIC stationary phases that can be estimated based on the retention factor of uridine, k(U). The relative retention of sodium p-toluenesulfonate (SPTS) vs. uridine (U) can be used to calculate the anion exchange selectivity, α(AX).
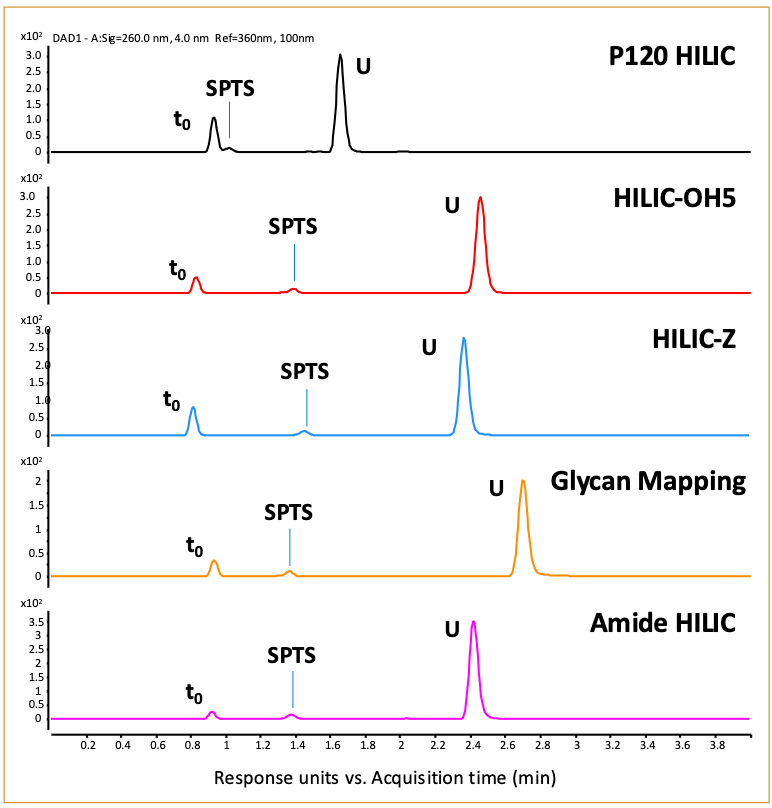
Based on the k(U) and α(AX) values, columns may be categorized by their relative ability to retain negatively charged analytes, a particular interest for oligonucleotide analysis. HILIC-OH5 and HILIC-Z columns are expected to be the most retentive materials, followed by Glycan Mapping and Amide HILIC columns, with the P120 HILIC bare silica column being the least retentive material (Figure 2).
Evaluating HILIC Columns with Oligonucleotides
To assess the utility of the different HILIC stationary phases with oligonucleotides, the columns were evaluated at pH 4.4, pH 6.8, and pH 9.0, as the varying mobile phase composition could change the stationary phases’ selectivity and thus alter oligonucleotide separation. Moreover, the mobile phase buffer pH may play a role in oligonucleotide electrospray ionization (8). Understanding and balancing the impact of buffer choice on retention, selectivity, and ionization efficiency is critical when developing optimized LC–MS methods.
To ensure a fair comparison across all columns, the same gradient slope (30% B linear change in 10 min) was used. In general, the columns performed better at pH 6.8 than the acidic pH 4.4 condition (Figure 3a and 3b). This is understandable given the benefits of elevated pH for oligo analysis because it promotes denaturing conditions that result in better retention, resolution, selectivity, and ionization for IP-RP (9). Moreover, the Glycan Mapping column yielded the best selectivity in resolving the varied oligonucleotides of different sequence lengths, followed by the HILIC-Z and then the HILIC-OH5 columns. The P120 HILIC column showed poor selectivity for the DNA oligonucleotides, which was anticipated based on the poor retention and ion-exchange activity determined through the Tanaka test. However, the Amide HILIC column’s results were unexpected because changes to the mobile phase composition did not yield any detectable oligonucleotide peak. This may be because of the ion-exchange proper ties of the mixed-mode column, which is surprising given that this column did not show the most ion-exchange characteristics for the small molecule probes in the Tanaka test. This perceived difference may be reflective of the structural complexity of the oligonucleotides, as well as the positional location of the ion-exchange functionality on the different bonded HILIC phases. Further mobile phase and gradient optimizations such as an increase in salt concentrations are required to elute the oligonucleotides off the column.

Figure 3: HILIC–MS analysis of 15-, 20-, 25-, 30-, 35-, and 40-mer DNA sample using stationary phases with varying chemical properties with 10 mM ammonium acetate buffer at (a) pH 4.4 and (b) pH 6.8. (c) The HILIC-Z column was additionally tested at pH 9.0. The gradient used for each individual column is listed in the top right corner of each chromatogram. The gradient was modified to improve peak resolution and adjust for retention time shifts when switching the pH of the mobile phase.
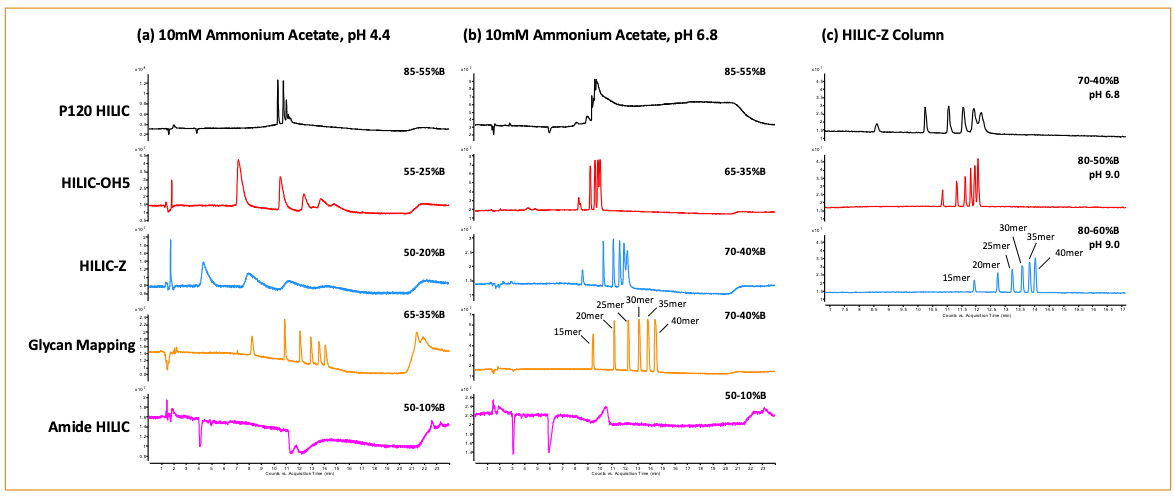
Given the improved performance of the oligonucleotides going from acidic to neutral pH, the impact of elevated pH was further explored with the HILIC-Z column because of its stability at higher pH (10). The oligonucleotide sample was analyzed with the HILIC-Z column at pH 6.8 and pH 9.0 (Figure 3c). At pH 6.8, the HILIC-Z column yielded slightly broader peaks than pH 9.0 with lower resolution between the 35-mer and 40-mer oligonucleotides. At pH 9.0, the oligonucleotide peaks were noticeably sharper. Baseline separation could be achieved by flattening the gradient from 3% B/min to 2% B/min, with the potential to use an even shallower gradient to further resolve the oligonucleotides.
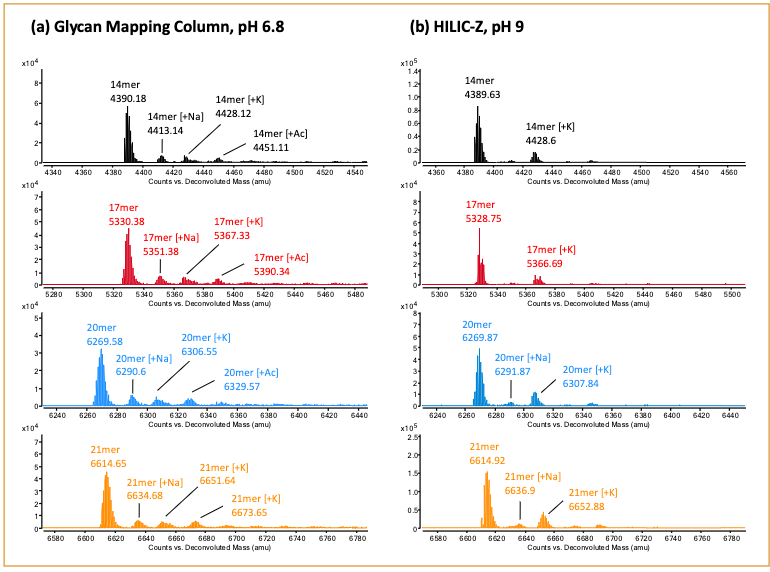
Based on the results shown in Figure 3, we decided to continue the downstream analysis with the Glycan Mapping column at pH 6.8 and the HILIC-Z column at pH 9.0. RNA samples composed of 14-, 17-, 20- and 21-mer lengths were analyzed on the two columns (Figure 4). Importantly, the 20 and 21-mer RNA samples were resolved with both columns, where separation of the n-1 oligonucleotide pair represents a critical attribute that is closely monitored for the incomplete synthesis of an oligonucleotide (11,12). A closer examination of the mass spectra revealed a wider charge state distribution for the oligonucleotides analyzed with mobile phase buffer at pH 6.8 than pH 9.0. Specifically, a range of 4- to 8-charge states were observed for the 21-mer RNA at pH 6.8 (Figure 5a). In contrast, a range of 4- to 6-charge states were observed for the RNA oligonucleotides at pH 9.0 (Figure 5b). As the length of the oligonucleotide sequence increases, the ability to detect higher charge states would become necessary to allow for detection within the mass range limitations of the mass spectrometer. Furthermore, a broader range of detectable charge states lends more confidence in the target analyte’s identification. In addition to optimizing the chromatographic conditions for the columns, it’s equally important to determine the method’s compatibility to yield an optimal MS signal response. This allows users to confidently identify the peaks detected by LC–MS. This was demonstrated in Figure 6, where the spectral deconvolution of the mass spectra confirmed the masses for the 14-, 17-, 20-, and 21-mer RNA.

Figure 4: HILIC separation of 14-, 17-, 20-, and 21-mer RNA using the Glycan Mapping column at pH 6.8 and HILIC-Z column at pH 9.
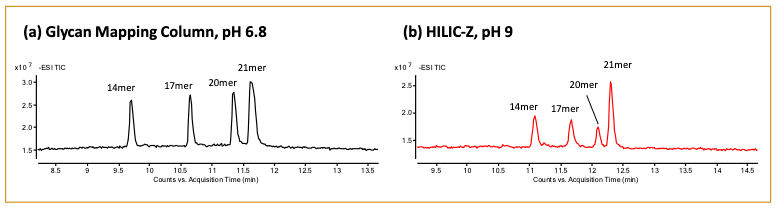

Figure 5: Full-scan MS1 mass spectra for 14-, 17-, 20-, 21-mer RNA.
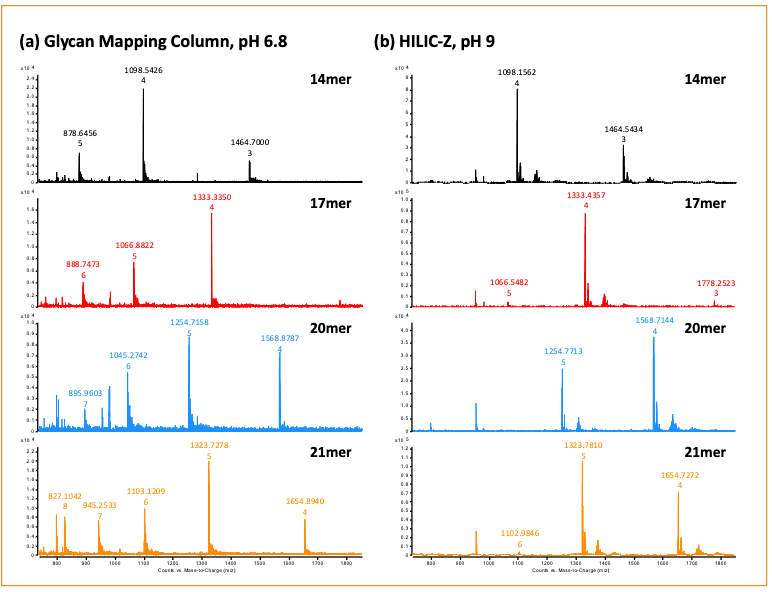

Figure 6: Spectral deconvolution of 14-, 17-, 20-, 21-mer RNA, showing the applicability of the LC–MS method for intact mass determination.
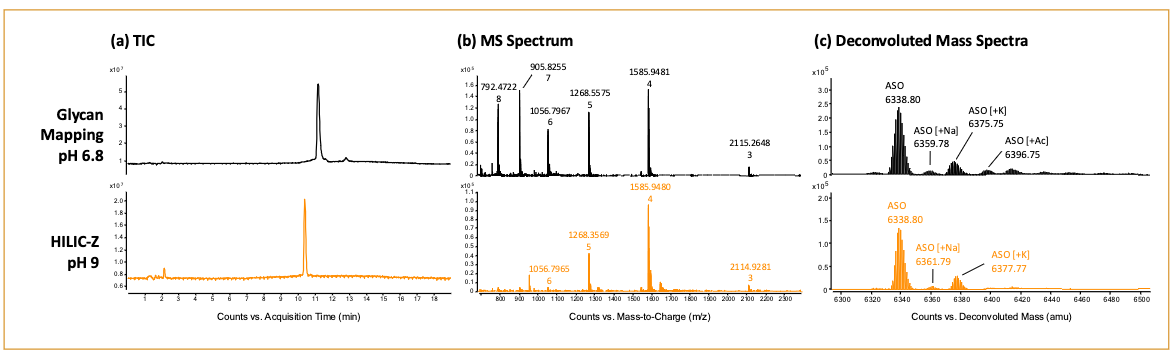
To evaluate our optimized HILIC-MS methods with a heavily modified oligonucleotide, an antisense oligonucleotide (ASO) with multiple phosphorothioate bonds and 2-methoxyethoxy (2MOE) modifications were analyzed using the Glycan Mapping and HILIC-Z column (Figure 7). The results showed both columns yielded a sharp peak for the ASO, with the Glycan Mapping column having better sensitivity relative to the HILIC-Z column (Figure 7a). As expected, the Glycan Mapping also showed a broader charge state distribution with 8-charge state being detected. In contrast, the HILIC-Z column’s highest charge state detected was 6- for the ASO (Figure 7b). Lastly, the ASO’s identity was confirmed through the deconvoluted mass spectra from both experiments (Figure 7c).

Figure 7: Comparison of the Glycan Mapping and HILIC-Z columns for characterization of an 18-mer antisense oligonucleotide.
Summary
In this study, we have systematically evaluated five different HILIC stationary phases with the Tanaka test to help understand how the different functional groups contribute to different HILIC retention characteristics. It’s clear that the attributes assessed with the small molecule probes don’t exactly translate to the larger, more structurally complex molecules such as oligonucleotides. However, it was still insightful to understand the differences among the HILIC stationary phases. As part of our method development, we then aimed to optimize the mobile phase pH to yield better chromatographic peak shape, resolution, and MS signal for several oligonucleotide samples. We found that use of different mobile phase pH conditions can impact the charge state distribution of the analyte, which may be considered when working with longer oligonucleotides. The methods developed ultimately facilitated the LC–MS analysis of a heavily modified ASO. Our work confirms that HILIC chromatography serves as an approach that can be an attractive alternative to IP-RPLC for the analytical characterization of oligonucleotides. The methods could be applied to other exciting and growing oligonucleotide modalities including siRNA, aptamer, single-stranded guide RNA (sgRNA), and mRNA sequencing in the future.
References
(1) El Zahar, N. M.; Magdy, N.; El-Kosasy, A. M.; Bartlett, M. G. Chromatographic Approaches for the Characterization and Quality Control of Therapeutic Oligonucleotide Impurities. Biomed Chromatogr. 2018, 32 (1). DOI: 10.1002/bmc.4088
(2) Goyon, A.; Yehl, P.; Zhang, K. Characterization of Therapeutic Oligonucleotides by Liquid Chromatography. J. Pharm. Biomed. Anal. 2020, 182, 113105. DOI: 10.1016/j.jpba.2020.113105
(3) Roussis, S. G.; Koch, C.; Capaldi, D.; Rentel, C. Rapid Oligonucleotide Drug Impurity Determination by Direct Spectral Comparison of Ion-Pair Reversed-Phase High-Performance Liquid Chromatography Electrospray Ionization Mass Spectrometry Data. Rapid Commun. Mass Spectrom. 2018, 32 (14), 1099–1106. DOI: 10.1002/rcm.8125
(4) Dalmijn, J.; Glüge, J.; Scheringer, M.; Cousins, I. T. Emission Inventory of PFASs and Other Fluorinated Organic Substances for the Fluoropolymer Production Industry in Europe. Environ. Sci. Process Impacts 2024, 26 (2), 269–287. DOI: 10.1039/d3em00426k
(5) Lardeux, H.; Guillarme, D.; D’Atri, V. Comprehensive Evaluation of Zwitterionic Hydrophilic Liquid Chromatography Stationary Phases for Oligonucleotide Characterization. J. Chromatogr. A 2023, 1690, 463785. DOI: 10.1016/j.chroma.2023.463785
(6) Kawachi, Y.; Ikegami, T.; Takubo, H.; Ikegami, Y.; Miyamoto, M. Tananka, N. Chromatographic Characterization of Hydrophilic Interaction Liquid Chromatography Stationary Phases: Hydrophilicity, Charge Effects, Structural Selectivity, and Separation Efficiency. J. Chromatogr. A 2011, 1218, 5903–5919. DOI: 10.1016/j.chroma.2011.06.048
(7) Ikegami, T.; Taniguchi, A.; Okada, T.; Horie, K.; Arase, S.; Ikegami, Y. Functionalization Using Polymer or Silane? A Practical Test Method to Characterize Hydrophilic Interaction Chromatography Phases in Terms of Their Functionalization Method. J. Chromatogr. A 2021, 1638, 461850. DOI: 10.1016/j.chroma.2020.461850
(8) Apffel, A.; Chakel, J. A.; Fischer, S.; Lichtenwalter, K.; Hancock. W.
S. New Procedure for the Use of High-Performance Liquid Chromatography–Electrospray Ionization Mass Spectrometry for the Analysis of Nucleotides and Oligonucleotides. J. Chromatogr. A 1997, 777, 3–21. DOI: 10.1016/S0021-9673(97)00256-2
(9) Guimaraes, G. J.; Bartlett. M. G. The Critical Role of Mobile Phase pH in the Performance of Oligonucleotide Ion-Pair Liquid Chromatography–Mass Spectrometry Methods. Future Sci. OA 2021, 7 (10), FSO753. DOI: 10.2144/fsoa-2021-0084
(10) Wei, T.; Van de Bittner, G. C.; Kennedy, A. P.; Hsiao, J. J. The Use of HILIC Zwitterionic Phase Superficially Porous Particles for Metabolomics Analysis. LCGC Supplements 2018, 36 (6), 30–35.
(11) Temsamani, J.; Kubert, M.; Agrawal, S. Sequence Identity of the n-1 Product of a Synthetic Oligonucleotide. Nucleic Acids Res. 1995, 23 (11), 1841–1844. DOI: 10.1093/nar/23.11.1841
(12) Fearon, K. L.; Stults, J. T.; Bergot, B. J.; Christensen, L. M.; Raible, A. M. Investigation of the ‘n–1’ Impurity in Phosphorothioate Oligodeoxynucleotides Synthesized by the Solid-Phase β-cyanoethyl Phosphoramidite Method Using Stepwise Sulfurization. Nucleic Acids Res. 1995, 23 (14), 2754–2761. DOI: 10.1093/nar/23.14.2754
About the Authors
Jordy J. Hsiao, Lee J. Bertram, Alex Apffel, Andrea Angelo P. Tripodi, Andrew Coffey, Ta-Chen Wei, and Connor Flannery are with Agilent Technologies.


Polysorbate Quantification and Degradation Analysis via LC and Charged Aerosol Detection
April 9th 2025Scientists from ThermoFisher Scientific published a review article in the Journal of Chromatography A that provided an overview of HPLC analysis using charged aerosol detection can help with polysorbate quantification.


Removing Double-Stranded RNA Impurities Using Chromatography
April 8th 2025Researchers from Agency for Science, Technology and Research in Singapore recently published a review article exploring how chromatography can be used to remove double-stranded RNA impurities during mRNA therapeutics production.


