Synthesis Monitoring and Oligomeric Analysis of PEGylated Polymers
New roles and applications in the areas of science and technology are continuously being found for synthetic polymers. Specifically, the use of synthetic polymers in medicine is growing, as these polymers offer unique and versatile platforms for applications such as implants, medical devices, surgical adhesives, drug delivery vesicles, and injectable polymer-drug conjugates (1,2). As the applications of synthetic polymers increases, there is a manifested need for methods to accurately and precisely characterize the materials.
New roles and applications in the areas of science and technology are continuously being found for synthetic polymers. Specifically, the use of synthetic polymers in medicine is growing, as these polymers offer unique and versatile platforms for applications such as implants, medical devices, surgical adhesives, drug delivery vesicles, and injectable polymer-drug conjugates (1,2). As the applications of synthetic polymers increases, there is a manifested need for methods to accurately and precisely characterize the materials.
One of the most common and valuable tools employed for the analysis and characterization of polymers is size exclusion chromatography (SEC or gel permeation chromatography, GPC). The principle use of SEC, even a half-century after its inception, remains as determining the molar mass averages and distributions of natural and synthetic polymers through the application of calibration curves (3). The applicability of SEC for synthetic polymers also extends into the realms of synthesis monitoring and oligomeric quantification. Synthesis monitoring using SEC not only allows for separation of polymeric material based on size but also provides information about the reactions, e.g., did the reaction go to completion, is the product uniform in terms of molar mass or size, did a by-product form, etc. Oligomeric SEC plays an important role in the quantification of oligomeric content (i.e., low-molar mass species) of a polymer sample for the purposes of pre-manufacture notification (PMN) regulations for new chemical substances as well as import and export purposes (3).
The utility of SEC for synthesis monitoring and oligomeric analysis makes it an invaluable tool for characterizing synthetic polymeric material for use in medicine, as these materials require thorough characterization amongst other validations. Here we report on the use of an all-in-one dedicated GPC system, the EcoSEC® GPC System, to monitor the synthesis and to quantify the oligomeric content of two PEGylated synthetic polymers intended for use in medical applications.
Experimental Conditions
Sample analysis was performed on a system consisting of an EcoSEC GPC System (HLC-8320) equipped with a refractive index detector (RI). Separation of unfiltered 40 μL injections occurred over a column bank consisting of two 6.0 mm i.d. × 15 cm, 3 μm particle size TSKgel® SuperH3000 columns (exclusion limit 60,000 g/mol) preceded by the appropriate guard column (Tosoh Bioscience LLC). The solvent and mobile phase were tetrahydrofuran (THF) (Fisher Chemical) at a flow rate of 0.3 mL/min. Detector, pump oven, and column oven were maintained at 35 °C. Two PEGylated polymers and a starting material were analyzed: PEG-A, PEG-B and starting material C, respectively. For all chromatographic determinations, results are averages of three injections from two separate sample solutions. Sample solutions were prepared by diluting the sample (98% purity) with THF for a final sample concentration of approximately 10 to 15 mg/mL. Samples were shaken manually for a minute and allowed to sit for 3 h before analysis was performed. Data was processed with the EcoSEC GPC Workstation Software version 1.08.
A calibration curve was created using PStQuick Kit-L polystyrene standards (Tosoh Bioscience LLC) ranging in molar mass from 266 to 37,900 g/mol. Calibration curve data was fitted with a cubic function and error values were less than 5%.
Results and Discussion
As described above, an EcoSEC GPC System equipped with an internal dual-flow refractive index (RI) detector was used for the characterization of two PEGylated polymers. The detector response of the RI detector was used to monitor the synthesis of the formation of the two PEGylated polymers and to compare the chromatograms of both materials to that of one of the starting materials. Additionally, a polystyrene relative calibration curve was used to determine the peak-average molar masses Mp and the oligomeric content of the two samples.
Synthesis Monitoring
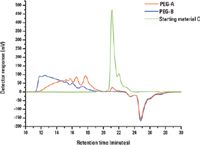
SEC is an ideal tool for monitoring the formation of PEGylated polymers, as the method separates the polymers based on size while simultaneously providing information about the molar mass of the newly synthesized species. The two polymers analyzed here, PEG-A and PEG-B, are composed of the same basic components which vary in molar mass between the two samples. The molar mass difference of the starting material of PEG-A and PEG-B is reflected in the end-products, as PEG-A and PEG-B produce different chromatograms when separated by SEC, Figure 1.

Figure 1: Synthesis monitoring by SEC. SEC elution profile of PEG-A (red), PEG-B (blue), and starting material C (green) as monitored by RI.
The ability to identify all species within the PEGylated sample is essential in the validation of polymers intended for medical applications. Thus, the role of synthesis monitoring here is not only to compare the difference between the two species produced from similar procedures but to compare the two species to the starting material(s). As seen in Figure 1, by comparing the SEC chromatograms of starting material C with that of PEG-A and PEG-B, a fairly substantial amount of starting material C remains in PEG-A while all of starting material C has reacted in PEG-B.

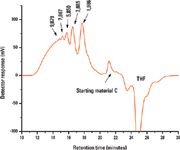
Figure 2: SEC analysis of PEG-A as monitored by RI. Numbers on graph represent polystyrene relative peak-average molar mass Mp values of each mode.
Oligomeric Analysis
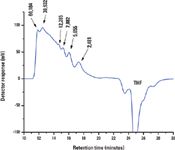
The characterization of the oligomers present in the PEGylated samples is best achieved by the peak-average molar mass Mp. The polystyrene relative peak-average molar mass values for each mode in the chromatograms for the PEG-A and PEG-B samples are given in Figures 2 and 3, respectively. The values for the peak-average molar mass between the two samples differ significantly. The Mp values of PEG-A range from approximately 2000 to 10,000 g/mol indicating that most, if not all, of the species present are oligomeric in nature. Conversely, the Mp values of PEG-B range from approximately 2500 to 60,000 g/mol indicating that low- and high-molar mass species are present.

Figure 3: SEC analysis of PEG-B as monitored by RI. Numbers on graph represent polystyrene relative peak-average molar mass Mp values of each mode.
Conclusions
The EcoSEC GPC System was used for synthesis monitoring and oligomeric content analysis. The synthesis process for two PEGylated synthetic polymers intended for use in medical applications was analyzed by comparing the SEC chromatograms of the two PEGylated polymers with that of one of the starting materials. From this comparison it was concluded that starting material remained in one of the PEGylated samples, PEG-A, and was absent in the other PEGylated sample, PEG-B. The SEC chromatograms of the PEGylated polymers also provided indication of differences in the molar mass distribution between the two PEGylated samples. Additionally, based on the peak-average molar masses Mp the oligomeric content of the two PEGylated polymers were shown to differ, with PEG-A containing mainly oligomeric species and PEG-B containing both low- and high-molar mass species. Combining the oligomeric content information with the SEC chromatograms was shown to provide a more detailed picture about the distribution of the low-molar mass species within the two PEGylated samples, information beneficial in the validation and regulation of synthetic polymers. Finally, the advanced engineering design of the EcoSEC GPC System, e.g., low-dead volume, minimal extra-column band broadening, etc., is an added advantage of using the system for synthesis monitoring and oligomeric analysis as it provides increased resolution and separation efficiency in the oligomeric region compared to traditional GPC systems.
References
(1) M.J. Jorealemon, S. McRae, and T. Emrick, Chem. Commun. 46, 1377–1393 (2010).
(2) A.K. Brewer and A.M. Striegel, Anal. Bioanal. Chem. 399, 1507–1514 (2011).
(3) A.M. Striegel, W.W. Yau, J.J. Kirkland, and D.D. Bly, Modern Size-Exclusion Chromatography 2nd Ed. (Wiley, New York, New York, 2009).
Tosoh Bioscience, EcoSEC and TSKgel are registered trademarks of Tosoh Corporation.
Tosoh Bioscience LLC
3604 Horizon Drive, Suite 100, King of Prussia, PA 19406
tel. (484) 805-1219, fax (610) 272-3028
Website: www.tosohbioscience.com

SEC-MALS of Antibody Therapeutics—A Robust Method for In-Depth Sample Characterization
June 1st 2022Monoclonal antibodies (mAbs) are effective therapeutics for cancers, auto-immune diseases, viral infections, and other diseases. Recent developments in antibody therapeutics aim to add more specific binding regions (bi- and multi-specificity) to increase their effectiveness and/or to downsize the molecule to the specific binding regions (for example, scFv or Fab fragment) to achieve better penetration of the tissue. As the molecule gets more complex, the possible high and low molecular weight (H/LMW) impurities become more complex, too. In order to accurately analyze the various species, more advanced detection than ultraviolet (UV) is required to characterize a mAb sample.


