Static Headspace GC–MS Detection of Residual Solvents—A Possible Simultaneous Identification and Quantitation Method
LCGC North America
A new procedure is proposed that provides identity parameters for headspace-applicable residual solvent Class 1 and Class 2 compounds addressed in the current US Pharmacopeia <467> method.
The current US Pharmacopeia (USP) general chapter "Residual Solvents" <467> uses flame ionization detection for two identification procedures and one quantitation procedure. This article reports on the development and validation of a single gas chromatography–mass spectrometry (GC–MS) procedure that provides identity parameters for headspace-applicable residual solvent Class 1 and Class 2 compounds addressed in the current <467> method. It also provides validation for quantitation of all Class 2 residual solvents capable of being analyzed by headspace. This procedure shortens analysis time, combines the two identification procedures with one quantitation procedure, and modifies system suitability requirements but still uses an external standard. This GC–MS procedure is an effective identification test, but presents challenges in quantifying residual solvents below their concentration limits. This article does not address known problems in sample preparation, but presents interim progress in detection that may contribute to a revision of <467>.
Organic volatile impurities, commonly known as residual solvents, are used or produced in the manufacturing processes of drug substances, excipients, and drug products (1). Residual solvents serve no therapeutic use and should be removed to the highest extent possible. Those that are not removed should be limited below prescribed concentrations (2). These often are measured using methods described in US Pharmacopeia's (USP) current general chapter "Residual Solvents" <467> (1).

"Residual Solvents" <467> involves a three-step process for identifying and quantifying known residual solvents in pharmaceuticals (1). The chapter provides classification lists for three types of residual solvents and concentration limits expressed in parts per million (ppm) for Class 1, Class 2, and Class 3 residual solvents. Chapter <467> provides a stepwise process for evaluating Class 1 and Class 2 residual solvents based on the solubility of the material being tested. Class 2 residual solvents that cannot be evaluated by headspace analysis are not discussed here, or in the chapter. The general chapter provides sample preparations that include stepwise dilutions for reference standards and samples in which the concentration of the final dilution, before diluting into the headspace vial, is at the residual solvents' allowed concentration limits. For this article, the residual solvents' concentration limits are named the 100% limit concentration. The <467> procedures also include solution preparation information, gas chromatography with flame ionization detection (GC–FID) parameters, headspace parameters, system suitability requirements, and quantitation calculations based on sample findings. Although the evaluation and preparation methods have undergone many revisions, the chapter still has drawbacks (3). For example, instrument evaluation time is extensive because two separate instrumental methods and specific columns are needed to achieve residual solvent resolution in the current <467> GC–FID method; the multistep dilutions used for sample preparations are prone to residual solvent loss; and the system suitability tests require Class 1 residual solvents that have the most safety and health hazards (4). Many people have informed USP that the Class 1 residual solvents required are the most hazardous chemicals used in their laboratories and that they would like to avoid these kinds of health and safety hazards. This article reports the incorporation of time-saving mass spectrometry (MS) detection that may reduce the identification analyses from two method parameter sets to one and a way to reduce the need for Class 1 compounds in establishing system suitability. The changes presented here could be considered for inclusion in United States Pharmacopeia–National Formulary (USP–NF), but would not necessarily replace the current FID method. Of course, all additions and changes are subject to public comment.
MS detection provides better selectivity than FID because it combines spectral and chromatographic identification (5,6). Unique mass spectra often eliminate resolution requirements. Residual solvents could be orthogonally identified spectrally or chromatographically, allowing for the identification of coeluted compounds and, thereby, removing chromatographic resolution requirements (1,7). This takes advantage of the compound specificity of MS and decreases the analysis times. The change of detector may be suitable for inclusion in USP's method for evaluation of residual solvents. Presented here is the method development and validation of a possible MS method that does not include Class 1 residual solvents in system suitability. The current <467> GC–FID method requires the use of Class 1 residual solvents to meet system suitability. Parameter settings for this study were initially based on <467> for sample preparations and GC parameters and an Agilent (Santa Clara, California) technical publication (8) for MS parameters. Scan mode spectra were selected based on quantifying and qualifying ions, and combinations of one or two qualifying ions were used to ensure that the proper residual solvent was identified. After it was identified, typically the most abundant ion was selected for quantitation. When spectra did not have unique spectral patterns, chromatographic separation was sufficient for identification.
This article does not address known problems in sample preparation, but presents interim progress in detection that may contribute to a revision of <467>.
Experimental
Chemicals
We used the following chemicals: USP Residual Solvents Mixture–Class 1 Reference Standard, USP Residual Solvents Class 2–Mixture A Reference Standard, USP Residual Solvents Class 2–Mixture B Reference Standard, USP Residual Solvents Class 2–Methanol Reference Standard, USP Residual Solvents Class 2–Methylene Chloride Reference Standard, USP Residual Solvents Class 2–Tetralin Reference Standard, USP Residual Solvents Class 2–Chloroform Reference Standard, USP Residual Solvents Class 1–1,1,1,-Trichloroethane Reference Standard, USP Residual Solvents Class 2–Nitromethane Reference Standard (United States Pharmacopeia, Rockville, Maryland); organic-free water, high performance liquid chromatography (HPLC) grade (Fisher Scientific, Waltham, Massachusetts); dimethyl sulfoxide (DMSO), 99.9% for spectroscopy (Acros, Waltham Massachusetts); hydroxyzine dihydrochloride, 13C7-toluene (Sigma, St. Louis, Missouri); sucrose (Mutchler, Harrington Park, New Jersey); helium, ultrahigh-purity carrier grade (Roberts Oxygen, Rockville, Maryland); nitrogen, nitrogen generator model UHPN2-1100, ultrahigh-purity grade (Parker Balston, Haverhill, Massachusetts); as well as air and hydrogen used for FID. Helium and nitrogen were used to maintain the syringe-style headspace injector.
Equipment and materials
We used the following equipment and materials: a model 6890N gas chromatograph equipped with a model 5973 MSD detector and MSD ChemStation data processing software Revision D.01.00 or MSD ChemStation E.02.00.493, a model 7694 headspace sampler (loop size 1 mL), and a 4-mm split, taper, low-pressure-drop glass wool GC liner (all from Agilent); MiniTab 15.1.0.0 software (MiniTab 15, Mathis, 2006 Minitab Inc., State College, Pennsylvania), a CombiPAL autosampler (CTC Analytics, Zwinger, Switzerland); a model UHPN2-1100 nitrogen generator; and a 30 m × 0.25 mm, 1.4-μm film thickness DB-624 capillary GC column (Agilent) (Table I). Note: USP is certified to ISO 9001 and ISO 17025, and all equipment used in this study was qualified by an approved service engineer.

Table I: Finalized instrument parameters
Methods
Method Development Parameters
The current <467> water-soluble headspace parameters and an Agilent technical publication were used as a starting point (1,8). Individual adjustments to headspace oven temperature, vial equilibration time, and vial pressure were made to accommodate the selected headspace instrument type. All method development testing used a single mixture containing USP Residual Solvent Mixture–Class 1 Reference Standard, USP Residual Solvents Class 2–Mixture A Reference Standard, and USP Residual Solvent Class 2–Mixture B Reference Standard diluted to the 100% concentration level for each residual solvent. This solution was called the "100% All Mixture Solution." In all cases, 100% limit concentrations were used, unless otherwise stated. The parameters were chosen based on the headspace parameters that gave the best results for the majority of the residual solvents under consideration (Table I).
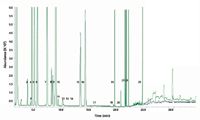
Figure 1: 5:1 split ratio total ion chromatogram.
Iterative GC changes were made to parameters based on the original <467> water-soluble settings (1). GC oven program, run time, injector temperature, and split ratio were examined. Again, final parameters were determined based on the best-case scenario for the majority of residual solvents under consideration when examining the total ion current (TIC) and associated spectra (Figure 1). In the same way, final MS parameters were established by performing iterative changes to determine the best possible solvent cutoff and scan region. Based on library spectra and historical relative retention times of the residual solvents under test, unique ions were identified. Those that did not have unique patterns were often distinguishable by their retention time. From this information, analysts chose quantifying and qualifying ions (Table II). To exclusively identify each peak in the TIC, first peaks were matched to the library spectra, and if analysts did not find a match, then they made an individual injection of each missing residual solvent. The retention times were used to identify peaks, and then their spectra were compared, particularly in the cases of methanol and nitromethane. When analysts found obvious TIC coelutions, the differing spectra were easily identified and filtered. These were compared to the library and TIC retention times to provide identification (Figures 2 and 3). For example, 1,2-dichloroethane and carbon tetrachloride were coeluted but had clear spectral differences.
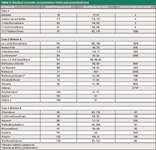
Table II: Residual solvents: concentration limits and associated ions
Method Development: Preliminary Linearity Investigation
The higher concentrated residual solvents were measured at a 50:1 split ratio, and less-concentrated solvents were measured at a 5:1 split ratio. The samples, consisting of all Class 1, 2A, and 2B residual solvents, were prepared and run at each split ratio. Concentrations of 25%, 50%, 60%, 75%, 100%, 120%, 150%, and 200% were examined at the 5:1 split ratio. Concentrations of 25%, 50%, 100%, and 200% were examined at the 50:1 split ratio (Table II).
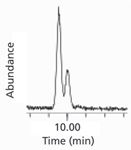
Figure 2: 5:1 split ratio total ion chromatogram of spectrally separated compounds.
Method Development: Preliminary Recovery Study
Using hydroxyzine dihydrochloride as a water-soluble active pharmaceutical ingredient (API), analysts selected residual solvents and spiked them into prepared solutions and measured the differences in recoveries. Acetonitrile and benzene were spiked in solutions containing API and were compared to API solutions that did not contain residual solvents. Each was 100% of the individual residual solvent's limit concentration.

Figure 3: 5:1 split ratio total ion chromatogram of chromatographically separated compounds.
Method Development: Establishing System Suitability
Generally, chromatographic system suitability, such as repeatability, is not used with MS because internal standards typically are used to monitor system changes. Because of the large number of residual solvents undergoing simultaneous study, no one internal standard was found suitable for use. Instead, peaks that had the smallest peak response at the specified split ratio were evaluated. For the 5:1 split ratio 1,2-dimethoxyethane, 1,4-dioxane, nitromethane, pyridine, carbon tetrachloride, and 1,2-dichloroethane were investigated. For the 50:1 split ratio, toluene, methylcyclohexane, and chloroform signal-to-noise ratios were examined. In each case, a signal-to-noise ratio of 3 or higher in the TIC scan was desired to establish sufficient suitability to identify all residual solvents being tested.
Method Validation: Identification Specificity
To determine specificity, analysts examined the mass spectral patterns of each residual solvent to identify unique qualifying and quantifying ions. When unique ion patterns could not be identified, the chromatographic retention time was used as an identifier. In some cases where a chromatographic coelution was observed, the selected ion used for quantification was selected based on a best match to a known spectrum for that residual solvent (Table II).
Method Validation: Robustness
For the GC–MS parameters, a partial factorial design (two replicates of a 12-run design) was generated using Design Expert 7 (Stat-Ease, Inc., Minneapolis, Minnesota) for the robustness investigation. The design was chosen so that the four main effects were not confounded with each other or with two-factor interactions. The "100% All Mixture Solutions" were injected and analyzed for each of the 24 runs. Each of the four factors were analyzed to determine which of the parameters most affected the analysis method, and experimental values are shown in Table III. Singlet parameter changes were conducted to investigate the headspace robustness because the equipment used was manually operated.

Table III: Robustness experimental extreme values
Method Validation: Linearity, Recovery, Range, Accuracy, Precision, Stability, Limit of Detection, Limit of Quantitation, and Quantitation Specificity
Two extensive studies were performed to establish the method's linearity, recovery, range, accuracy, precision, stability, limit of detection (LOD), limit of quantitation (LOQ), and quantitative specificity. One of the studies was for the 5:1 split ratio and the other for the 50:1 split ratio. In both cases, 9–15 data points were collected for each of the following concentrations: 50%, 75%, 100%, 150%, 200%, 225%, and 250%. All data were fit using a linear least squares model to assess linearity of response-concentration, and quantitative specificity, as well as LOD and LOQ. Analysts determined repeatability precisions by pooling intraday results across days; they averaged percent recovery over days; and they based confidence intervals on interday variability. To determine stability, one preparation at the 100% limit concentration was injected multiple times, from fresh vials, during a 36-h period. All preparations were made from USP Residual Solvents Class 2–Mixture A Reference Standard and USP Residual Solvent Class 2–Mixture B Reference Standard. To determine LOD and LOQ, the following equations (2) were applied to the regression information (note that no background subtraction was conducted for any results or evaluations):
LOD = 3.3 (residual SD of linear regression)/slope of regression line [1]
LOQ = 10 (residual SD of linear regression)/slope of regression line [2]
Method Validation: Recovery in the Presence of APIs by FID and MS
In this series of experiments, the <467> FID Procedure A water-soluble parameters were used to compare residual solvent recoveries to MS residual solvent recoveries in the presence of APIs or excipients. Four residual solvents were spiked and contaminated at given limit concentrations. Solutions of sucrose and hydroxyzine dihydrochloride were used as matrices. The residual solvents considered were methanol, methylene chloride, tetralin, and chloroform. Contaminated solutions contained 100% concentrations of all four. Test solutions were spiked with an additional 50% limit concentration of individual residual solvents. To measure the FID recoveries, we compared individual spiked solutions to contaminated solutions. For MS, all solvents were spiked simultaneously and were measured compared to the contaminated solutions. The percent recoveries found for each detector were compared.
Method Validation: Ruggedness
To test this method's ruggedness, analysts used the recovery experiments described in the section above for MS and examined the variables of analyst, system, and column. Ruggedness was determined between each variable. All the other steps in this investigation used the transfer-line style headspace unit, but this step used a syringe-style headspace unit for comparison.
Results and Discussion
Method Development Parameters
Headspace parameters from the existing <467> FID method were used as a starting point. The temperature, equilibration, and vial pressure were examined using a mixture containing all residual solvents being tested at their limit concentrations. First, various oven temperatures were examined for the headspace. In each case, the loop temperature was kept 5° higher and transfer-line temperatures were kept 10° higher than the oven temperature, for convenience. The examination started with the oven temperature at 80 °C and was incrementally adjusted up to 100 °C. There was no obvious advantage from changing the headspace oven temperature, and all the residual solvents in the mixture were observed. However, as the temperature was increased, the TIC baseline rose. We hypothesize that this was caused by the vapor pressure of water. Therefore, the 80 °C temperature was retained from the FID method, and the loop and transfer-line temperatures were then set at 82 °C and 85 °C, respectively.
Next, we examined the vial equilibration time using equilibration times of 15 and 30 min instead of <467> requirements of 45–60 min. No notable changes were found in the TIC appearances for all residual solvents under consideration, and their TICs did not reveal a significant difference between equilibration times. From this point on, we selected 30 min to maintain ease in run time agreement with the GC settings. Still, the equilibration was shortened.
Also, vial pressure settings of 5, 10, 15, 20, and 25 psi were examined to determine how pressure affected the repeatability and response of the residual solvents. Actual measured pressures by headspace equipment were 3.9, 8.1, 13.6, 18.5, and 23.4 psi, respectively. All compounds were identified regardless of pressure. A vial pressure of 5 psi appeared to give the highest and sharpest TIC peak shapes, but the injection-to-injection peak shape was inconsistent. At 10 psi, TICs were more reproducible but at a slight expense of degradation in peak shape. As the vial pressures were increased, the peak shapes further degraded. Therefore, we concluded that a setting of 10 psi for the vial pressure was the best tradeoff between repeatability and response.
As a starting point, the current <467> procedure A parameters and the Agilent publication (8) were used to examine the GC split ratio, inlet temperature, and oven program. Various injection split ratios were examined, from 3:1 up to 25:1, to explore the dynamic range of MS as well as to meet recovery requirements. Throughout the TIC comparisons the peak shape and resolution were best for the 10:1 split ratio. However, after multiple injections some of the lower-concentration residual solvents, such as 1,4-dioxane and 1,2-dimethoxyethane, were indistinguishable from the baseline. Therefore, the 5:1 split ratio was chosen to ensure residual solvent sensitivity. A much higher split ratio of 50:1 was necessary to improve recovery for highly concentrated residual solvents like trichloroethylene and toluene. The 50:1 ratio was chosen based on substantial dilutions to minimize overwhelming the detector. The two split ratios, 5:1 and 50:1, provided two ways to examine residual solvents, accounting for their wide range of limit concentrations.
Another parameter investigated was the GC inlet temperature. To ensure that no injection condensation takes place in the inlet, its temperature should be higher than the transfer line. Injection temperatures of 140 °C and 160 °C were examined, and 160 °C gave the best TIC peak shape and ion response.
The GC oven program was modified with the goals of shortening the run time compared to <467> and maintaining acceptable residual solvent TIC peak shapes. The final settings were held at 35 °C for 17 min; ramped from 35 °C to 240 °C at 25 °C/min; and held for 10 min at 240 °C. However, after analysts installed a new column, pyridine and toluene were eluted as the oven ramped, and pyridine could be neither detected chromatographically nor resolved from toluene spectrally. As a result, the initial hold time was extended to 20 min, and the final run time was increased from 35 to 38 min. Further attempts to change the oven program were hampered by a loss of residual solvent retention. The new method cuts the run time almost in half compared to the current <467> procedures.
The main parameters adjusted for MS detection were solvent cutoff and scan range. All other parameters were left at their default settings, including the electron ionization of 70 eV. To ensure all compounds were scanned, the scan range was set at 20–200 amu. The low starting mass enabled spectra for acetonitrile and methanol to be collected, and the upper end was adequate to detect all the quantitative and qualifying ions because the residual solvent compounds have relatively low molecular masses. The solvent cutoff was set at 1.8 min. Retention times shifted when the column was changed, so the cutoff was moved to 1.5 min. The settings in Table I were optimal for collecting spectra for their intended purpose. No additional run time savings were expected by changing other MS detection parameters, and accordingly none were changed.
Each residual solvent being tested was investigated for unique ion patterns. With the exception of the xylenes, the spectra of which were identical with varying intensities, most were determined to have at least one unique ion. However, the chromatographic column was selected so that xylenes had different retention times. In this manner, effective identification and quantitation were accomplished using a quantifying ion or TIC in a single run.
The combination of headspace, GC, and MS changes enabled a faster analysis for identifying residual solvents compared to the current <467>. Using the unique solvent ions enabled quantitation and identification in one analytical run.
Method Development: Preliminary Linearity Investigation
To examine the linear range of the residual solvents in conjunction with the parameters identified above, analysts prepared various concentrations of a mixture containing all Class 1, 2A, and 2B residual solvents, as listed by class in Table II. These were injected at 25%, 50%, 60%, 75%, 100%, 120%, and 150% of the residual solvents' limit concentration, where 100% was the limit concentration. Most r2 values for the Class 2 compounds were found to be above 0.9 except for the hexane-related compounds. The hexane-related compounds of cyclohexane, ethylbenzene, hexane, methylcyclohexane, and 1,2-dimethoxyethane showed r2 values ranging from 0.6 to 0.9 for the 5:1 split ratio and 0.3 to 0.9 for the 50:1 split ratio. The r2 analysis runs were not conducted at the 50:1 split ratio for the Class 1 compounds because most of their concentrations were too low to detect using that parameter. The r2 values for Class 1 compounds ranged from 0.2 to 0.6 in the 5:1 split ratio examination. Linearity results seem to be influenced the most by sample preparation and differences in compound volatility. Differences may be related to sample preparation as well, although this possibility was not investigated here. To reduce the concentration limit differences and the number of compounds tested in validation examinations, the Class 1 residual solvent compounds were not included.
Method Development: Preliminary Recovery Study
To examine the newly established GC–MS parameters, analysts examined selected residual solvents (acetonitrile and benzene) in the presence an API (hydroxyzine dihydrochloride) and an excipient (sucrose). Solutions containing acetonitrile were prepared with the addition of 10 mL of DMSO and recovered between 343 and 371 ppm; preparations without the DMSO recovered between 369 and 420 ppm. The expected recovery was 410 ppm. Benzene was recovered between 1.9 and 2.8 ppm when samples were prepared with 10 mL of DMSO in the first dilution and recovered more than 8 ppm when DMSO was not included in sample preparation. The expected recovery was 2 ppm. Clearly, sample preparation and the inclusion of DMSO influence residual solvent recovery. Headspace competition may be lowered by DMSO, or DMSO may help retain certain residual solvents during solution dilutions. As with other studies, this research shows that residual solvents have different expansion coefficients in the headspace (3,9,10). In this case, the expansion coefficient is considered to be the area that a residual solvent occupies in the headspace vial. Depending on their concentrations, the greater the number of residual solvents in a sample the more likely recovery will be influenced. For validation, DMSO was not involved in preparation, and only Class 2 preparations were examined.
Method Development: Establishing System Suitability
Generally, system suitabilities of chromatographic parameters, such as repeatability or resolution, are not used for MS. Often, an internal standard is used to gauge changes. A deuterated residual solvent was considered as an internal standard. However, its inclusion in water-soluble procedures from <467> was not possible because of the dissociative behavior of deuterated compounds. 13C7-toluene was investigated as another alternative. Although it has a unique spectrum and detected sample preparation fluctuations, it did not provide sufficient stability to be an internal standard. No single internal standard could cover the whole range of possible residual solvent concentrations or types. Also, very few 13C versions of these compounds are readily available commercially, and having an internal standard for each residual solvent is not viable. Therefore, we found no single internal standard appropriate for all the compounds tested. Because this project was based on external calibrations rather than an internal standard, a chromatographic parameter for system suitability was chosen. In this case, a signal-to-noise ratio of 3 was defined as the system suitability criterion.
Specific residual solvent compounds were identified at each split ratio and were used to determine the signal-to-noise ratios in the TIC for all residual Class 1 and Class 2 solvents. Initially, all compounds met the criterion of signal-to-noise ratio greater than 3. At the 50:1 split ratio, residual solvents with signal-to-noise ratios below 3 were not considered but were sufficient for examination under the 5:1 split ratio. For these analyses, researchers used the "All Mixture Solution" containing Class 1 and Class 2 residuals solvents at their concentration limit.
As experiments progressed, signal-to-noise ratios for 1,2-dimethoxyethane and 1,2-dioxane decreased below a signal-to-noise ratio of 3 for the 5:1 split ratio. However, the peaks of interest such as methanol, tetralin, chloroform, and methylene chloride (during recovery and ruggedness studies) had signal-to-noise ratios above 3. For future applications of these procedures, system suitability should include injecting the residual solvents of interest at their limit concentrations to ensure a signal-to-noise ratio above 3 is obtained. For the validation, all residual solvents tested met signal-to-noise ratios greater than 3. In all cases where the signal-to-noise ratio was calculated, no baseline subtraction was considered.
Method Validation: Identification Specificity
Table II shows the unique quantifying and qualifying ions for each residual solvent. The ions were selected using spectra found in the Wiley library (11). In some cases, spectra were similar and the library match could not differentiate them. Therefore, knowledge of the retention time was necessary for unambiguous identification. To differentiate the configurational isomers of xylenes from ethylbenzene, analysts found that retention times were the only positive identification strategy. The xylene isomers were not confirmed because limits are based on additive concentrations of xylenes.
Method Validation: Robustness
Iterative changes were conducted to test the robustness of this proposed method. For the headspace, ±5% changes in headspace oven temperature and variations in sample preparation displayed the greatest differences between ion recoveries. For the GC iterations, flow rates and start temperatures had the most influence. These suggest that the parameter changes to this system yield results that are less robust than is ideal for most chromatographic analyses.
Method Validation: Linearity, Recovery, Range, Accuracy, Precision, Stability, Limit of Detection, Limit of Quantitation, and Quantitation Specificity
All results and recoveries were deduced from scan mode. Initial investigations into selected ion monitoring (SIM) did not yield significant advantages in percent recovery of known residual solvent concentrations, increased accuracy, or precision when creating an effective screening method. The equipment used for this study did not allow simultaneous SIM and scan mode analyses, so we did not satisfy our goal of decreasing analyses from two methods. Further evaluations using SIM may prove beneficial, but were not within the scope of this work.
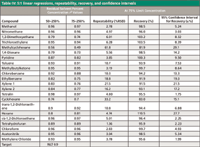
Table IV: 5:1 linear regressions, repeatability, recovery, and confidence intervals
To establish linearity, recovery, range, accuracy, precision, stability, LOD, LOQ, and quantitation specificity we collected data during three to five days for each compound at seven limit concentrations ranging from 50% to 250%. From these data, we applied linearity regression statistics to support accuracy, precision, LOD, LOQ, and quantitative specificity. Most of the r2 values obtained at each split ratio were above 0.9, except for the hexane-related compounds, as found in Tables IV and V.
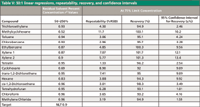
Table V: 50:1 linear regressions, repeatability, recovery, and confidence intervals
The range of each residual solvent was based on recovery data at each limit concentration. The residual solvents tended to recover within 15% of the expected limit concentration for the limits between 75% and 250%. This trend was observed for both split ratios. The hexane-related compounds were less likely to be recovered within 15% of their expected concentration. Hexane-related compounds have shown lower recoveries. This is caused by their solubility in water and rapid loss to the atmosphere during dilutions. Generally, the 50% limit concentration recoveries were the farthest from the expected values regardless of the split ratio. However, tetralin met the 15% limit of recovery at 50% limit concentration using the 5:1 split ratio.
We examined the intraday (repeatability) relative standard deviations (RSD) to measure precision. The intraday RSDs were below 15% for most limit concentrations at or above 75% for both split ratios. Interday accuracy data were examined, and the range trends also fit the accuracy trends. The 75% and above limit concentration yielded better accuracies. Interday average recovery values fell between 80% and 120% of expected values. Again, hexane-related compounds did not follow this trend.
To track the stability of the solutions, a single solution preparation at the 100% concentration was evaluated during a 36 h period. There was a recovery change of 31% for 1,2-dimethoxyethane using the 5:1 split ratio and a 25% recovery change for tetrahydrofuran in the 50:1 split ratio. These two compounds had the smallest peak areas, and analysts used their relative changes as trend markers for instability investigation. A change in variability of ≤15% was desired to ensure stability. After 24 h, there was a 7% change for 1,2-dimethoxyethane and a 15% change for tetrahydrofuran.
LOD values for most 5:1 split ratios, as found in Table VI, are below the 100% limit concentration except for the hexane-related compounds and the very small peaks such as 1,2-dimethoxyethane and 1,4-dioxane. The LODs for the 50:1 split ratio mostly were below the 60% limit concentration, except for the hexane-related compounds for which LODs were at the 100% limit concentration. These LODs demonstrate that the method parameters developed were acceptable for identifying these residual solvents at or above their limit concentrations.
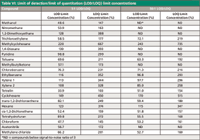
Table VI: Limit of detection/limit of quantitation (LOD/LOQ) limit concentrations
As expected in GC–MS, quantitation is less effective than identification. All the 5:1 split ratio LOQs found were above 145% of the limit concentration. Tetralin had lower LOQs. For the 50:1 split ratio data, the LOQs were above 154% for all the residual solvents' limit concentrations tested. Again, hexane-related compound anomalies were observed. Therefore, method parameters for the new procedure may have limited applications to residual solvent quantitation.
Method Validation: Recovery in Presence of APIs by FID and MS
To compare the recoveries of known residual solvents in the presence of APIs and excipients by the existing <467> method and by the new GC–MS method, analysts contaminated four residual solvents at their individual 100% limit concentrations into sucrose or hydroxyzine dihydrochloride. Methanol, methylene chloride, tetralin, and chloroform were the residual solvents used. These contaminated solutions were spiked with a 50% mixture of all four residual solvents for the MS detection and were individually spiked for FID. Recoveries were compared, as shown in Table VII. The acceptance criterion was to be within ±20% of the expected limit concentration. Generally, the recoveries found by MS and FID were in the expected range. Methanol was within the expected recovery of its 100% limit concentration for both detection systems. For methylene chloride, the recoveries were outside the expected ranges for both detectors. Additionally, the MS recovery was much higher than that found with FID. This was expected because the LOQ for methylene chloride was at 150% of the limit concentration. Generally, the FID methods provided lower recovery results than did the MS. This is expected because MS provides more specificity and FID has a larger dynamic range.

Table VII: Detector comparison: average percent recoveries
Method Validation: Ruggedness
Ruggedness was evaluated by collecting precision data for instrument, chemist, and column variations. Large variations between chemist, column, and instrument were observed. Sample preparations are intrinsically problematic for residual solvent precision and for the evaluation by MS detection. Although instrument and column comparisons should have showed better correlations of intermediate precision data, the results were similar except for the comparison between chemists. A more experienced chemist often is able to prepare samples with less solvent loss. A slight difference in precision was found between the instruments using a syringe-style headspace injector, which had higher RSDs, than with the transfer-line type of autosampler.
Conclusion
The generalized GC–MS method discussed here is capable of identifying all headspace-applicable Class 1 and 2 residual solvents in one analytical method. Limited quantitation is possible for most Class 2 residual solvents. Hexane-related, Class 1, and some low-concentration-limit Class 2 compounds require further improvements in sample preparation and analytical methods. Each residual solvent was identified using a combination of chromatographic or spectral characteristics. Although this GC–MS method showed less quantitation accuracy than did the procedures for FID, this method saves time compared to the current <467> detection and may be a viable alternative. Additionally, signal-to-noise examination of compounds using the USP-provided standards at their limit concentrations provides a way to eliminate using Class 1 residual solvents compared to the current <467>. There is ongoing work to improve the quantitation of procedures presented here and to improve the current <467> GC–FID instrument and sample preparation parameters.
Acknowledgments
The authors would like to thank Walter Hauck, Patricia White, Alan Potts, Stefan Schuber, and USP legal staff for their valuable comments and suggestions.
References
(1) USP, US Pharmacopeia 33–National Formulary 28 Reissue, "Residual Solvents <467>, Supplement 1." USP, Rockville, Maryland, R622–R633 (2010).
(2) ICH, "Harmonised Tipartite Guideline Impurities: Guidelines for Residual Solvents Q3C(R4)," ICH, Geneva, Switzerland (1997).
(3) J.L. Belsky, A.J. Ashley, P.A. Bhatt, K.V. Gilbert, H.R. Joyce, C. Pan, H. Pappa, and S.Z. Wahab, AAPS PharmSciTech.11, 994–1004 (2010).
(4) H. Kataoka, Trends Anal. Chem. 22, 232–244 (2003).
(5) R.L. Grob and E.F. Barry, Modern Practice of Gas Chromatography, 4th ed. (Wiley Interscience, Hoboken, New Jersey, 2009).
(6) C.C. Camarasu, J. Pharm. Biomed. Anal. 23, 197–210 (2000).
(7) Y. Liu and C.Hu, Analytica Chimica Acta. 575, 246–254 (2006).
(8) R.L. Firor and A.E. Gudat. "The Determination of Residual Solvents in Pharmaceuticals Using the Agilent G1888 Headspace/6890 NGC/5975 Inert MSD system," Application Note #5989-3196 EN, June, 2005.
(9) K. Urakami, A. Higashi, K. Umemoto, and M. Godo, J. Chromatogr. A. 1057, 203–210 (2004).
(10) C. Camarasu, J. Pharm. Biomed. Anal. 23, 197–210 (2000).
(11) Wiley Registry of Mass Spectral Data, 8th ed, (John Wiley & Sons, New York, 2007).
Jennifer L. Belsky, Heather R. Joyce, Chunhua Pan, Horacio Pappa, and Samir Z. Wahab are with the US Pharmacopeial Convention in Rockville, Maryland.
Alyssa J. Andrews-Ashley is with US Customs and Border Protection in the US Department of Homeland Security in Springfield, Virginia.
Direct correspondence about <467> to Horacio Pappa at HP@usp.org. Direct all other correspondence to: alyssa.andrews@dhs.gov.

University of Rouen-Normandy Scientists Explore Eco-Friendly Sampling Approach for GC-HRMS
April 17th 2025Root exudates—substances secreted by living plant roots—are challenging to sample, as they are typically extracted using artificial devices and can vary widely in both quantity and composition across plant species.
Miniaturized GC–MS Method for BVOC Analysis of Spanish Trees
April 16th 2025University of Valladolid scientists used a miniaturized method for analyzing biogenic volatile organic compounds (BVOCs) emitted by tree species, using headspace solid-phase microextraction coupled with gas chromatography and quadrupole time-of-flight mass spectrometry (HS-SPME-GC–QTOF-MS) has been developed.
Fundamentals of Benchtop GC–MS Data Analysis and Terminology
April 5th 2025In this installment, we will review the fundamental terminology and data analysis principles in benchtop GC–MS. We will compare the three modes of analysis—full scan, extracted ion chromatograms, and selected ion monitoring—and see how each is used for quantitative and quantitative analysis.
Quantifying Microplastics in Meconium Samples Using Pyrolysis–GC-MS
March 26th 2025Using pyrolysis-gas chromatography and mass spectrometry, scientists from Fudan University and the Putuo District Center for Disease Control and Prevention detected and quantified microplastics in newborn stool samples.
The Role of SPME Combined with GC–MS for PFAS Analysis
Published: March 25th 2025 | Updated: March 25th 2025Emanuela Gionfriddo and Madison Williams from University at Buffalo, the State University of New York, NY, USA discuss the important role that solid-phase microextraction (SPME) techniques with gas chromatography mass spectrometry (GC–MS) can play in the analysis of per- and polyfluoroalkyl substances (PFAS).


