The Spectro-Electro Array: A Novel Platform for the Measurement of Secondary Metabolites in Botanicals, Supplements, and Beverages
LCGC North America
HPLC with diode-array and electrochemical-array detection overcomes sensitivity and specificity limitations in natural products analysis.
This installment describes combining diode-array detection (DAD) and coulometric electrochemical-array detection to overcome sensitivity and specificity limitations often encountered when analyzing natural products.
Plants contain an amazingly diverse range of secondary metabolites that may offer important health benefits or risks (1,2). The challenge facing analytical chemists seeking to identify and measure these compounds is twofold: first, to accurately discriminate between compounds sharing similar physicochemical characteristics; and second, to tease this information out of complicated matrices including botanicals, supplements, foods, and beverages.
Gradient high performance liquid chromatography (HPLC) with diode-array detection (DAD) is often used to measure the major components present in botanicals. HPLC–DAD is a robust, relatively simple technique that quantifies known analytes that can be resolved in simple matrices, but it suffers from a lack of specificity whenever compounds with similar structures that cannot be deconvoluted spectrally are coeluted (Figure 1). Furthermore, this technique is generally not sensitive enough for the study of natural product metabolism in animals and humans. Electrochemical detection (ECD), on the other hand, is highly sensitive and selective and can distinguish between subtle changes in chemical structure (Figure 1).
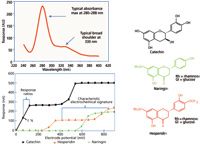
Figure 1: Comparison of the spectral and electrochemical properties of selected flavonoids. Compounds with similar structures have similar absorbance spectra and changes in functional groups have limited effect on this response (inset). Electrochemical detection, however, is extremely sensitive to the type, degree, and position of substitution as shown by the different current voltage curves (hydrodynamic voltammograms) of catechin (oxidizing at approximately +100 mV), hesperidin (oxidizing at approximately +400 mV), and naringin (oxidizing at approximately +700 mV).
Although ECD is selective, many chemicals are electrochemically active, including compounds containing an aromatic backbone with alcohol, amine, or thiol groups attached directly to an aromatic ring, quinones, and conjugated polyenes (with three or more conjugated double bonds) (3). Phytochemical examples include some alkaloids (such as lysergic acid and morphine), carotenoids (such as carotenes and lycopene), fat soluble antioxidants (such as tocopherol and phylloquinine), phenolic acids, and various polyphenols such as the flavonoid group (for example, catechins, daidzein, and genistein).
The structure–activity relationships of polyphenolics found in foods and beverages and their antioxidant properties have been extensively studied and are correlated to the ease of electrochemical oxidation. For example, the structural characteristics of polyphenolic phytochemicals that influence their oxidation potential include the type of substitution (such as hydroxy and methoxy), degree of substitution (such as phenol, catechol, and gallo), and the position of substitution relative to other groups (that is, ortho, para, and meta). Thus, the oxidation potential for different substitutions can be ranked from the most labile (lowest oxidation potential) to the most stable (highest oxidation potential): trihydroxy > dihydroxy > methoxy > monohydroxy. Such differences in electrochemical behavior are presented in Figure 1, using catechin, hesperidin, and naringin as examples. Because the compounds require different applied potentials to produce an electrochemical response, this attribute can provide voltammetric resolution when using an array of coulometric electrochemical sensors. Such electrochemical arrays are typically used with the first electrode set to a low potential and each electrode in the series set at increasing, but fixed potentials. Easily oxidized compounds can be selectively detected at upstream, low-potential sensors, and compounds that are more difficult to oxidize respond at downstream sensors set at higher potentials. Coulometric electrochemical-array detection uses a series of as many as 16 highly efficient sensors to voltammetrically resolve those compounds that are coeluted chromatographically (Figure 2) and can identify these analytes based on their voltammetric profile (in an analogous fashion to spectral information obtained from DAD) (3,4). This is a practical and robust form of ECD.
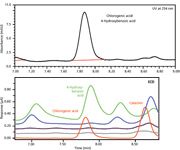
Figure 2: In this application both chlorogenic acid and 4-hydroxybenzoic acid are coeluted and cannot be resolved spectrophotometrically (UV at 254 nm). However, the electrochemical profiles of these two compounds differ substantially, so they can be resolved voltammetrically, with chlorogenic acid responding exclusively at an upstream (low potential) electrode shown in red and 4-hydroxybenozoic acid responding exclusively at a downstream (high potential) electrode shown in green.
This approach has been successfully applied to the targeted measurement of numerous phytochemicals in a number of matrices such as botanicals (5,6), juice and alcoholic beverages (7–13), food (14–16), and tobacco (11,17). The sensitivity and selectivity of this technique are crucial when studying mammalian phytochemical metabolism (18–28).
Gradient HPLC with coulometric array detection is capable of resolving and measuring several hundred analytes simultaneously (3,29–32). Changes in the pattern of metabolites, when evaluated using chemometric modeling software, can be used to study product adulteration, contamination, composition, and stability, and, in the case of wine and fruit juice, the effect of growing region and differences between varietals (33).
Although electrochemical detection offers analysts many advantages, it is limited to the measurement of electrochemically active compounds only. The combination of DAD and coulometric electrochemical-array detection extends the range of compounds measureable by either technique alone. This platform, called the spectro-electro array, places the diode-array detector before the coulometric array, thereby enabling spectral characterization of analytes before their electrochemical detection. As discussed below, this technique was evaluated for its ability to resolve and quantify targeted phytochemicals in crude extracts of a variety of botanical supplements (for example, ginseng, black cohosh, and gingko), beverages (black and green tea), culinary herbs (oregano, rosemary, sage, and thyme) and spices (clove and nutmeg), as well as its ability to differentiate between samples based on their metabolite patterns.
Methods
Liquid Chromatography
A Thermo Scientific Dionex LPG-3400BM pump with an SR-3000 solvent rack was used. The autosampler used was a Thermo Scientific Dionex WPS-3000TBSL. The UV detector used was a Thermo Scientific Dionex DAD-3000RS diode-array detector, with the following settings: channel 1: 218 nm; channel 2: 240 nm; channel 3: 254 nm; and channel 4: 275 nm. A Thermo Scientific Dionex CoulArray detector with Thermal Organizer was used as the electrochemical detector, consisting of a 16-channel array at potentials ranging from 0 to +900 mV in 60-mV increments. Mobile-phase A consisted of 20 mM monobasic sodium phosphate, 3% acetonitrile, and 0.2% tetrahydrofuran at pH 3.35. Mobile-phase B consisted of 20 mM monobasic sodium phosphate, 50% acetonitrile, and 10% tetrahydrofuran at pH 3.45. Mobile-phase C consisted of 90% methanol. The gradient was as follows: 0–2 min at 2%B/3%C, then 2–30 min ramp to 97%B/3%C, hold until 45 min at 97%B/3%C. A 150 mm × 3 mm, 3-µm Thermo Scientific Acclaim 120 C18 HPLC column was used with a flow rate of 0.65 mL/min and an injection volume of 10 or 20 µL.
Data Analysis
Data were analyzed using Thermo Scientific Dionex Chromeleon chromatography data system 6.8 (SR9) and CoulArray software 3.1. Electrochemical-array data were transferred to Pirouette chemometrics software (Infometrix, Inc.) for chemometric analysis using a CoulArray version 2.0 software utility (Pattern Recognition Setup Wizard).
Standard Preparation
Stock standards, depending on solubility, were prepared in ethanol, methanol, or methanol and water solutions at 1000 µg/mL or 100 µg/mL. Working standards were prepared at 0.2, 0.5, and 1.0 µg/mL in 10% methanol containing 0.2% ascorbic acid and 0.02% EDTA.
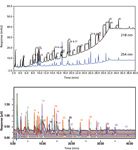
Figure 3: Measurement of standard mixture by UV detection at 218 and 254 nm (upper figure) and 16-channel coulometric electrochemical-array detection (lower figure).
Sample Preparation
Supplements and culinary herbs were prepared for analysis by extracting 100 mg of the material with 20 mL of methanol. The samples were sonicated for 30 min and subsequently centrifuged to obtain a clear solution. The solution was diluted 5× with a preservative solution (10% methanol containing 0.2% ascorbic acid and 0.02% EDTA) for injection into the HPLC system. Wine samples were diluted 1:50 (v/v) with the preservative solution.
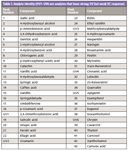
Table I: Analyte identity (UV1âUV6 are analytes that have strong UV but weak EC response)
Targeted Analyses
As shown in Figure 3, numerous phenol and polyphenol analytes can be resolved using this approach (see Table I for identification). It should be noted that there are six compounds designated UV1–UV6 that showed poor response by ECD, but they are readily detectable by UV. The limits of detection were typically 10–50 pg on-column by ECD and 100–500 pg by UV. The limits of quantification were 200–1000 pg (on-column) by ECD and 500–5000 pg by UV. The response ranges were over seven orders of magnitude by ECD and five by UV. Typical R2 values were ~0.999 or better for all compounds. The average interday retention time precision for all analytes averaged 0.55% RSD over a 10-day period, with a range of 0.30–1.22%.
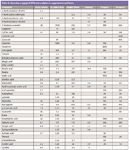
Table II: Abundance (µg/g) of different analytes in supplements and herbs
The targeted approach was used to measure the levels of phenols and polyphenols in a variety of supplements and culinary herbs. Analyte levels (Table II) were in good agreement with levels reported in previous publications (9,34–36). St. John's wort (Hypericum perforatum) is reportedly effective in the treatment of moderate depression in a number of clinical trials. The two major polyphenols in St. John's wort, hypericin and pseudohypericin, were easily measured using both UV detection and ECD (Figure 4, ~18 min). Rosemary is particularly rich in carnosic acid, a potent antioxidant and anticarcinogen that is a major constituent of the dried leaf. Another major component of rosemary is rosemarinic acid, which is also known for its antioxidant properties.
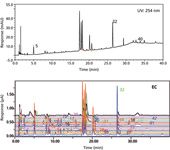
Figure 4: Measurement of phytochemicals in St. John’s wort by UV detection at 254 nm (upper figure) and 16-channel coulometric electrochemical-array detection (lower figure).
Metabolite Patterns
Examination of the pattern of both known and unknown metabolites can be used to authenticate a sample or measure contamination and adulteration. Two simple experiments were used to evaluate the application of the spectro-electro array to metabolomic studies. The first examined the metabolite profiles of a selection of red wines. The general polyphenol method was used to analyze five red wines (four cabernet sauvignon samples and one burgundy sample). Several hundred analytes, including both known (see Table III) and unknown compounds, were measured in each sample. Levels of known compounds were similar to those previously published (8,9). Principal component analysis (PCA) was able to identify wine samples as either burgundy or cabernet sauvignon (Figure 5). Although this study is preliminary it does show the capability of the system to differentiate samples by grape varietal or blend and growing region. This approach is important when trying to authenticate a sample or for identifying product adulteration.
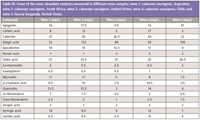
Table III: Some of the more abundant analytes measured in different wine samples; wine 1: cabernet sauvignon, Argentina; wine 2: cabernet sauvignon, South Africa; wine 3: cabernet sauvignon, United States; wine 4: cabernet sauvignon, Chile; and wine 5: hearty burgundy, United States
In the second application, the metabolomics approach was investigated as a means to authenticate or detect adulteration of orange juice samples (33). The study was intended to detect the lowest level of adulteration (by blending with other juices or through the addition of orange peel or pulp-wash) that could be detected in orange juice samples. Blending of as little as 10% grapefruit juice into orange juice could easily be measured. Similarly, blending only 10% orange peel or 10% pulp-wash into orange juice could be detected.

Figure 5: Initial study showing principal component analysis of wines.
Antioxidant Capacity
There is considerable interest in the antioxidant capacity of botanical supplements, foods, and beverages with high levels of antioxidants purported to offer health benefits. There are a number of different approaches that vary in their ability to accurately measure the total antioxidant capacity of a given sample and these have been reviewed elsewhere (37,38). One approach, the oxygen radical absorbance capacity (ORAC) test, is routinely applied to foods. An advantage of the ORAC test is that it is relatively quick and easy to perform, however it can only provide data for the total antioxidant capacity of the sample rather than measuring the individual contribution of different antioxidants (39). The coulometric electrochemical array not only has the ability to identify and simultaneously quantify multiple antioxidants (and thus the contribution of individual compounds), but also the total antioxidant capacity of a sample can be calculated through the summation of the response of all analytes in the pattern. There is good correlation between ORAC and the coulometric electrode array (39,40).
Conclusions
Gradient HPLC with spectro-electro array detection can quantify a wide variety of important phytochemicals at trace levels in complex matrices such as botanical preparations, spices, wine, and fruit juice. To maintain data quality, sample preparation is kept as simple as possible and stabilizers are added to prevent auto-oxidation of analytes before injection. The sensitivity, wide dynamic range, and resolution of this combined approach is superior to traditional spectroscopic techniques.
Gradient elution and voltammetric resolution of similar compounds significantly extends the number of analytes capable of being measured simultaneously. The great utility of this method lies in the ability to separate and quantitate approximately 50 different phenolic and polyphenolic compounds in a wide variety of sample matrices. In addition, even unidentified compounds provide useful information when used in pattern recognition studies. These metabolite patterns are useful for evaluating product identity, purity, authenticity, and for differentiating among varietals, strains, and growing regions.
The spectro-electro array can be used to measure the total antioxidant capacity of a sample and to identify individual contributing antioxidants.
B.A. Bailey is a product applications manager with Thermo Fisher Scientific in Chelmsford, Massachusetts.

B.A. Bailey
D.H. Thomas is a product and support scientist with Thermo Fisher Scientific.
D.H. Thomas
I.N. Acworth is director of customer and application support with Thermo Fisher Scientific.

I.N. Acworth
P.A. Ullucci is with technical support at Thermo Fisher Scientific.

P.A. Ullucci
Michael Swartz "Innovations in HPLC" Editor Michael E. Swartz, PhD, is Principal Scientist in Analytical Development at Ariad Pharmaceuticals, Cambridge, Massachusetts, and a member of LCGC's editorial advisory board. Direct correspondence about this column to "Innovations in HPLC," at lcgcedit@lcgcmag.com.

Michael Swartz
References
(1) A. Abdel-Rahman, N. Anyangwe, L. Carlacci, S. Casper, R.P. Danam, E. Enongene, G. Erives, D. Fabricant, R. Gudi, C.J. Hilmas, F. Hines, P. Howard, D. Levy, Y. Lin, R.J. Moore, E. Pfeiler, T.S. Thurmond, S. Turujman, and N.J. Walker, Toxicol. Sci. 123, 333 (2011).
(2) Z.P. Xiao, Z.Y. Peng, M.J. Peng, W.B. Yan, Y.Z. Ouyang, and H.L. Zhu, Mini Rev. Med. Chem. 11, 169 (2011).
(3) Coulometric Electrode Array Detectors for HPLC. Progress in HPLC-HPCE, Volume 6. I.N. Acworth, M. Naoi, H. Parvez, and S. Parvez, Eds. (VSP, Utrecht, Netherlands, 1997).
(4) C.N. Svendsen, Analyst 118, 123 (1993).
(5) M. Lijuan, Z. Xuezhu, Z. Haiping, and G. Yiru, J. Chromatogr. B Analyt. Technol. Biomed. Life Sci. 846, 139 (2007).
(6) L. Ma, X. Zhang, H. Guo, and Y. Gan, J. Chromatogr. B Analyt. Technol. Biomed. Life Sci. 833, 260 (2006).
(7) D. Kahoun, S. Rezková, K. Veskrnová, J. Královský, and M. Holcapek, J. Chromatogr. A 1202, 19 (2008).
(8) R. Larcher, G. Nicolini, C. Puecher, D. Bertoldi, S. Moser, and G. Favaro, Anal. Chim. Acta 582, 55 (2007).
(9) P. Jandera, V. Skeifíková, L. Rehová, T. Hájek, L. Baldriánová, G. Skopová, V. Kellner, and A.Horna, J. Sep. Sci. 28, 1005 (2005).
(10) G. Sontag, O. Friedrich, and Z. Lebensm. Unters. Forsch. 186, 130 (1988).
(11) G. Achilli, G.P. Cellerino, P.H. Gamache, and M. d'Eril, J. Chromatogr. 632, 111 (1993).
(12) P. Gamache, E. Ryan, and I.N. Acworth, J. Chromatogr. 635, 143 (1993).
(13) K. Petrus, H. Schwartz, and G. Sontag, Anal. Bioanal. Chem. 400, 2555 (2011).
(14) K. Aaby, D. Ekeberg, and G. Skrede, J. Agric. Food Chem. 55, 4395 (2007).
(15) H. Schwartz and G. Sontag, J. Chromatogr. B Analyt. Technol. Biomed. Life Sci. 838, 78 (2006).
(16) M. Brenes, A. García, P. García, and A. Garrido, J. Agric. Food Chem. 48, 5178 (2000).
(17) R. Larcher, G. Nicolini, D. Bertoldi, and T. Nardin, Anal. Chim. Acta 609, 235 (2008).
(18) P.P. Söderholm, J.E. Lundin, A.H. Koskela, M.J. Tikkanen, and H.C. Adlercreutz, Br. J. Nutr. 106, 1040 (2011).
(19) T. Nurmi, S. Voutilainen, K. Nyyssönen, H. Adlercreutz, and J.T. Salonen, J. Chromatogr. B Analyt. Technol. Biomed. Life Sci . 798, 101 (2003).
(20) B. Klejdus, J. Vacek, V. Adam, J. Zehnálek, R. Kizek, L. Trnková, and V. Kubán, J. Chromatogr. B Analyt. Technol. Biomed. Life Sci. 806, 101 (2004).
(21) P.H. Gamache and I.N. Acworth, Proc. Soc. Exp. Biol. Med. 217, 274–280 (1998).
(22) R.R. Holt, S.A. Lazarus, M.C. Sullards, Q.Y. Zhu, D.D. Schramm, J.F. Hammerstone, C.G. Fraga, H.H. Schmitz, and C.L. Keen, Am. J. Clin. Nutr. 76, 798 (2002).
(23) S. Yasuda, P.S. Wu, E. Hattori, H. Tachibana, and K. Yamada, Biosci. Biotechnol. Biochem. 68, 51 (2004).
(24) P.P. Söderholm, A.H. Koskela, J.E. Lundin, M.J. Tikkanen, and H.C. Adlercreutz, Am. J. Clin. Nutr. 90, 1167 (2009).
(25) M. Maeda-Yamamoto, K. Ema, Y. Tokuda, M. Monobe, H. Tachibana, Y. Sameshima, and S. Kuriyama, Cytotechnology 63, 171 (2011).
(26) S.M. Wittemer, M. Ploch, T. Windeck, S.C. Müller, B. Drewelow, H. Derendorf, and M. Veit, Phytomedicine12, 28 (2005).
(27) S.M. Henning, Y. Niu, Y. Liu, N.H. Lee, Y. Hara, G.D. Thames, R.R. Minutti, C.L. Carpenter, H. Wang, and D. Heber, J. Nutr. Biochem. 16, 610 (2005).
(28) R. Bugianesi, M. Serafini, F. Simone, D. Wu, S. Meydani, A. Ferro-Luzzi, E. Azzini, and G. Maiani, Anal. Biochem. 284, 296 (2000).
(29) S. Rozen, M.E. Cudkowicz, M. Bogdanov, W.R. Matson, B.S. Kristal, C. Beecher, S. Harrison, P. Vouros, J. Flarakos, K. Vigneau-Callahan, T.D. Matson, K.M. Newhall, M.F. Beal, R.H. Brown, and R. Kaddurah-Daouk, Metabolomics 1, 101 (2005).
(30) S. Schiavo, E. Ebbel, S. Sharma, W. Matson, B.S. Kristal, S. Hersch, and P. Vouros, Anal. Chem. 80, 5912 (2008).
(31) M. Bogdanov, W.R. Matson, L. Wang, T. Matson, R. Saunders-Pullman, S.S. Bressman, and M.F. Beal, Brain 131, 389 (2008).
(32) B.S. Kristal, Y.I. Shurubor, R. Kaddurah-Daouk, and W.R. Matson, Methods Mol. Biol. 358, 159 (2007).
(33) P.H. Gamache, I.N. Acworth, M.L. Lynch, and W.M. Matson, in Methods To Detect Adulteration of Fruit Juice Beverages, S. Nagy and R.L. Wade, Eds. (Agscience Inc. Florida, 1995), Vol. 1, pp. 120–144.
(34) W. Zheng and S.Y. Wang, J. Agric. Food Chem. 49, 5165 (2001).
(35) B. Shan, Y.Z. Cai, M. Sun, and H. Corke, J. Agric. Food Chem. 53, 7749 (2005).
(36) M.J. Dubber and I. Kanfer, J. Pharm. Pharamaceut. Sci. 7, 303 (2004).
(37) E. Niki, Free Radic. Biol. Med. 49, 503 (2010).
(38) R.L. Prior, X. Wu, and K. Schaich, J. Agric. Food Chem. 53, 4290 (2005).
(39) C. Guo, C. Guohua, E. Sofic, and R.L. Prior, J. Agric. Food Chem. 45, 1787 (1997).
(40) K. Aaby, E. Hvattum, and G. Skrede, J. Agric. Food Chem. 52, 4595 (2004).

New Study Reviews Chromatography Methods for Flavonoid Analysis
April 21st 2025Flavonoids are widely used metabolites that carry out various functions in different industries, such as food and cosmetics. Detecting, separating, and quantifying them in fruit species can be a complicated process.
Analytical Challenges in Measuring Migration from Food Contact Materials
November 2nd 2015Food contact materials contain low molecular weight additives and processing aids which can migrate into foods leading to trace levels of contamination. Food safety is ensured through regulations, comprising compositional controls and migration limits, which present a significant analytical challenge to the food industry to ensure compliance and demonstrate due diligence. Of the various analytical approaches, LC-MS/MS has proved to be an essential tool in monitoring migration of target compounds into foods, and more sophisticated approaches such as LC-high resolution MS (Orbitrap) are being increasingly used for untargeted analysis to monitor non-intentionally added substances. This podcast will provide an overview to this area, illustrated with various applications showing current approaches being employed.


