When Should an Internal Standard be Used?
LCGC North America
Will an internal standard always improve data quality?
Will an internal standard always improve data quality?
A reader contacted me recently after receiving reviewer comments for a paper that they had submitted for publication. The reviewer suggested that the author would get much better data quality if they used an internal standard with their liquid chromatography (LC) method. The reader wasn't sure how an internal standard would improve the results, because they had never used this method of calibration before, so they asked me for some help. I think this is a good opportunity for a general discussion on this topic, because even though many workers use internal standards on a daily basis, many others may never have the need or, as is the present reader's case, may not know enough about internal standardization to make an informed decision about its use.
The concept of an internal standard (IS) is quite simple — you just add a known amount of the IS to every sample, both calibrators and unknowns, and instead of basing the calibration on the absolute response of the analyte, the calibration uses the ratio of response between the analyte and the IS.
External Standardization
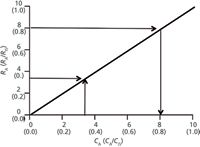
Most of us are familiar with how external standardization is used, but a review won't hurt. To construct a calibration plot, a series of calibration solutions are made containing known concentrations of reference standard. For the present discussion, let's refer to these as CA for concentration of analyte, and make solutions at 0, 2, 4, 6, 8, and 10 ng/mL. A series of chromatograms are run where the same volume of each solution (for example, 10 µL) is injected, and the response of the analyte (RA) is recorded (usually peak height or peak area). If the responses for the respective solutions are 0, 2, 4, 6, 8, and 10 area units, we can construct a calibration plot, such as that shown in Figure 1. Each point on the calibration line corresponds to a calibrator concentration and its response, as illustrated for the 4-ng/mL calibrator and its 4 area-unit response (dashed line in Figure 1). Then samples of unknown concentration are prepared using the same sample preparation procedure, injected, and the area of the resulting peak is measured, an area of 8, for example. This value is located on the vertical axis and a horizontal line is drawn to the right (dashed line) until it intersects with the calibration line. From this point, a vertical line is dropped to determine the concentration of analyte in the unknown sample (8 ng/mL in the present example). Of course, with a modern data system all this is done mathematically in the background, so manual plots such as that of Figure 1 are rarely constructed.

Figure 1: Calibration plots of concentration of analyte (CA) versus response (RA) for external standardization (plain text) and concentration ratio (CA/CIS) versus response ratio (RA/RIS) for internal standardization (labels in parentheses).
Internal Standardization
For IS calibration, an IS is chosen (according to the criteria discussed below), and is added at the same concentration to every sample. For example, to generate an internally standardized calibration plot for the data discussed above, we might make a concentrated IS solution of 100 ng/mL of the IS. Then an aliquot of this IS solution would be added to a specific volume of a reference standard solution to obtain a known ratio of concentrations, CA /CIS . For example, 900 µL of a 4-ng/mL solution of reference standard plus 100 µL of the 100-ng/mL IS solution would yield 1 mL of a solution with a ratio of 0.36 CA /CIS , which is equal to ([4 ng/mL × 900 µL]/1000 µL)/([100 ng/mL × 100 µL]/1000 µL). When this solution is injected, it will give a chromatogram with two peaks, one each for the reference standard and IS. The area ratio for these two peaks is paired with the concentration ratio to construct the calibration plot as in Figure 1, where the arrows highlight the 0.36 CA /CIS concentration ratio and its corresponding 0.36 RA /RIS response ratio (I've assumed the analyte and internal standard have the same response characteristics). Now, if the same sample preparation procedure is used to add IS to unknown samples, the RA /RIS ratio can be used to determine the concentration ratio (arrows for 0.8 RA/RIS leading to 0.8 CA /CIS in Figure 1). Because the concentration of IS (CIS) added to the sample is known, the concentration of analyte in the sample (CA ) can be calculated.
When to Use an Internal Standard
Next, let's see when an internal standard is and is not effective at improving method performance. In particular, we're interested in the accuracy and the amount of uncertainty (imprecision) of the measured result for a sample. We'll consider three different cases as illustrations.
If the sample preparation is quite simple and the LC equipment, especially the autosampler, is working very well, an IS may not add any benefit. For example, if a liquid sample is taken and diluted 1:10 for injection using volumetric pipettes and glassware, there isn't much that can go wrong. In such cases, chromatograms may appear like those in Figure 2. In these partial chromatograms, the analyte peak (A) is eluted first, followed by the IS peak, with the areas and peak-area ratios noted in the caption. You can see that the IS peak size is almost identical for all three samples, as might be expected with such a simple sample preparation procedure and a high-precision autosampler. For this kind of sample, external standardization would be preferred for several reasons. First, it is more convenient and less expensive because the extra step of adding the IS during sample preparation is eliminated. Second, the chromatogram is simpler, so there will be less concern about interfering peaks that might compromise the results. Third, the data are easier to process because there is only one peak to measure in each chromatogram. And fourth, the uncertainty of the results may be smaller because the variability in IS addition and IS peak measurement is eliminated.

Figure 2: Partial simulated chromatograms for an analyte (A) and internal standard (IS). Area and response ratios (RA/RIS) of (a) 6012/10056 = 0.6, (b) 7995/9996 = 0.8, (c) 9997/10040 = 1.0.
An internal standard will benefit the method most commonly when there are multiple sample preparation steps, especially when volumetric recovery at each step may vary. (In the past, internal standards sometimes were used to correct for variability in injection volume, but today's autosamplers generally have a volumetric imprecision of <0.5%, so such corrections are not necessary.) Consider the case of a method used for determination of a drug in plasma using a liquid–liquid extraction technique for sample preparation. For such cases, small-volume samples are used to minimize sample collection issues, reduce reagent expenses, and simplify the handling of perhaps hundreds or thousands of samples in a drug development study. Let's say that 10 µL of IS solution is added to a 200-µL plasma sample, vortexed, and mixed with 100 µL of high-pH buffer. Next, 100 µL of this solution is extracted with 500 µL of methyl-tert-butyl ether (MTBE). The MTBE phase is removed, evaporated to dryness, and the residue is reconstituted in 50 µL of injection solvent, followed by injection of 10 µL. There are several steps where small errors may increase the variability of results. Any error in addition of the buffer will be passed along to the exaction step when an aliquot of the sample-buffer mixture is taken. When the MTBE layer is removed, typically a little MTBE is left behind so that none of the aqueous phase is included; the amount of MTBE recovered therefore will vary a bit. Evaporation and reconstitution offer additional opportunities for variability in the process. The net result is that the absolute fraction of the original sample that ends up in the injection vial will vary much more with this multistep procedure than with the simple dilution used in the previous example. If an IS is used, it should be added as early in the process as possible, then the subsequent volumetric losses will be compensated. Consider the example of Figure 3, where three replicate preparations were made of a homogenous sample. Because of sample loss during sample preparation, the absolute peak areas vary by 40% between the samples, but the RA/RIS ratios, and thus CA/CIS ratios are constant, so imprecision is low even with widely varying peak sizes. In other words, because we're interested only in the ratio of peak sizes, the IS technique corrects for variability that would be difficult to control otherwise.

Figure 3: Partial simulated chromatograms, as in Figure 2 for three replicate extractions of a homogenous sample. (a), (b), and (c) each have RA/RIS = 1.0.
There are cases, however, where the use of an internal standard not only may be ineffective, but also may be misleading. An example of this is shown for another set of three replicate samples in Figure 4, similar to those of Figure 3. In Figure 4, you can see that the peak size of the IS peak and the RA/RIS ratio varies significantly. If the IS were working properly, the IS peak size wouldn't matter, because the response ratio would be constant. If the IS were not needed, the analyte peak response should be constant. When we see a problem like this, the IS procedure is not working properly, usually because of the way the IS is used or because an inappropriate IS was chosen (see discussion on how to choose an IS further on). If we assume that the IS was selected correctly, what could cause the problems of Figure 4? The basic assumption with internal standardization is that once the IS is in the sample, any losses should affect the IS and analyte proportionally, so the ratio of analyte to IS stays constant. This means that most likely the problem is related to something that happened to the sample before or during the addition of the IS. For example, if the sample was inappropriately assumed to be homogeneous before aliquotting and adding the IS, the IS would not correct for lack of sample homogeneity. On the other hand, if the IS were not added properly, problems could occur. I saw this once in a client laboratory when the mechanical pipette used to add the internal standard was out of calibration and not reproducible. Tracking down such problems can be tedious, but by breaking the process into steps and using matrix-free samples, you can analyze the solution at each step in the process and isolate the problem step.

Figure 4: Partial simulated chromatograms, as in Figure 3 for three replicate extractions of a homogeneous sample. RA/RIS for (a) = 0.6, (b) = 1.0, and (c) = 0.8.
Choice of Internal Standard
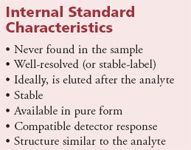
If it is determined that an IS is likely to improve the data quality, a suitable compound needs to be chosen for the IS. The sidebar contains a list of characteristics that often are cited as requirements for a good internal standard. Let's take a moment and consider each of these characteristics.
Never found in sample: This seems logical — after all, if the internal standard is always or occasionally present in untreated samples, how can you tell the difference between the response of the native IS and the added IS? Although absence of the IS is an ideal, if the amount of IS present in normal samples is much less than the amount of added IS, it is unlikely that there will be a problem. For example, if the native IS peak is never more than 2% of the added IS peak, the results probably will show no adverse effects.

Internal Standard Characteristics
Well-resolved (or stable-label): The chromatographic system needs to be able to independently measure the size of the analyte and IS peaks. For most detectors, this means that there should be baseline resolution between the peaks. For liquid chromatography–mass spectrometry (LC–MS), however, the added selectivity of the MS detector often will allow independent measurement of the analyte and IS if they do not have the same molecular weight. This is one reason why stable-label, or isotopically labeled, versions of the analyte are used with LC–MS methods — the peaks can be coeluted, yet they can be separately measured by the detector.
Ideally is eluted after the analyte: This is a desirable characteristic rather than a necessary one. If the IS is eluted after the analyte, it can offer additional information on the quality of the separation. For example, if the retention time of the IS is correct, you know that the chromatographic conditions were correct up to that point in the chromatogram and you can be confident in the retention times of all earlier-eluted peaks. On the other hand, if the IS comes out before the analyte, you may know that everything up to that point in the chromatogram was ok, but something could have happened immediately afterward to affect the remaining peaks.
Stable: At a minimum, the IS needs to be sufficiently stable so that it does not degrade during the sample preparation and chromatographic analysis processes. Although not essential, more stability will mean more convenience, so that stock solutions will last longer, refrigeration or freezing may not be needed, and so forth.
Available in pure form: This requirement is a bit misleading. It would be better to state that any impurities present will not be coeluted with the analyte or otherwise interfere with the process. For example, an IS with 80% purity could be used if the 20% impurity did not interfere with the method. Higher-purity internal standards usually are preferred, but 100% purity is not required, and in some cases is very difficult to obtain. For example, in the case of stable-label or isotopically labeled internal standards that are common with LC–MS methods, 100% purity is almost never the case. The reason is that it is nearly impossible to synthesize a stable-label IS without at least some unlabeled analyte present. As long as the amount of unlabeled material is so small that it does not affect the results, it will not matter. The rule of thumb for the analysis of drugs in biological matrices, such as plasma, is that the unlabeled analyte from the IS solution present in the sample needs to generate <5% of the response of the analyte at the lower limit of quantification (LLOQ). With this small amount of unlabeled analyte present, the performance of the method will not suffer.
Compatible with detector response:Adequate detector response certainly is necessary. However, the response does not have to be the same as the analyte in terms such as response/gram or detection wavelength, but it does need to be easily detectable.
Structure similar to analyte:It often is stated that the IS needs to have a close chemical relationship to the analyte of interest. This really is not necessary — if benzene has all the other characteristics needed, it might be an adequate IS for a drug analysis method. However, because the IS needs to have similar extraction characteristics, retention times, stability, and detector response as the analyte, it is highly likely that it will be a compound of similar structure. Most internal standards are existing compounds with close structural relationships to the analyte, specially synthesized modifications of the analyte, or stable-label compounds for LC–MS, where several carbon-13 or deuterium atoms are substituted into the unlabeled analyte.
Conclusions
We have seen that the addition of internal standards can be a useful tool to help improve the precision and accuracy of some LC methods, but not in every case. In the example of Figure 2, we saw that the IS added no benefit to the method, so external standardization is likely to be more convenient and less expensive. In the second case (Figure 3), the IS did exactly what it was supposed to, correcting for uncontrolled sample losses during sample preparation; this method benefits by the use of an IS. In the final example (Figure 4), the IS did not correct for method variability. This may be caused by a poor choice of IS, faulty equipment, addition of the IS after sample variability is influenced, or some other problem that will need to be isolated. Whether or not an IS is to be used for this method, work needs to be done to isolate and correct the excess variability or the analytical results will not be very useful.
Even if you choose to use an IS, I suggest that you run at least one batch of validation (or prevalidation) samples where the data are worked up using both external and internal standardization. Let the data help you decide which technique gives better method performance.
Erratum
Equation 4 in the April installment of "LC Troubleshooting" (LCGC North America 30[4], 312–318 [2012]) has a typographical error. It should read

John W. Dolan"LC Troubleshooting" Editor John Dolan has been writing "LC Troubleshooting" for LCGC for more than 25 years. One of the industry's most respected professionals, John is currently the Vice President of and a principal instructor for LC Resources, Walnut Creek, California. He is also a member of LCGC's editorial advisory board. Direct correspondence about this column via e-mail to John.Dolan@LCResources.com.

John W. Dolan

New Method Explored for the Detection of CECs in Crops Irrigated with Contaminated Water
April 30th 2025This new study presents a validated QuEChERS–LC-MS/MS method for detecting eight persistent, mobile, and toxic substances in escarole, tomatoes, and tomato leaves irrigated with contaminated water.

.png&w=3840&q=75)

.png&w=3840&q=75)


.png&w=3840&q=75)


.png&w=3840&q=75)


