A Simple Approach to Performance Optimization in HPLC and Its Application in Ultrafast Separation Development
LCGC North America
The guest authors describe an optimization procedure to achieve the highest plate count in a given analysis time.
Chromatographers are always interested in higher efficiency. This is motivated by the resolution equation, which shows that increases in column efficiency always result in improved resolution. Chromatographic efficiency is affected by a large number of experimental variables and its optimization can be achieved in many different ways, depending upon how many variables one is willing to adjust. These include pressure, temperature, particle size, column length, and eluent velocity. In the early days of high performance liquid chromatography (HPLC), the selection of column formats (particle size, type, and column diameters) was rather limited and thus, optimization often was done by adjusting operational variables such as eluent velocity, column temperature, and operating pressure. Nowadays the selection of column formats is substantially wider and one can find a number of particle sizes between 1.7 μm and 5 μm, and numerous column lengths are achievable by coupling columns in series. This makes optimization of these nominally "discrete" variables possible (that is, particle size and column length).
Optimization of performance (meaning efficiency versus time) in HPLC has been studied for decades. Van Deemter was clearly among the first who understood how plate count on a given column could be optimized by varying the eluent velocity (1). When column length is also allowed to vary, one can use the Poppe plot (2) or kinetic plot (3,4) techniques that consider pressure and time constraints as part of the optimization process. Ultimately, one also can vary particle size, and this optimization has been studied by several LC pioneers including Halasz (5), Knox (6), Horvath (7), and Guiochon (8). We recently summarized these distinct optimization schemes and emphasized the different chromatographic results that these approaches entail (9). The purpose of this column is to propose a simple, stepwise optimization procedure that is solidly founded and to demonstrate its practical utility by applying it to the development of an ultrafast isocratic separation for pharmaceutical applications.
As the march toward more-efficient separations continues, so does the demand for faster separations without sacrificing efficiency. This has been stimulated by the present and persistent need to deal with more and more samples in the same or less time. Clearly "fast" means different things in different applications. For example, "fast" can be a 10-min separation for organic impurities analysis in pharmaceuticals, or it can be a 1-min separation for cleaning analysis in drug manufacturing. In this column, we focus on the implementation of fast LC in pharmaceutical drug product dissolution testing. In such a test, one is primarily interested in quantifying the active pharmaceutical ingredient (API) released from dosage forms, thus, only moderate plate counts are required; here, analysis speed is more important than higher efficiency. Dissolution samples often are analyzed by two techniques, direct UV or HPLC–UV, in almost equal proportions as shown by an online survey of dissolution studies (10). Table I compares these two techniques. A thorough review of the use of HPLC in dissolution studies can be found in a chapter written by Wang and Gray (11). While UV–vis spectroscopy is cheaper and simpler, HPLC offers many advantages, such as better specificity and a greater linear dynamic range. HPLC is also more versatile especially for early drug development when different formulations and strengths are screened. The main disadvantage of traditional HPLC is its relatively slower speed (about 3–5 times slower than UV analysis). Clearly, increasing the speed of HPLC makes it more attractive in this context.
This work focuses on using theoretical guidance to develop better ultrafast isocratic separations (approximately 30 s) for dissolution testing, with the goal of making the speed of HPLC competitive with UV analysis. In addition, ultrafast HPLC is critical to the implementation of automated dissolution testing systems with online HPLC analysis (11). There are many approaches to speed up HPLC analysis. One popular way is to use monolithic columns at very high eluent velocities; sub-1-min separations have been achieved (12,13). However, our recent review of different technologies for enhancing speed suggests that the most effective way of achieving very high speed is the combined use of higher temperatures, higher pressures, and smaller particles (14). In addition, substantially lower solvent consumption can be achieved with narrow-bore columns packed with small particles compared to monolithic columns. Therefore, in this column, we focus on optimizing an ultrafast separation under high temperature and high pressure conditions.
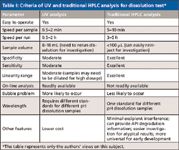
Table I: Criteria of UV and traditional HPLC analysis for dissolution test*
Theory
The goal of most separation optimizations is to achieve either the highest number of plates in a given analysis time or to achieve a given number of plates in the shortest time. For simplicity, here we will discuss only optimization with the goal of achieving the highest plate count in a given analysis time (that is, a fixed column dead time, t0), and refer interested readers to the extensive supporting literature on optimization for more detail (5–9,14). First, we briefly review three different optimization schemes in order of increasing complexity and then propose a simple, practical, stepwise optimization procedure.
One-Parameter Optimization: In this case, one has already chosen a particle size and column length. The only variable left to optimize is velocity. Here, the van Deemter equation (1) is used to calculate the eluent velocity that gives the minimal plate height, provided that this velocity (and flow rate) can be reached within the pressure limit and flow limit of the instrument. Equations 1 and 2 give the van Deemter equation and the optimal linear velocity, respectively, where Dm is the solute diffusion coefficient, dp is particle size, and A, B, and C are van Deemter equation coefficients. It should be noted that throughout this column, it is assumed that the plate height is related to velocity through the van Deemter equation. This is always a rather good approximation as long as one does not work far from the minimum in the plate height curve.
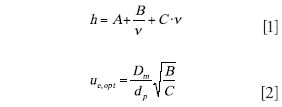
However, the problem of operating at the van Deemter optimum velocity specified by equation 2 is that one frequently cannot achieve the separation in the desired time (using t0 as a proxy for the analysis time) because column length is already chosen. To achieve the target t0, one needs to operate at the velocity given by equation 3, where L is the column length, εt and εe are the total and interstitial porosities of the column, respectively (typically about 0.55 and 0.38), and λ is the ratio of the porosities.

The resulting plate count obtained at this velocity can be calculated easily by inserting equation 3 into equation 1. This plate count is always lower than the plate count calculated based upon the van Deemter optimum velocity; however, it is also the more realistic estimate.
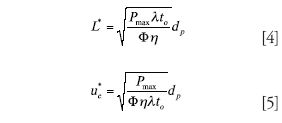
Two-Parameter Optimization: In this case, one has chosen a particle size but needs to optimize both column length and velocity. This is precisely the optimization that is dealt with by the Poppe and kinetic plot techniques. For a given analysis time, there is exactly one optimal combination of column length and velocity that will produce the maximum plate count. Equations 4 and 5 give the optimal column length and velocity; Pmax is the maximum operating pressure, η is mobile phase viscosity, and t0 is the column dead time. It is important to note that the optimal velocity as described here is almost never the same as the van Deemter optimal velocity.
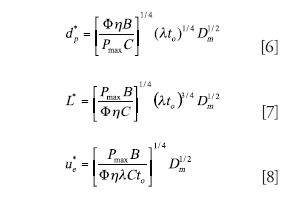
Three-Parameter Optimization: In this case, one simultaneously optimizes the particle size, column length, and eluent velocity. The solution to this optimization is that one must work at the van Deemter optimum but then must also use the particle size, column length, and velocity that are dictated by equations 6–8. This scenario often is referred to as the Knox–Saleem limit (6), which is the absolute best separation one can do assuming the optimal particle size and column length are available and the optimal velocity can be delivered by the pumping system.
It is easy to show that at a given analysis time the three-parameter optimization gives the highest maximum plates followed by the two-parameter and then the one-parameter optimization. Table II gives examples of the optimal conditions and the resulting predicted plate counts for the three scenarios when a separation with 4-s dead time is needed, which corresponds to a total run time of about 30 s (for example, retention time is 24 s with a k of 5). For one-parameter optimization where a 30-mm-long column packed with 1.8-μm particles is preselected, the predicted plate count is 49% lower than that predicted using the three-parameter optimization, and the predicted optimum velocity results in an operating pressure much lower than the instrument maximum. With the two-parameter optimization, a longer column is needed (53 mm) to improve the plate count, but this value is still 29% lower than that predicted for the three-parameter case. When three-parameter optimization is done, a 29-mm-long column packed with 1.0-μm particles is needed but the calculation predicts that almost 15,000 plates can be obtained with a column dead time of only 4 s.
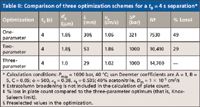
Table II: Comparison of three optimization schemes for a t0 = 4 s separation*
The comparison in Table II is shown in the Poppe plot given in Figure 1. The x-axis is plate count as a measure of efficiency, and the y-axis is "plate time" as a measure of speed. We refer interested readers to the review articles by Desmet (3) and Neue (4). The blue line represents solutions to the three-parameter optimization conducted at 40 °C and 1000 bar. The values on this line also are known as the "Knox–Saleem limit." The red curve shows the results of two-parameter optimization for 1.8-μm particles packed in columns operated at 40 °C and 1000 bar; this curve also is known as the Poppe curve. Obviously, the three-parameter optimum (blue diamond) and the two-parameter optimum (red square) fall on the "Knox–Saleem limit" line and the Poppe curve, respectively. The corresponding plate counts (x-axis values) for these three points on the t0 = 4 s line show that the three-parameter optimization yields the most plates, followed by two-parameter optimization, and then by one-parameter optimization (green circle).
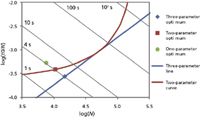
Figure 1: Graphical comparison of the three optimization schemes of Table II.
However, it is also clear from Table II that the optimum column length in the two-parameter optimization and both the optimum column length and particle size in the three-parameter optimization are not commercially available. In reality, one must make compromises and choose the closest available columns (15,16). One needs to make such decisions wisely so that the deviation from the true optimum does not cause a large loss in plate count. Based upon this thinking, we propose a simple stepwise optimization procedure (see Table III) to maximize the plate count in a given analysis time (t0) at a predetermined operating pressure and temperature. We believe this approach will allow one to arrive quickly at the optimum conditions that can be achieved with existing column technologies. In this column, we show an application of this approach to develop an ultrafast isocratic separation for a dissolution test of ciprofloxacin extended release tablets.

Table III: Proposed stepwise optimization procedure for isocratic separations
Experimental
Dissolution conditions: Ciprofloxacin extended-release 500-mg tablets were chosen because a range of sample concentrations can be obtained at different time points. Dissolution was conducted in a USP apparatus 2 (Distek model 2100, Distek, Inc., North Brunswick, New Jersey) at 50 rpm, 37.0 ± 0.5 °C, using 900 mL of 0.1 N hydrochloric acid as the dissolution medium. Samples (10 mL) were taken at 15, 30, 60, 90, and 120 min and filtered through 2-μm glass fiber filters before LC analysis. For UV analysis, a 10-mm flow cell was used and samples were diluted 100-fold before absorbance measurement at 276 nm. A calibration standard was made from a ciprofloxacin hydrochloride reference standard from USP.
HPLC instruments and columns: Chromatographic experiments were conducted on an Agilent 1290 Infinity LC system controlled by Chemstation software (Agilent Technologies, Santa Clara, Calfornia). The 1290 was equipped with a high-pressure mixing binary pump, autosampler, column thermostat, and a photodiode-array detector. To achieve maximal performance in ultrafast separation, it is critical to minimize extracolumn broadening. A 220 mm × 80 μm capillary stainless steel tubing was used between the injection valve and a 1.6-μL microheater in the column thermostat. A 300 mm × 75 μm PEEKSil capillary was used to connect the column to the detector. A prototype 800-nL detector flow cell with a 10-mm pathlength was used with a 160-Hz data acquisition rate. These modifications decreased the extracolumn variance by up to 40% compared to the standard configuration. Separations were conducted at 80 °C in an acidic mobile phase containing 0.1% trifluoroacetic acid. The columns used were a ZORBAX Rapid Resolution HD SB-C18 column (75 × 2.1 mm, 1.8 μm, Agilent Technologies) and a Poroshell 120 SB-C18 column (75 × 2.1 mm, 2.7 μm, Agilent Technologies). Both have StableBond bonded phase chemistry known to be stable at low pH and higher temperature operating conditions.
Results and Discussion
Quality by design (QbD) is a hot topic in the pharmaceutical industry (17). A key element of applying QbD in analytical method development is to first develop the method performance criteria and then optimize the method to meet those requirements (18). In Table IV, we summarize the method performance criteria and method operational intent of the ultrafast separation for dissolution testing. We then develop the optimal method by using the stepwise procedure outlined in Table III.
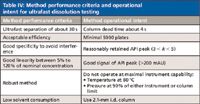
Table IV: Method performance criteria and operational intent for ultrafast dissolution testing
Calculation of optimal conditions: Equations 6–8 clearly suggest that ultrafast separations require small particles, higher pressures, and higher temperatures (9). Therefore, we operated the columns at 80 °C and at 90% of the maximum pressure allowed by either the instrument or the column hardware. In addition to fully porous particles, we also evaluated 2.7-μm superficially porous particles that had been shown to generate performance close to that of sub-2-μm fully porous particles but at lower pressure (19–22).
Flow studies were first conducted on the RRHD SB-C18 1.8-μm column and the Poroshell 120 SB-C18 2.7-μm column using butyrophenone (k = 5) to obtain the van Deemter coefficients. Flow resistance also was calculated from the pressure drop measured during the flow studies. Column porosities were determined by inverse size-exclusion chromatography (23). All these parameters are required to use equations 3–8 to calculate the optimal particle size, column length, and velocity. Tables V and VI give the calculated optimal conditions following the proposed three-step procedure for the RRHD column at 1100 bar and the Poroshell 120 column at 550 bar, respectively.

Table V: Stepwise optimization for t0 = 4 s separation on ZORBAX RRHD SB-C18 at 1100 bar and 80 °C*
The calculation results in step 1 suggest that the optimum particle sizes for t0 = 4 s separation are 0.9 μm for the RRHD column and 1.2 μm for the Poroshell 120 column. Clearly, one has to make compromises and choose the closest available particle sizes, which are 1.8 μm for RRHD and 2.7 μm for Poroshell 120. Thus, the step 2 optimum deviates from the step 1 optimum; 36% and 41% lower plate counts are predicted for RRHD and Poroshell 120 compared to the Knox–Saleem limit. Finally, the optimum column lengths in step 2 are not available, so another compromise must be made. Interestingly, a 75-mm-long column is needed in step 3 for both RRHD and Poroshell 120. An important conclusion drawn from this is that smaller particles do not always mean shorter columns for fast analysis. The optimum column format strongly depends upon many variables, including pressure, temperature, analysis time, and the kinetic characteristics of particles (that is, the van Deemter coefficients). In summary, the calculation predicts that ultrafast separations satisfying the criteria in Table IV can be achieved on both RRHD and Poroshell 120 particles although RRHD offers higher plate count.

Table VI: Stepwise optimization for t0 = 4 s separation on Poroshell 120 SB-C18 at 550 bar and 80 °C*
Ultrafast separation: 75 mm × 2.1 mm columns packed with 1.8-μm totally porous particles and 2.7-μm superficially porous particles were selected based upon the calculations in Tables V and VI. A ciprofloxacin standard solution (0.55 mg/mL free base equivalent) was injected to evaluate the chromatographic performance. Figure 2 shows the chromatograms obtained on the RRHD column and the Poroshell 120 column respectively. In both cases, the separation of ciprofloxacin was completed within 36 s with good efficiencies (N > 7500). Ciprofloxacin also was well retained to minimize possible interference from the excipients. The actual column dead times were longer than 4 s because the very narrow tubing in the system that was necessary to minimize extracolumn broadening generated significant pressure (see Figure 3). Thus, the actual eluent velocities were lower than those predicted in Tables V and VI. However, this practical limitation can be addressed simply by subtracting system backpressure from Pmax used in equations 4–8. Another observation is that the actual plate counts were less than the predicted values. This was caused by column overload broadening due to the large amount of ciprofloxacin (that is, high strength tablet of 500 mg), which is cationic under the acidic eluent conditions. Additionally, extracolumn broadening still causes some efficiency loss, especially for such ultrafast separation, where peak volumes are very small.
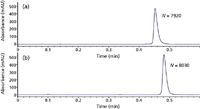
Figure 2: Ultrafast separation of ciprofloxacin: (a) 75 mm à 2.1 mm, 1.8-μm ZORBAX RRHD SB-C18,12.5% B, 2.00 mL/min, 1100 bar; (b) 75 mm à 2.1 mm, 2.7-μm Poroshell 120 SB-C18, 11.5% B, 1.81 mL/min, 550 bar. Mobile phase A: 0.1% trifluoroacetic acid in water; mobile phase B: acetonitrile; temperature: 80 °C; injection volume: 0.3 μL; detection wavelength: 278 nm.
To show the separation efficiency without the overloading effect, methyl-paraben also was injected on the two columns with slightly adjusted mobile phase compositions, and the resulting chromatograms are shown in Figures 3. Clearly, peaks were more symmetrical and significantly higher plate counts were obtained. It should be noted that the higher diffusion coefficient of methylparaben compared to ciprofloxacin also contributed to the higher plate counts observed under ultrafast conditions. The values of N/t0, which is an excellent measure of separation speed, were 2480 and 2010 for RRHD and Poroshell 120, respectively. Veuthey and coworkers (24) have shown that a typical value of N/t0 for sub-2-μm particles at ultrahigh pressure is about 1000 under normal temperature conditions. When higher temperatures are combined (for example, 90 °C) is combined with ultrahigh pressure, N/t0 values as high as 2000 can be achieved (25,26). Our results compare favorably to those reported values and clearly demonstrate that high temperature combined with ultrahigh pressure is a powerful way to achieve ultrafast separations.
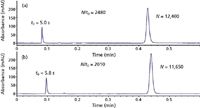
Figure 3: Ultrafast separation of methylparaben. (a) 75 mm à 2.1 mm, 1.8-μm ZORBAX RRHD SB-C18, 17% B, 2.00 mL/min, 1100 bar; (b) 75 mm à 2.1 mm, 2.7-μm Poroshell 120 SB-C18, 15% B, 1.81 mL/min, 550 bar. LC conditions as in Figure 2. Dead time marker was uracil.
Dissolution results by LC and UV: The ultrafast separations in Figure 2 meet the method performance criteria listed in Table IV and were applied in the dissolution testing of ciprofloxacin 500-mg extended release tablets. Dissolution samples were first analyzed by UV as a reference point. The samples were then analyzed by the ultrafast LC methods on both the 1.8-μm C18 and the 2.7-μm C18 columns. Figure 4 shows the dissolution profiles with the three analysis methods and clearly equivalent results were obtained.
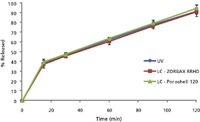
Figure 4: Dissolution profiles of ciprofloxacin 500-mg extended release tablets (n = 6) using three testing methods: UV, ultrafast LC on 1.8-μm ZORBAX RRHD SB-C18, and ultrafast LC on 2.7-μm Poroshell 120 SB-C18.
The ultrafast LC analysis of all dissolution samples was complete in less than an hour. This is 3–5 times faster than traditional HPLC used in dissolution testing. This is also faster than or comparable to common automated UV analysis. Each sample analysis with the ultrafast LC took 76 s, including a 36-s separation time and a 40-s injection and data processing time. The injection took the same time as the actual separation, partly due to the external needle wash step necessary to minimize carryover. Clearly, further reduction of separation time would require a concomitant reduction in injection time to fully realize the gain in chromatographic speed. It should be noted that the dissolution samples had to be diluted before the UV measurement due to the high concentrations and this substantially lengthened the UV analysis time. Clearly, the ability of LC to handle wide sample concentration range is a big advantage over UV. In summary, the ultrafast separation is substantially faster than traditional HPLC analysis and is ideal for pharmaceutical dissolution testing. Other possible applications include uniformity of dosage forms testing and cleaning testing.

Table VII: Symbols used in this column.
Conclusions
A simple, stepwise optimization procedure has been developed that optimizes particle size, column length, and eluent velocity to achieve the highest plate count in a given analysis time. This approach succeeded in developing an ultrafast separation on the order of 30 s with both sub-2-μm fully porous particles at ultrahigh pressures (1100 bar) and sub-3-μm superficially porous particles at moderate pressures (550 bar). Extremely high values of N/t0 (>2000), an excellent separation speed, were achieved by operating the columns at elevated temperatures. Such ultrafast separations are ideal for pharmaceutical dissolution testing and is 3–5 times faster than traditional HPLC separation used for this application.
Acknowledgments
X. Wang thanks Drs. Partha Mukherjee, Patrik Petersson, Steve Cook, Rick Lung, and Brad Mueller at AstraZeneca Pharmaceuticals for helpful discussion.
Ronald E. Majors "Column Watch" Editor Ronald E. Majors is Senior Scientist, Columns and Supplies Division, Agilent Technologies, Wilmington, Delaware, and is a member of LCGC's editorial advisory board. Direct correspondence about this column to "Column Watch," LCGC, Woodbridge Corporate Plaza, 485 Route 1 South, Bldg F, First Floor, Iselin, NJ 08830, e-mail lcgcedit@lcgcmag.com

Ronald E. Majors

Xiaoli Wang Xiaoli Wang received the Ph.D. degree in analytical chemistry from the University of Minnesota, Minneapolis, Minnesota, under the direction of Prof. Peter W. Carr, in 2006. He is currently R&D scientist, Chemistries and Supplies Division, Agilent Technologies, Wilmington, Delaware.

Peter W. Carr Peter W. Carr received his B.S. in Chemistry (1965) from the Polytechnic Institute of Brooklyn, where he worked with Professor Louis Meites, and a Ph.D. in Analytical Chemistry at Pennsylvania State University (1969) under the guidance of Professor Joseph Jordan. He was a research assistant and associate at Brookhaven National Laboratory during the summers of 1965 and 1966 and a postdoctoral associate with Prof. David Glick at Stanford University Medical School (1968). From 1969 until 1977, he was with the University of Georgia (Athens).
In 1977, he joined the University of Minnesota, where he became Professor of Chemistry in 1981. He has won numerous awards including the Eastern Analytical Award in Separation Science, the Dal Nogare Award of the Chromatography Forum of the Delaware Valley, and the ACS (Supelco) Award in Chromatography. Most recently he was awarded the Horvath Medal and the Martin Medal.

Dwight Stoll Dwight Stoll began his career in chromatography working in the HPLC column industry from 1999 to 2003. He received the Ph.D degree in analytical chemistry from the University of Minnesota, Minneapolis, Minnesota, in 2007, working under the direction of Prof. Peter W. Carr. Currently he is Assistant Professor of chemistry at Gustavus Adolphus College in Saint Peter, Minnesota, where he teaches analytical chemistry and directs a vibrant research program involving primarily undergraduates. In 2009, he was the winner of the John B. Phillips award for contributions to multidimensional gas chromatography, along with coworkers Prof. Peter Carr and Prof. Joe Davis.
References
(1) J.J. van Deetmer, F.J. Zuiderweg, and A. Klinkenberg, Chem. Eng. Sci. 5, 271–289 (1956).
(2) H. Poppe, J. Chromatogr., A 778, 3–21 (1997).
(3) G. Desmet, LCGC North America 26(6), 514–530 (2008).
(4) U. Neue, LCGC North America 27(11), 974–983 (2009).
(5) I. Halász and G. Görlitz, Angew. Chem. Int. Ed. Engl. 21, 50–61 (1982).
(6) J. Knox and M. Saleem, J. Chrom. Sci. 7, 614–622 (1969).
(7) F. Antia and C. Horvath, J. Chromatogr., A 435, 1–15 (1988).
(8) G. Guiochon, in Advances and Perspectives in Liquid Chromatography, C. Horvath, Ed. (Academic Press, New York, 1980), pp. 1–56.
(9) P.W. Carr, X. Wang and D.R. Stoll, Anal. Chem. 81, 5342–5353 (2009).
(10) http://www.dissolution.com/vbulletin/showthread.php?t=1808
(11) Q. Wang and V. Gray, HPLC in Dissolution Testing, Vol. 6 of Handbook of Pharmaceutical Analysis by HPLC (Elsevier, London, UK 2005).
(12) M. Golden, Y. Mao, W. Bowen, and R. Reed, "Ultrafast HPLC Method for Pharmaceutical Dissolution and Content Uniformity Testing Using Monolithic Column," poster at AAPS 2005.
(13) P.D. Tzanavaras, D.G. Themelis, A. Zotou, J. Stratis, and B. Karlberg, J. Pharm. Biomed. Anal. 46, 670–675 (2008).
(14) P.W. Carr, D.R. Stoll, and X. Wang, Anal. Chem., submitted for publication.
(15) L.R. Snyder, J.J. Kirkland, and J.W. Dolan, Introduction to Modern Liquid Chromatography (John Wiley & Sons, Inc., Hoboken, New Jersey, 2010), pp. 35–53.
(16) G. Desmet, D. Clicq, D.T.T. Nguyen, D. Guillarme, S. Rudaz, J.L. Veuthey, N. Vervoort, G. Torok, D. Cabooter, and P. Gzil, Anal. Chem. 78, 2150–2162 (2006).
(17) International Conference on Harmonization, Pharmaceutical Quality System, Q10, June 2008.
(18) P. Borman, P. Nethercote, M. Chatfield, D. Thompson, and K. Truman, Pharm. Technol., October 2, 2007, 142–152.
(19) J.M. Cunliffe and T.D. Maloney, J. Sep. Sci. 30, 3104–3109 (2007).
(20) J.J. DeStefano, T.J. Langlois, and J.J. Kirkland, J. Chromatogr. Sci. 46, 254–260 (2008).
(21) Y. Zhang, X. Wang, P. Mukherjee, and P. Petersson, J. Chromatogr., A 1216, 4597–4605 (2009).
(22) F. Gritti, I. Leonardis, D. Shock, P. Stevenson, A. Shalliker, and G. Guiochon, J. Chromatogr., A 1217, 1589–1603 (2010).
(23) M. Al-Bokari, D. Cherrak, and G. Guiochon, J. Chromatogr., A 975, 275–284 (2002).
(24) D.T.T. Nguyen, D. Guillarme, S. Rudaz, and J.L. Veuthey, J. Chromatogr., A 1128, 105–113 (2006).
(25) D.T.T. Nguyen, D. Guillarme, S. Heinisch, M.P. Barrioulet, J.L. Rocca, S. Rudaz, and J.L. Veuthey, J. Chromatogr., A 1167, 76–84 (2007).
(26) S. Heinisch, G. Desmet, D. Clicq, and J.L. Rocca, J. Chromatogr., A 1203, 124–136 (2008).

Common Challenges in Nitrosamine Analysis: An LCGC International Peer Exchange
April 15th 2025A recent roundtable discussion featuring Aloka Srinivasan of Raaha, Mayank Bhanti of the United States Pharmacopeia (USP), and Amber Burch of Purisys discussed the challenges surrounding nitrosamine analysis in pharmaceuticals.
Extracting Estrogenic Hormones Using Rotating Disk and Modified Clays
April 14th 2025University of Caldas and University of Chile researchers extracted estrogenic hormones from wastewater samples using rotating disk sorption extraction. After extraction, the concentrated analytes were measured using liquid chromatography coupled with photodiode array detection (HPLC-PDA).


