Improving HPLC Separation of Polyphenols
LCGC North America
This article highlights a number of recent developments in HPLC for polyphenol analysis.
Polyphenols represent one of the most studied classes of natural compounds. Interest in these ubiquitous secondary metabolites, in recent times in particular, stems from their physiological contribution to the human diet and the numerous health benefits associated with their consumption. In addition, polyphenols are responsible for a range of organoleptic properties, including color, astringency, bitterness and mouth-feel, as well as ageing properties (1).
Clearly, the analysis of these compounds is of significant importance in various fields, particularly in the food and beverage and nutraceutical industries. However, the accurate analytical determination of phenolic compounds is hampered by the sheer complexity of the numerous chemical classes and species classified as polyphenols. These broadly include phenolic acids (hydroxybenzoic and cinnamic acids) and flavonoids, the latter class being subdivided into flavonols, flavanols (and their polymeric derivatives, the proanthocyanidins) and anthocyanins (anthocyanin-glycosides) (Figure 1).

Figure 1: General structures of the principal classes of phenolics. R is commonly H, OH or OCH3, while R1 may be OH, O-glycosyl, or O-acyl-glycosyl.
The investigation of polyphenols is therefore closely related to the development of suitable analytical techniques for their identification and quantification. High performance liquid chromatography (HPLC), and reversed-phase LC in particular, is most often used for the routine analysis of phenolics, while in recent years the hyphenation of HPLC to mass spectrometry (MS) has become an indispensable tool for the detailed investigation of these compounds (2).
The resolving power of chromatographic methods is commonly measured in terms of peak capacity: the number of peaks that can theoretically be resolved with unit resolution using a given separation method. The peak capacity (np) for gradient separations can be calculated according to the following equation (3):

where tg is the gradient run time and w mean the average (4σ) peak width. Common gradient reversed-phase LC methods typically provide peak capacities in the order of 100–150 (for ~1 h analysis times). Considering that the peak capacity should significantly exceed the number of randomly distributed analytes in a given sample to provide a high likelihood of separation (4), and the fact that typical phenolic extracts contain in excess of 100 species, the limitations of HPLC are evident.
Importantly, in recent years a number of significant developments in HPLC have contributed to deliver improved performance. These include the use of ultrahigh-pressure liquid chromatography (UHPLC), new developments in stationary phase morphologies (monolithic columns and superficially porous particles), high temperature liquid chromatography (HTLC) and multidimensional LC separations. In this contribution we discuss the beneficial application of some of these new technologies to improve the analysis of polyphenols in a variety of samples.
Experimental
Reagents and materials: Cocoa beans, wine, blueberries and green tea were purchased from a local supermarket. Epicatechin, catechin and uracil standards were from Sigma-Aldrich (Atlasville, South Africa), and anthocyanin standards from Polyphenols Laboratories (Sandnes, Norway). Dimeric procyanidins were isolated by hydrophilic interaction chromatography (HILIC) fractionation from a cocoa extract. Mobile phases were prepared from HPLC-grade solvents (Sigma) and Milli-Q deionized water (Millipore, Milford, Massachusetts).
Sample preparation: Extracts of green tea and cocoa were prepared as reported previously (5,6). For extraction of blueberry anthocyanins, 6.681 g of blueberries was frozen and ground under liquid nitrogen and extracted with methanol–water–formic acid (60:37:3), followed by evaporative preconcentration. Filtered wine samples were directly injected.
Instrumentation: HPLC–UV analyses were performed on an Alliance 2690 HPLC equipped with a photodiode-array (PDA) detector (Waters, Milford, Massachusetts). UHPLC experiments were performed on an Acquity UPLC system with PDA detector (Waters). HPLC–ESI-MS analyses were performed on a UPLC system coupled to a Waters Ultima Q-TOF mass spectrometer operated in positive ionization (PI) mode (6). Blueberry anthocyanins were tentatively identified by MS and MS2 spectra and comparison of retention times with literature reports (7). The following columns were used: XBridge C18 (250 mm × 4.6 mm, 5 μm) and Acquity BEH C18 (50 and 100 mm × 2.1 mm, 1.7 μm, both Waters), Zorbax SB C18 (50 mm × 4.6 mm, 1.8 μm, Agilent, Waldbronn, Germany) and Develosil Diol-100 (250 mm × 1 mm, 5 μm, Nomura Chemical, Japan).
Chromatographic Conditions
Cocoa procyanidins and green tea flavonols: HPLC analyses at 25 °C were performed using 0.1% formic acid (A) and acetonitrile (B) at a flow rate of 1 mL/min: 0–0.63 min (2% B), 0.63–27 min (2–18% B), 27–45 min (18–25% B), 45–51.75 min (25–100% B), 51.75–56.25 min (100% B). UHPLC analyses were performed on a 100 mm Acquity column at 50 °C using the following gradient at 0.3 mL/min: 0–0.17 min (2% B), 0.17–7.4 min (2–18% B), 7.4–12.48 min (18–25% B), 12.48–14.53 min (25–100% B), 14.53–15.6 min (100% B). UV detection was performed at 280 and 370 nm for procyanidins and flavonols, respectively.
Wine anthocyanins: Mobile phases consisted of 7.5% formic acid (A) and acetonitrile (B). HPLC analyses were performed on the XBridge column at 25 °C and 1 mL/min using the following gradient: 0–1 min (1% B), 1–12 min (1–13.5% B), 12–24 min (13.5–23.5% B), 24–28 min (23.5–28.5% B), 28–35 min (28.5% B). UHPLC analyses were performed on two coupled 100-mm Acquity columns at 50 °C and 0.06 mL/min as follows: 0–3 min (1% B), 3–34 min (1–13.5% B), 34–67 min (13.5–23.5% B), 67–78 min (23.5–28.5% B), 78–98 min (28.5% B). UV detection was performed at 500 nm.
Blueberry anthocyanins: Analyses were performed on the XBridge column using the same mobile phases as for wine anthocyanins. A flow rate of 1 mL/min was used throughout with the following gradients: 0–50 min (1–25% B), 50–55 min (25–40% B) at 25 °C; and 0–50 min (1–20% B), 50–55 min (25–40% B) at 70 °C. A postcolumn split (1:4) was used before eluent introduction into the MS.
HILIC×reversed-phase LC: Conditions were as reported elsewhere (5,6).
van Deemter Experiments
For procyanidins, experiments were performed on the XBridge column at 25 °C and on a 50-mm Acquity column at 25 °C and 50 °C, and for anthocyanins on the XBridge column at 25 °C and 70 °C. Mobile phases were as specified for each of these samples above, with the composition varied to ensure similar retention factors at all temperatures. Uracil was used as unretained marker, and all experiments were performed in duplicate. van Deemter curves and kinetic plots were constructed according to reference 8.
Results and Discussion
Unidimensional HPLC analyses: Since the inception of HPLC, there has been a continuous drive to improve the performance of the technique. The most widely practiced approach is to reduce the particle size (dp) of column packing. The benefit of this approach is illustrated by the van Deemter curve, which plots chromatographic efficiency, in terms of plate height (H = L/N, where N is the number of theoretical plates) as a function of linear velocity of the mobile phase, u0. The optimal linear velocity, uopt, is that mobile phase velocity (flow rate) which delivers the minimum plate height (Hmin) and therefore maximum efficiency. The effect of dp on the van Deemter curve is demonstrated in Figure 2a for a dimeric procyanidin analyzed on 5- and 1.7-μm columns. It is clear that uopt increases and Hmin decreases with a reduction in dp, implying that faster and more efficient analyses are possible on the smaller phase for equal column lengths.
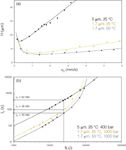
Figure 2: (a) Comparison of van Deemter curves for procyanidin dimer on 5- and 1.7-μm columns at 25 °C and 50 °C. (b) Corresponding kinetic plots of efficiency versus analysis time.
In fact, this picture is not entirely accurate, since decreasing dp leads to a very important decrease in column permeability. Pressure constraints ultimately limit the column length and therefore efficiency attainable, so that very high efficiencies are easier to achieve for larger particle sizes (a result of the higher permeability of the larger dp phases). Note though that the price to pay for such high efficiencies is a very significant increase in analysis time.
This dilemma has been partially overcome by the availability of a new generation of high-pressure instrumentation. In Figure 2b the isocratic efficiency as a function of total analysis time for the procyanidin dimer is compared for the same 5- and 1.7-μm columns, the latter operated at pressures up to 1000 bar. Note the significant decrease in analysis time achieved on the UHPLC column for an efficiency of 25,000 plates (equal to that provided by a conventional 250-mm, 5-μm column). Moreover, UHPLC clearly offers faster analysis for efficiencies up to N ≈ 80,000.
It is relatively straightforward to practically exploit the benefits of UHPLC because HPLC methods may nowadays easily be adapted to UHPLC column formats and instrumentation, essentially providing the same separation mechanism. To date this approach has received comparatively little attention for polyphenol analysis (9,10), with the focus primarily on very fast analysis on short columns, essentially providing the same efficiency as conventional HPLC columns.
Increasing the temperature of HPLC separations provides an additional means of improving performance.11 This is primarily a result of faster analyte diffusion in the mobile phase at higher temperatures. The effect of this on plate height behavior is demonstrated once again for the dimeric procyanidins on the 1.7-μm column in Figure 2: While the maximum column efficiency (= L/Hmin) remains roughly unchanged, the optimal linear velocity increases and efficiency-loss at high flow rates is reduced. At higher analysis temperature the flow rate should be increased to operate close to uopt, in this manner providing the same efficiency faster. Note that even though the mobile phase viscosity is inversely proportional to temperature, the requirement of operating at higher flow rates means that the overall pressure remains roughly constant.
In fact, elevated temperature offers a complementary means of further increasing the speed of UHPLC separations for efficiencies up to N ≈ 80,000. The benefits of this approach are illustrated in Figure 3, where conventional HPLC analysis of cocoa procyanidins and green tea flavonols are compared to UHPLC analysis at 50 °C. This approach provides similar separation in a third of the analysis time, demonstrating obvious advantages for routine analysis of polyphenols.
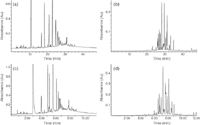
Figure 3: Comparison of HPLC analysis of cocoa procyanidins and green tea flavonols at 25 °C on a 5-μm XBridge column (a) and (b) respectively, and at 50 °C on a 1.7-μm column (c) and (d) respectively. Detection was performed at 280 nm and 370 nm for procyanidins and flavonols, respectively. ÎPmax = 193 and 505 bar for HPLC and UHPLC analyses.
For anthocyanins (anthocyanidin-glycosides, Figure 1), analysis temperature plays a particularly important role. These compounds are known to exist in solution in a number of different chemical forms (12). On-column interconversion between these species causes significant band broadening (13), leading to the relatively poor efficiency commonly observed for HPLC analyses of anthocyanins. Higher analysis temperatures speed up the interconversion reactions — leading to less band-broadening and improved efficiency. This is demonstrated for the van Deemter curves of four common anthocyanins in Figure 4. At conventional flow rates (that is, 1 mL/min on 4.6-mm i.d. columns), an improvement in efficiency of 25–130% is achieved at 70 °C compared with 25 °C. In this manner elevated temperature may be used to improve the efficiency of conventional gradient reversed-phase LC analysis of anthocyanins, as demonstrated for blueberry anthocyanins in Figure 5. Also note that temperature may affect the selectivity of the separation, as is evident from the relative elution order of some anthocyanins in Figure 5.
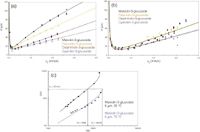
Figure 4: van Deemter plots for four anthocyanins on a 5-μm XBridge column at (a) 25 °C and (b) 70 °C and (c) corresponding kinetic plots of efficiency versus retention time for malvidin-3-O-glucoside
The previous examples demonstrate how analysis speed for polyphenol analysis may be increased (for the same efficiency) or efficiency increased for the same analysis time. Another approach especially suited for complex phenolic fractions, is to exploit the benefits of UHPLC and elevated temperature for high-efficiency analysis. This is demonstrated for the analysis of red wine anthocyanins on a 200-mm, 1.7-μm column operated at 50 °C in Figure 6 (14). This set-up provides isocratic efficiencies of up to 40,000 plates, and gradient analysis delivers much improved resolution for an acceptable analysis time of 90 min. Note that this analysis is performed at pressures below 300 bar, implying that conventional instrumentation may be used (provided system delay and void volumes are optimized for such analyses).
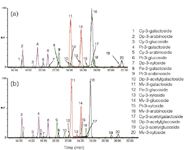
Figure 5: Extracted ion chromatograms for the gradient HPLCâMS analysis of blueberry anthocyanins on a 5-μm XBridge column: (a) at 25 °C, and (b) at 70 °C, both at 1 mL/min. Cy = cyanidin, Dp = delphinidin, Pt = petunidin, Pe = peonidin and Mv = malvidin.
However, caution should be exercised in the application of elevated temperature for phenolic analysis. As is well documented in literature, anthocyanins in particular are readily degraded at relatively mild temperatures. Fortunately this aspect may be evaluated quantitively. Using the approach of Thompson and colleagues (15) it at can be demonstrated that analysis times of less than 2 h at 70 °C do not lead to on-column degradation of anthocyanins (13).
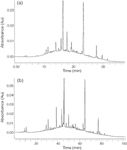
Figure 6: Comparison of gradient reversed-phase LC analysis of red wine anthocyanins on a (a) 5-μm XBridge column at 25 °C and 1 mL/min and a (b) 1.7-μm Acquity column at 50 °C and 0.06 mL/min (14). UV detection at 500 nm. ÎPmax = 190 and 295 bar for HPLC and UHPLC analyses.
Finally, in the context of unidimensional HPLC analysis, it should be mentioned that a number of additional developments in column technology in recent years hold some promise for HPLC analysis of polyphenols. These include the use of monolithic (16) and superficially porous particles (17). However, limited application of these column formats to polyphenol determination has been reported to date (18).
Comprehensive two-dimensional liquid chromatography (LC×LC)
The challenges associated with HPLC analysis of phenolics may be demonstrated using an example: procyanidins (Figure 1) consist of a mixture of monomeric, oligomeric and polymeric compounds composed of flavanol building blocks. As the degree of polymerization (DP) increases, the number of possible isomers increases exponentially (a result of the possible combinations of monomers as well as different inter-flavanol bonds). For example, 48 isomers of dimeric procyanidins containing catechin and epicatechin building blocks are possible (19). Considering that optimized high-efficiency HPLC methods provide peak capacities of maximally 400, no unidimensional HPLC method is capable of providing complete separation of higher molecular weight (MW) procyanidins in a single analysis.
Comprehensive two-dimensional HPLC (LC×LC) is a promising method for the separation of such complex samples. LC×LC delivers peak capacities an order of magnitude or more than unidimensional LC. In LC×LC, two separation methods are combined in such a manner that the separation in each dimension is retained. As a consequence, the overall peak capacity in a two-dimensional space is (ideally) the product of peak capacities in each dimension. Admittedly, this ideal is only achieved if certain criteria are met, most importantly that both separations are based on different (orthogonal) mechanisms.
Comprehensive 2-D LC may be performed in off-line, on-line or stop-flow modes (19). In on-line LC×LC, fractions from the first dimension are transferred in real time to the second dimension column, usually using multi-port two-position switching valves. This approach provides relatively fast (approximately equal to 1-D HPLC methods) separations, although resolution in the second dimension is sacrificed to meet sampling rate requirements. Off-line LC×LC, by contrast, results in much longer analysis times, but since no constraints are placed on the second-dimension separation much higher peak capacities may be obtained. (Stop-flow LC×LC is less often applied, and provides peak capacities and analysis times in between the off-line and on-line approaches).
In fact, the application of on-line LC×LC using a variety of separation modes has been demonstrated for diverse phenolics in wine, beer and herb samples (18,21,22). In our group, we have investigated the off-line coupling of HILIC and reversed-phase LC to improve procyanidin determination (5). Off-line coupling was chosen to obtain the maximal practical peak capacity through optimal second-dimension analyses. In HILIC, procyanidins are separated according to polarity, which effectively provides molecular weight separation based on the number of hydroxyls (individual isomers are co-eluted) (23). Reversed-phase LC, in contrast, provides isomeric separation according to hydrophobicity — although complete separation of isomers in not possible in a single analysis. HILIC and reversed-phase LC therefore provide highly orthogonal separations. The off-line comprehensive HILIC×reversed-phase LC analysis of cocoa procyanidins is illustrated in Figure 7, where it is evident that the combination of MW (HILIC, y-axis) and isomeric (reversed-phase LC, x-axis) information delivers a complete picture of the oligomeric procyanidin content of this extract. The practical peak capacity for this separation (according to reference 24) is ≈3500.
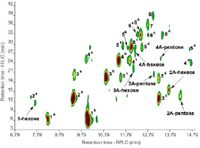
Figure 7: HILICÃreversed-phase LC analysis of cocoa procyanidins. Numbers correspond to degree of polymerization of procyanidins, A indicates A-type procyanidins. Refer to reference 5 for further details.
The same approach may also be used beneficially for the analysis of other classes of phenolic compounds. This is illustrated in Figure 8 for flavonol glycosides in green tea (practical peak capacity 2500). A very structured elution pattern reminiscent of comprehensive GC is evident from this figure: retention in HILIC increases with the number of attached sugars, while the different flavonol moieties as well as individual mono-, di-, and tri-glycosides are resolved in the reversed-phase LC dimension. It may be concluded that HILIC×reversed-phase LC, and LC×LC in general, holds significant promise for the in-depth investigation of complex phenolic fractions such as encountered in numerous natural products.
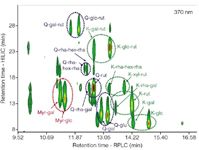
Figure 8: HILICÃreversed-phase LC analysis of green tea flavonols. Data taken from reference 6. Myr = myricetin, Q = querectin, K = kaempferol, gal = galactoside, glc = glucoside, rha = rhamnoside, xyl = xyloside, rut = rutinoside and hex = unkown hexose.
Conclusions
The analysis of polyphenols represents a severe analytical challenge, and important advances in natural phenolic research hinge on the development of suitable separation strategies. Fortunately, recent developments in HPLC show promise for improving polyphenol analysis.
A summarized comparison of conventional HPLC, UHPLC and elevated temperature LC and LC×LC analyses of different phenolic compounds is presented in Table I. These examples demonstrate that the combination of small dp columns and temperature primarily delivers improved peak capacity production rates. This advantage can be practically exploited in one of two ways: to achieve similar peak capacities to conventional HPLC 3–4× faster (for example, cocoa procyanidins, green tea flavonols); and to improve the peak capacity for a given analysis time (for example, blueberry anthocyanins). These techniques show particular promise in improving current routine HPLC methods for polyphenol determination. In addition, application of UHPLC columns operated at elevated temperatures allows improved total peak capacity for complex phenolic fractions (for example, red wine anthocyanins).
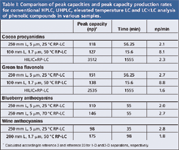
Table I: Comparison of peak capacities and peak capacity production rates for conventional HPLC, UHPLC, elevated temperature LC and LCÃLC analysis of phenolic compounds in various samples.
For very demanding separations, off-line comprehensive 2-D LC offers greatly improved separation power compared with HPLC (>20× higher peak capacities) at similar peak capacity production rates. The choice of the most suitable separation methodology will therefore depend on the requirements for a particular phenolic sample in terms of speed, instrumental simplicity or resolving power.
It should be noted that state-of-the-art mass spectrometric (MS) techniques such as high resolution MS and tandem MS methods, not addressed in the current contribution, represent a complimentary strategy for improving polyphenol analysis. In fact, MS offers an alternative 'separation' dimension (in terms of m/z), increased selectivity for target analysis and a powerful structural elucidation tool. Combined with advanced chromatographic separation, LC–MS will prove an even more powerful tool for detailed phenolic determination.
Clearly, the judicious application of recent advances in HPLC demonstrably offers significant benefits for phenolic analyses, and shows promise for the in-depth investigation of the phenolic compounds found in numerous natural products — an endeavor that, to date, has been hampered by the lack of suitable separation methods.
Acknowledgments
The authors gratefully acknowledge Stellenbosch University, the Third World Academy of Science (TWAS, 08-077 RG/CHE/AF/AC) and NRF for financial assistance.
André de Villiers is a senior lecturer at the Department of Chemistry and Polymer Science at Stellenbosch University, South Africa. His research activities include fundamental studies and the practical application of HPLC, CE, GC, MS and sample preparation techniques especially to natural product analysis. He is author or co-author of 24 scientific papers, and the recipient of the 2009 Csaba Horvath Award.
Kathithileni M. Kalili is a first year PhD student at Stellenbosch University. Her research focuses on the development of novel comprehensive multi-dimensional high performance liquid chromatography (HPLC) and electromigration methods for the analysis of complex phenolics.
Mareta Malan is a part-time MSc student at Stellenbosch University. She works for Freeworld Coatings Research Centre in Stellenbosch as an analytical chemist where her research is focused on method development for the analysis of surface coatings.
Jeanine Roodman is currently working as a chemical analyst in a food laboratory. She completed her honours degree in chemistry at Stellenbosch University focused on the application of high temperature liquid chromatography to anthocyanin analysis.
References
(1) E. Haslam, Practical Polyphenolics: From Structure to Molecular Recognition and Physiological Action (Cambridge University Press, Cambridge, 1998).
(2) C. Santos-Buelga and G. Williamson, Methods in Polyphenol Analysis (The Royal Society of Chemistry, Cambridge, 2003).
(3) U.D. Neue, J. Chromatogr. A 1079(1–2), 153–161 (2005).
(4) J.M. Davis and J.C. Giddings, Anal. Chem. 55(3), 418–424 (1983).
(5) K.M. Kalili and A. de Villiers, J. Chromatogr. A 1216(35), 6274–6284 (2009).
(6) K.M. Kalili and A. de Villiers, J. Sep. Sci. 33(6–7), 853–863 (2010).
(7) M.J. Cho et al., J. Sci. Food Agric. 84(13), 1771–1782 (2004).
(8) G. Desmet, D. Clicq, and P. Gzil, Anal. Chem. 77(13), 4058–4070 (2005).
(9) B. Klejdus et al., J. Chromatogr. A 1195(1–2), 52–59 (2008).
(10) M. Schwarz et al., J. Sep. Sci. 32(11), 1782–1790 (2009).
(11) F. Lestremau et al., J. Chromatogr. A 1138(1–2), 120–131 (2007).
(12) R. Brouillard and J.-E. Dubois, J. Am. Chem. Soc. 99(5), 1359–1364 (1977).
(13) A. de Villiers et al., J. Chromatogr. A 1216(15), 3270–3279 (2009).
(14) A. de Villiers et al., unpublished results (2010).
(15) J.D. Thompson and P.W. Carr, Anal. Chem. 74(5), 1017–1023 (2002).
(16) G. Guiochon, J. Chromatogr. A 1168(1–2), 101–168 (2007).
(17) F. Gritti et al., J. Chromatogr. A 1217(10), 1589–1603 (2010).
(18) P. Dugo et al., J. Sep. Sci. 31(19), 3297–3308 (2008).
(19) R. Mayer et al., J. Agric. Food Chem. 56(16), 6959–6966 (2008).
(20) J.N. Fairchild, K. Horváth, and G. Guiochon, J. Chromatogr. A 1216(9), 1363–1371 (2009).
(21) P. Cesla, T. Hájek, and P. Jandera, J. Chromatogr. A 1216(16), 3443–3457 (2009).
(22) T. Hájek et al., J. Sep. Sci. 31(19), 3309–3328 (2008).
(23) A. Yanagida et al., J. Chromatogr. A 1143(1–2), 153–161 (2007).
(24) Z. Liu, D.G. Patterson and M.L. Lee, Anal. Chem. 67(21), 3840–3845 (1995).

Common Challenges in Nitrosamine Analysis: An LCGC International Peer Exchange
April 15th 2025A recent roundtable discussion featuring Aloka Srinivasan of Raaha, Mayank Bhanti of the United States Pharmacopeia (USP), and Amber Burch of Purisys discussed the challenges surrounding nitrosamine analysis in pharmaceuticals.
Extracting Estrogenic Hormones Using Rotating Disk and Modified Clays
April 14th 2025University of Caldas and University of Chile researchers extracted estrogenic hormones from wastewater samples using rotating disk sorption extraction. After extraction, the concentrated analytes were measured using liquid chromatography coupled with photodiode array detection (HPLC-PDA).


